EP1519142A2 - Method and system for image processing for profiling with structured light - Google Patents
Method and system for image processing for profiling with structured light Download PDFInfo
- Publication number
- EP1519142A2 EP1519142A2 EP04255149A EP04255149A EP1519142A2 EP 1519142 A2 EP1519142 A2 EP 1519142A2 EP 04255149 A EP04255149 A EP 04255149A EP 04255149 A EP04255149 A EP 04255149A EP 1519142 A2 EP1519142 A2 EP 1519142A2
- Authority
- EP
- European Patent Office
- Prior art keywords
- image processing
- processing method
- distribution
- structured light
- intensity
- Prior art date
- Legal status (The legal status is an assumption and is not a legal conclusion. Google has not performed a legal analysis and makes no representation as to the accuracy of the status listed.)
- Granted
Links
Images


Classifications
-
- G—PHYSICS
- G01—MEASURING; TESTING
- G01B—MEASURING LENGTH, THICKNESS OR SIMILAR LINEAR DIMENSIONS; MEASURING ANGLES; MEASURING AREAS; MEASURING IRREGULARITIES OF SURFACES OR CONTOURS
- G01B11/00—Measuring arrangements characterised by the use of optical techniques
- G01B11/24—Measuring arrangements characterised by the use of optical techniques for measuring contours or curvatures
- G01B11/25—Measuring arrangements characterised by the use of optical techniques for measuring contours or curvatures by projecting a pattern, e.g. one or more lines, moiré fringes on the object
-
- G—PHYSICS
- G06—COMPUTING; CALCULATING OR COUNTING
- G06T—IMAGE DATA PROCESSING OR GENERATION, IN GENERAL
- G06T7/00—Image analysis
- G06T7/50—Depth or shape recovery
- G06T7/521—Depth or shape recovery from laser ranging, e.g. using interferometry; from the projection of structured light
Definitions
- the present invention relates generally to structured light profiling of a part and more specifically to methods and systems for image processing to obtain a three dimensional profile of a part using a structured light source.
- a three dimensional profile of a part is obtained by using a laser source and at least one video camera.
- a laser source emanates a laser beam and spreads into multiple (one or more) laser stripes which strikes a surface of a part. These stripes are viewed from one or more video cameras from an angle other than the illumination angle.
- applications for structured light profiling include obtaining shape profile information about the part or generating a 3D contour map of the part.
- the limitations of using laser stripes to obtain accurate profile information are mainly attributed to sampling error and the noise associated with the laser because the center of a laser stripe may not be imaged at the center of the pixel of the camera and may not be the detected intensity peak.
- Sampling error occurs while locating the center of the laser stripe on the image.
- image processing techniques such as maximum intensity, intensity center, Gaussian fitting and zero-crossing which attempt to extract the relevant information from the laser stripe.
- the associated problem with several of these techniques is that it gives the location of the highest peak, which is not the true center of the stripe.
- Current correction techniques for this error include neighborhood averaging over neighboring pixels and doing a weighted average or using fitting methods, but these techniques also fail to adequately address the sampling error.
- the noise associated with the laser primarily takes the form of laser speckle, which is the oscillation of the intensity profile for a laser when it is reflected from the surface of the part and is caused by coherency of the laser.
- speckle noise is by choosing an appropriate viewing system. By changing the size of the aperture, the size of the speckle changes, the larger the aperture, the smaller the size of the speckle. However, in this case there's a depth of field tradeoff.
- an image processing method for structured light profiling includes sampling an image of a structured light pattern to obtain an intensity distribution. A number of sets of sampled points are then selected from the intensity distribution, where each of the respective sets includes a number of sampled points. Each of the sets of sampled points is then fitted to a respective distribution function. Finally, the distribution functions are filtered to select a representative distribution function for the intensity distribution.
- a system for obtaining a three dimensional profile of a part using a structured light pattern includes a source of structured light positioned at a predetermined distance from a part, where the source projects a beam of structured light to illuminate the part.
- the system also includes at least one imaging device configured to acquire an image of a structured light pattern of the part, where the at least one imaging device is positioned such that an angle of view of the imaging device is different from an angle of illumination of the source.
- a processor is coupled to the at least one imaging device, and the processor is configured for a variety of tasks including sampling the image of a structured light pattern to obtain an intensity distribution; selecting a number of sets of sampled points from the intensity distribution, where each of the sets includes at least three sampled points; fitting each of the sets of sampled points to respective Gaussian distribution functions; extracting a center for each of the Gaussian distribution functions; filtering the Gaussian distribution functions by using the centers to select a representative distribution function for the intensity distribution; and reconstructing a three dimensional profile of the part, using the representative distribution function.
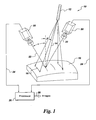
- Fig. 1 illustrates a system 10 for obtaining a three dimensional profile of a part 16 using a structured light pattern 18.
- the system includes a source 12 of structured light 14 positioned at a predetermined distance from a part.
- the source 12 projects a beam of structured light 14 to illuminate the part 16.
- a laser is used as the structured light source 14.
- At least one imaging device 20 is configured to acquire an image 28 of a structured light pattern of the part 16 by viewing along the direction 22.
- the imaging device 20 is positioned such that an angle of view ( ⁇ ) of the imaging device 20 is different from an angle of illumination (p) of the source 12.
- a processor 26 is coupled through 24 to the imaging device 20 and is configured for reconstructing the three dimensional profile of the part using the methods described hereinbelow.
- the intensity profile for a flat surface in the case of illumination with Gaussian profile by source 12 and any viewing angle of the imaging device 20, for any tilt angle ( ⁇ ) of the surface of the part 16, remains a Gaussian distribution.
- ⁇ tilt angle
- the intensity profile is no longer symmetric.
- the curvature of the surface may be approximated by a cylinder to analyze the intensity profiles for a Gaussian distribution. It is found that the degree of asymmetry ⁇ (the maximum distance difference between two points with the same intensity to the maximum intensity point) is small and hence the effect on image due to this asymmetry is small. Therefore the intensity profile near a cylindrical neighborhood in a curved surface can also be assumed to be a Gaussian distribution. In this case, considering that the maximum intensity point is sampled, the image bias after applying zero-crossing is also small, of the order of 10 -2 . This is shown by a set of graphs in Fig.
- V is the viewing vector unit determined by viewing angle ⁇
- N is the surface normal unit determined by surface tilt angle ⁇
- B is the vector unit of the beam center line determined by beam divergent angle ⁇ .
- the degree of asymmetry ⁇ is shown in Fig. 2 for the left and right views for different tilt angles of the curved surface.
- Fig. 3 depicts a number of sampling points 43 at three different locations 44, 46, 48 of an intensity distribution 36.
- Fig. 4 depicts the sampled intensity profiles 50, 52 and 54 for the locations 44, 46 and 48 respectively. These profiles 52 and 54 (as is clear from Fig. 4) are not a true representation of the intensity profile 36 due to the sampling error.
- speckle also leads to enhanced image bias error, as it causes the intensity profile to change as shown in Fig 5. Therefore, if there is speckle noise, the intensity profile 36 of Fig. 4 will appear as the sampled intensity profile 58 with sampling error and added speckle noise at 56.
- Fig. 6 illustrates one aspect of an image processing method for structured light profiling for use in the system 10 of Fig.1.
- the method includes acquiring the image of the structured light pattern of a part.
- the structured light pattern includes at least one laser stripe, and the intensity distribution is an intensity profile across one of the laser stripes.
- the method starts at 60 with an image 28, which is sampled to obtain an intensity distribution of the structured light pattern at step 62.
- a number of sets of sampled points are selected from the intensity distribution, where each of the respective sets includes a number of sampled points.
- each of the sets of sampled points includes at least three sampled points.
- each of the sets of sampled points is fit to a respective distribution function.
- each of the distribution functions is a Gaussian distribution. It is found that fitting the intensity profile for a curved surface with a Gaussian distribution leads to reducing sampling error.
- the distribution functions are filtered to select a representative distribution function with reduced effect of speckle noise for the intensity distribution.
- the method concludes at 69 with an output of the representative distribution function, which is further processed to reconstruct the three dimensional profile of the part.
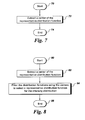
- Fig. 7 illustrates additional aspects of the image processing method.
- the image processing method also includes extracting a center of the representative distribution function, which is shown as step 72 in Fig.7.
- the input 70 to the process illustrated in Fig.7 is the representative distribution function
- the output 74 is the center of the representative distribution function depicting the position of the laser stripe on the complex part.
- the center of the representative distribution function may be extracted, for example, using zero-crossing.
- the exemplary fitting method fits sets of three sampled points to respective distribution functions, in order to calculate the center of the representative distribution function, as mentioned above. As would be appreciated by one skilled in the art, more than three sampled points can be used as well.
- Fig. 8 illustrates another embodiment of the image processing method.
- a center is extracted for each of the distribution functions as shown in step 82 of Fig.8.
- the centers may be extracted using zero-crossing.
- the input 80 to this process will be the distribution functions, which are generated at step 66 in Fig. 6.
- the filtering step includes using these centers in the subsequent step 84.
- multiple centers may be calculated using different sets of three points from the intensity profile. If the multiple centers are close, the average or median can be used as a fitted center of the Gaussian distribution.
- the filtering step includes selecting a median of the centers, and the representative distribution function corresponds to the median of the centers.
- a histogram may be used to determine the median.
- the centers may be sorted to determine the median.
- these filtering techniques select the representative center for the distribution functions that depicts the position of laser stripe center on the complex part.
- step 84 of filtering includes rejecting a number of distribution functions that involve outliers.
- a filtering example is discussed with reference to Fig. 5. As shown in Fig. 5, there is an added speckle at sampling point 4 (total 9 points) and the calculated seven centers are , 0, -6.06, 0.16, -0.32,0,0,0. For this filtering example, a closest group amongst the calculated centers is selected and zero is selected.
- the statistical analysis methods can further use histograms to screen speckle noise using the median value. Beneficially, this fitting requires only three sampled points at a time to calculate multiple values for the centers which can be used for filtering without compromising computation speed.
- each block/component represents a module, segment, or portion of code, which comprises one or more executable instructions for implementing the specified logical functions.
- the functions noted in the blocks may occur out of the order noted in the figures or, for example, may in fact be executed substantially concurrently or in the reverse order, depending upon the functionality involved. Also, one of ordinary skill in the art will recognize that additional blocks may be added.
- the functions can be implemented in programming languages such as C++ or JAVA; however, other languages can be used.
- the various embodiments and aspects of the invention described above comprise an ordered listing of executable instructions for implementing logical functions.
- the ordered listing can be embodied in any computer-readable medium for use by or in connection with a computer-based system that can retrieve the instructions and execute them.
- the computer-readable medium can be any means that can contain, store, communicate, propagate, transmit or transport the instructions.
- the computer readable medium can be an electronic, a magnetic, an optical, an electromagnetic, or an infrared system, apparatus, or device.
- An illustrative, but non-exhaustive list of computer-readable mediums can include an electrical connection (electronic) having one or more wires, a portable computer diskette (magnetic), a random access memory (RAM) (magnetic), a read-only memory (ROM) (magnetic), an erasable programmable read-only memory (EPROM or Flash memory) (magnetic), an optical fiber (optical), and a portable compact disc read-only memory (CDROM) (optical).
- an electrical connection electronic having one or more wires
- a portable computer diskette magnetic
- RAM random access memory
- ROM read-only memory
- EPROM or Flash memory erasable programmable read-only memory
- CDROM portable compact disc read-only memory
- the computer readable medium may comprise paper or another suitable medium upon which the instructions are printed.
- the instructions can be electronically captured via optical scanning of the paper or other medium, then compiled, interpreted or otherwise processed in a suitable manner if necessary, and then stored in a computer memory.
- the various aspects of the technique described hereinabove have utility in industrial as well as medical environments.
- the methods can be used for non-contact measurement of complex parts e.g. aircraft parts for inspection, in the extrusion process in the steel industry and other high temperature manufacturing environments where contact measurement of a part is difficult. These methods are also useful in medical fields for surgery planning, where these may be used for profiling the different parts of a human body to have precision in surgery.
Abstract
Description
- The present invention relates generally to structured light profiling of a part and more specifically to methods and systems for image processing to obtain a three dimensional profile of a part using a structured light source.
- In structured light applications, a three dimensional profile of a part is obtained by using a laser source and at least one video camera. A laser source emanates a laser beam and spreads into multiple (one or more) laser stripes which strikes a surface of a part. These stripes are viewed from one or more video cameras from an angle other than the illumination angle. Typically, applications for structured light profiling include obtaining shape profile information about the part or generating a 3D contour map of the part.
- The limitations of using laser stripes to obtain accurate profile information are mainly attributed to sampling error and the noise associated with the laser because the center of a laser stripe may not be imaged at the center of the pixel of the camera and may not be the detected intensity peak. Sampling error occurs while locating the center of the laser stripe on the image. There are image processing techniques such as maximum intensity, intensity center, Gaussian fitting and zero-crossing which attempt to extract the relevant information from the laser stripe. The associated problem with several of these techniques is that it gives the location of the highest peak, which is not the true center of the stripe. Current correction techniques for this error include neighborhood averaging over neighboring pixels and doing a weighted average or using fitting methods, but these techniques also fail to adequately address the sampling error.
- The noise associated with the laser primarily takes the form of laser speckle, which is the oscillation of the intensity profile for a laser when it is reflected from the surface of the part and is caused by coherency of the laser. One way to reduce the speckle noise is by choosing an appropriate viewing system. By changing the size of the aperture, the size of the speckle changes, the larger the aperture, the smaller the size of the speckle. However, in this case there's a depth of field tradeoff.
- Therefore there is need for an improved image processing technique for reducing the speckle noise and also the sampling error in structured light applications.
- Briefly, in accordance with one aspect of the present invention, an image processing method for structured light profiling includes sampling an image of a structured light pattern to obtain an intensity distribution. A number of sets of sampled points are then selected from the intensity distribution, where each of the respective sets includes a number of sampled points. Each of the sets of sampled points is then fitted to a respective distribution function. Finally, the distribution functions are filtered to select a representative distribution function for the intensity distribution.
- In accordance with another aspect of the present invention, a system for obtaining a three dimensional profile of a part using a structured light pattern includes a source of structured light positioned at a predetermined distance from a part, where the source projects a beam of structured light to illuminate the part. The system also includes at least one imaging device configured to acquire an image of a structured light pattern of the part, where the at least one imaging device is positioned such that an angle of view of the imaging device is different from an angle of illumination of the source. A processor is coupled to the at least one imaging device, and the processor is configured for a variety of tasks including sampling the image of a structured light pattern to obtain an intensity distribution; selecting a number of sets of sampled points from the intensity distribution, where each of the sets includes at least three sampled points; fitting each of the sets of sampled points to respective Gaussian distribution functions; extracting a center for each of the Gaussian distribution functions; filtering the Gaussian distribution functions by using the centers to select a representative distribution function for the intensity distribution; and reconstructing a three dimensional profile of the part, using the representative distribution function.
- These and other features, aspects, and advantages of the present invention will become better understood when the following detailed description is read with reference to the accompanying drawings in which like characters represent like parts throughout the drawings, wherein:
- Fig. 1 illustrates a system for obtaining a three dimensional profile of a part using a structured light source;
- Fig. 2 illustrates a set of graphs for three different orientations of a curved surface being viewed by two cameras;
- Fig. 3 is a graphical representation of a number of sampling points at three different locations of an intensity distribution;
- Fig. 4 is a graphical representation of sampled intensity profiles for the three locations illustrated in Fig. 3;
- Fig. 5 is a graphical representation of a sampled intensity profile with speckle noise and sampling error;
- Fig. 6 is a flowchart that illustrates one aspect of an image processing method for structured light profiling for use in the system of Fig.1;
- Fig. 7 illustrates a flowchart for determining the position of laser stripe by using a center of the representative distribution function according to an aspect of the image processing technique; and
- Fig. 8 illustrates a flowchart for determining the position of laser stripe by using centers of distribution functions according to an aspect of the image processing method.
-
- Fig. 1 illustrates a
system 10 for obtaining a three dimensional profile of apart 16 using a structuredlight pattern 18. The system includes asource 12 of structuredlight 14 positioned at a predetermined distance from a part. Thesource 12 projects a beam of structuredlight 14 to illuminate thepart 16. In the illustrated embodiment, a laser is used as thestructured light source 14. However other mediums like white light may also be used. At least oneimaging device 20 is configured to acquire animage 28 of a structured light pattern of thepart 16 by viewing along thedirection 22. Theimaging device 20 is positioned such that an angle of view (α) of theimaging device 20 is different from an angle of illumination (p) of thesource 12. Aprocessor 26 is coupled through 24 to theimaging device 20 and is configured for reconstructing the three dimensional profile of the part using the methods described hereinbelow. - As would be appreciated by those skilled in the art, the intensity profile for a flat surface in the case of illumination with Gaussian profile by
source 12 and any viewing angle of theimaging device 20, for any tilt angle () of the surface of thepart 16, remains a Gaussian distribution. For such a symmetric intensity profile on a flat surface, it will be well appreciated by those skilled in the art that sampling of the symmetric point and applying zero-crossing which is a second derivative on the profile, will yield the center corresponding to the maximum intensity. - However, in the case of a complex part, where the surface is not flat, the intensity profile is no longer symmetric. In case of a curved surface, the curvature of the surface may be approximated by a cylinder to analyze the intensity profiles for a Gaussian distribution. It is found that the degree of asymmetry δ (the maximum distance difference between two points with the same intensity to the maximum intensity point) is small and hence the effect on image due to this asymmetry is small. Therefore the intensity profile near a cylindrical neighborhood in a curved surface can also be assumed to be a Gaussian distribution. In this case, considering that the maximum intensity point is sampled, the image bias after applying zero-crossing is also small, of the order of 10-2. This is shown by a set of graphs in Fig. 2, for three different orientations of a curved surface at angles -40 degrees, 0 degrees and 40 degrees being viewed by two cameras, with the views being depicted as a left view and a right view respectively. Also in Fig. 2,
V is the viewing vector unit determined by viewing angle α,N is the surface normal unit determined by surface tilt angle andB is the vector unit of the beam center line determined by beam divergent angle β. The degree of asymmetry δ is shown in Fig. 2 for the left and right views for different tilt angles of the curved surface. - However, if the maximum intensity point is not sampled, i.e. there is sampling error, zero-crossing does not give accurate results and leads to a larger image bias as shown by the set of graphical representations in Fig. 3 and Fig. 4. Fig. 3 depicts a number of
sampling points 43 at threedifferent locations intensity distribution 36. Fig. 4 depicts the sampledintensity profiles locations profiles 52 and 54 (as is clear from Fig. 4) are not a true representation of theintensity profile 36 due to the sampling error. Further, speckle also leads to enhanced image bias error, as it causes the intensity profile to change as shown in Fig 5. Therefore, if there is speckle noise, theintensity profile 36 of Fig. 4 will appear as the sampledintensity profile 58 with sampling error and added speckle noise at 56. - In order to reduce sampling error and speckle noise, an imaging processing method is provided. Fig. 6 illustrates one aspect of an image processing method for structured light profiling for use in the
system 10 of Fig.1. The method includes acquiring the image of the structured light pattern of a part. The structured light pattern includes at least one laser stripe, and the intensity distribution is an intensity profile across one of the laser stripes. Referring to the flowchart of Fig. 6, the method starts at 60 with animage 28, which is sampled to obtain an intensity distribution of the structured light pattern atstep 62. Next, atstep 64, a number of sets of sampled points are selected from the intensity distribution, where each of the respective sets includes a number of sampled points. In one example each of the sets of sampled points includes at least three sampled points. InStep 66 each of the sets of sampled points is fit to a respective distribution function. In one example each of the distribution functions is a Gaussian distribution. It is found that fitting the intensity profile for a curved surface with a Gaussian distribution leads to reducing sampling error. InStep 68 the distribution functions are filtered to select a representative distribution function with reduced effect of speckle noise for the intensity distribution. The method concludes at 69 with an output of the representative distribution function, which is further processed to reconstruct the three dimensional profile of the part. - Fig. 7 illustrates additional aspects of the image processing method. For this embodiment, the image processing method also includes extracting a center of the representative distribution function, which is shown as
step 72 in Fig.7. Theinput 70 to the process illustrated in Fig.7 is the representative distribution function, and theoutput 74 is the center of the representative distribution function depicting the position of the laser stripe on the complex part. The center of the representative distribution function may be extracted, for example, using zero-crossing. The exemplary fitting method, according to an aspect of the present technique, fits sets of three sampled points to respective distribution functions, in order to calculate the center of the representative distribution function, as mentioned above. As would be appreciated by one skilled in the art, more than three sampled points can be used as well. - Fig. 8 illustrates another embodiment of the image processing method. For this embodiment, a center is extracted for each of the distribution functions as shown in
step 82 of Fig.8. The centers may be extracted using zero-crossing. Theinput 80 to this process will be the distribution functions, which are generated atstep 66 in Fig. 6. The filtering step includes using these centers in thesubsequent step 84. For example, multiple centers may be calculated using different sets of three points from the intensity profile. If the multiple centers are close, the average or median can be used as a fitted center of the Gaussian distribution. Namely, for this example, the filtering step includes selecting a median of the centers, and the representative distribution function corresponds to the median of the centers. A histogram may be used to determine the median. Alternatively, the centers may be sorted to determine the median. As will be appreciated by one skilled in the art, these filtering techniques select the representative center for the distribution functions that depicts the position of laser stripe center on the complex part. - In case there is a speckle which can be observed as an outlier on the intensity profile, the corresponding center using the outlier can be easily discarded and the speckle noise can be addressed. This is indicated in Fig. 8, in which step 84 of filtering includes rejecting a number of distribution functions that involve outliers. A filtering example is discussed with reference to Fig. 5. As shown in Fig. 5, there is an added speckle at sampling point 4 (total 9 points) and the calculated seven centers are , 0, -6.06, 0.16, -0.32,0,0,0. For this filtering example, a closest group amongst the calculated centers is selected and zero is selected. The statistical analysis methods can further use histograms to screen speckle noise using the median value. Beneficially, this fitting requires only three sampled points at a time to calculate multiple values for the centers which can be used for filtering without compromising computation speed.
- As noted above, the flowcharts illustrated in Fig. 6, Fig. 7, and Fig. 8 describe the aspects of the method discussed hereinabove. The foregoing flow charts also show the functionality and operation of the method and the system for reconstructing a three dimensional profile of a part. In this regard, each block/component represents a module, segment, or portion of code, which comprises one or more executable instructions for implementing the specified logical functions. It should also be noted that in some alternative implementations, the functions noted in the blocks may occur out of the order noted in the figures or, for example, may in fact be executed substantially concurrently or in the reverse order, depending upon the functionality involved. Also, one of ordinary skill in the art will recognize that additional blocks may be added. Furthermore, the functions can be implemented in programming languages such as C++ or JAVA; however, other languages can be used.
- The various embodiments and aspects of the invention described above comprise an ordered listing of executable instructions for implementing logical functions. The ordered listing can be embodied in any computer-readable medium for use by or in connection with a computer-based system that can retrieve the instructions and execute them. In the context of this application, the computer-readable medium can be any means that can contain, store, communicate, propagate, transmit or transport the instructions. The computer readable medium can be an electronic, a magnetic, an optical, an electromagnetic, or an infrared system, apparatus, or device. An illustrative, but non-exhaustive list of computer-readable mediums can include an electrical connection (electronic) having one or more wires, a portable computer diskette (magnetic), a random access memory (RAM) (magnetic), a read-only memory (ROM) (magnetic), an erasable programmable read-only memory (EPROM or Flash memory) (magnetic), an optical fiber (optical), and a portable compact disc read-only memory (CDROM) (optical).
- Note that the computer readable medium may comprise paper or another suitable medium upon which the instructions are printed. For instance, the instructions can be electronically captured via optical scanning of the paper or other medium, then compiled, interpreted or otherwise processed in a suitable manner if necessary, and then stored in a computer memory.
- The various aspects of the technique described hereinabove have utility in industrial as well as medical environments. The methods can be used for non-contact measurement of complex parts e.g. aircraft parts for inspection, in the extrusion process in the steel industry and other high temperature manufacturing environments where contact measurement of a part is difficult. These methods are also useful in medical fields for surgery planning, where these may be used for profiling the different parts of a human body to have precision in surgery.
- For the completeness, various aspects of the invention are set out in the following numbered clauses:
- 1. An image processing method for structured light profiling, said method
comprising:
- sampling an image (28) of a structured light pattern (18) to obtain an intensity distribution (36);
- selecting a plurality of sets of sampled points (43) from the intensity distribution, wherein each of the respective sets comprises a plurality of sampled points;
- fitting each of the sets of sampled points to a respective distribution function; and
- filtering the distribution functions to select a representative distribution function for the intensity distribution.
- 2. The image processing method of
Clause 1, further comprising extracting a center of the representative distribution function. - 3. The image processing method of
Clause 2, wherein said extracting the center comprises using zero-crossing. - 4. The image processing method of
Clause 1, wherein each of the sets of sampled points comprises at least three sampled points. - 5. The image processing method of
Clause 1, wherein each of the distribution functions comprises a Gaussian distribution. - 6. The image processing method of
Clause 1, further comprising extracting a respective center for each of the distribution functions, wherein said filtering includes using the centers. - 7. The image processing method of Clause 6, wherein said extracting comprises using zero-crossing.
- 8. The image processing method of Clause 6, wherein said filtering includes rejecting a plurality of outliers.
- 9. The image processing method of Clause 6, wherein said filtering includes selecting a median of the centers, wherein the representative distribution function corresonds to the median.
- 10. The image processing method of Clause 9, wherein said filtering further includes using a histogram to determine the median.
- 11. The image processing method of Clause 9, wherein said filtering further includes sorting the centers to determine the median.
- 12. The image processing method of
Clause 1, wherein said structured light pattern comprises at least one laser stripe, and wherein said intensity distribution is an intensity profile across one of the laser stripes. - 13. The image processing method of
Clause 1, further comprising acquiring the image of the structured light pattern of a part (16). - 14. The image processing method of Clause 13, further comprising reconstructing a three dimensional profile of the part, using the representative distribution function.
-
Claims (10)
- An image processing method for structured light profiling, said method comprising:sampling an image (28) of a structured light pattern (18) to obtain an intensity distribution (36);selecting a plurality of sets of sampled points (43) from the intensity distribution, wherein each of the respective sets comprises a plurality of sampled points;fitting each of the sets of sampled points to a respective distribution function; andfiltering the distribution functions to select a representative distribution function for the intensity distribution.
- The image processing method of Claim 1, further comprising extracting a center of the representative distribution function.
- The image processing method of Claim 2, wherein said extracting the center comprises using zero-crossing.
- The image processing method of Claim 1, wherein each of the sets of sampled points comprises at least three sampled points.
- The image processing method of Claim 1, wherein each of the distribution functions comprises a Gaussian distribution.
- The image processing method of Claim 1, further comprising extracting a respective center for each of the distribution functions, wherein said filtering includes using the centers.
- The image processing method of Claim 6, wherein said filtering includes selecting a median of the centers, wherein the representative distribution function corresonds to the median.
- The image processing method of Claim 1, wherein said structured light pattern comprises at least one laser stripe, and wherein said intensity distribution is an intensity profile across one of the laser stripes.
- The image processing method of Claim 1, further comprising acquiring the image of the structured light pattern of a part (16).
- The image processing method of Claim 9, further comprising reconstructing a three dimensional profile of the part, using the representative distribution function.
Applications Claiming Priority (2)
| Application Number | Priority Date | Filing Date | Title |
|---|---|---|---|
| US652366 | 2003-08-28 | ||
| US10/652,366 US7302109B2 (en) | 2003-08-28 | 2003-08-28 | Method and system for image processing for structured light profiling of a part |
Publications (3)
| Publication Number | Publication Date |
|---|---|
| EP1519142A2 true EP1519142A2 (en) | 2005-03-30 |
| EP1519142A3 EP1519142A3 (en) | 2006-09-20 |
| EP1519142B1 EP1519142B1 (en) | 2007-11-07 |
Family
ID=34194674
Family Applications (1)
| Application Number | Title | Priority Date | Filing Date |
|---|---|---|---|
| EP04255149A Expired - Fee Related EP1519142B1 (en) | 2003-08-28 | 2004-08-26 | Method for image processing for profiling with structured light |
Country Status (4)
| Country | Link |
|---|---|
| US (1) | US7302109B2 (en) |
| EP (1) | EP1519142B1 (en) |
| JP (1) | JP4792214B2 (en) |
| DE (1) | DE602004009875T2 (en) |
Families Citing this family (17)
| Publication number | Priority date | Publication date | Assignee | Title |
|---|---|---|---|---|
| US7916898B2 (en) * | 2003-09-15 | 2011-03-29 | Deere & Company | Method and system for identifying an edge of a crop |
| US7336374B2 (en) * | 2005-10-24 | 2008-02-26 | General Electric Company | Methods and apparatus for generating a mask |
| JP4812568B2 (en) * | 2006-09-07 | 2011-11-09 | 株式会社ミツトヨ | Optical measurement apparatus, optical measurement method, and optical measurement processing program |
| US7821649B2 (en) | 2008-03-05 | 2010-10-26 | Ge Inspection Technologies, Lp | Fringe projection system and method for a probe suitable for phase-shift analysis |
| US7969583B2 (en) * | 2008-03-05 | 2011-06-28 | General Electric Company | System and method to determine an object distance from a reference point to a point on the object surface |
| US7812968B2 (en) * | 2008-03-05 | 2010-10-12 | Ge Inspection Technologies, Lp | Fringe projection system and method for a probe using a coherent fiber bundle |
| US8422030B2 (en) * | 2008-03-05 | 2013-04-16 | General Electric Company | Fringe projection system with intensity modulating by columns of a plurality of grating elements |
| US8107083B2 (en) * | 2008-03-05 | 2012-01-31 | General Electric Company | System aspects for a probe system that utilizes structured-light |
| US8723923B2 (en) * | 2010-01-14 | 2014-05-13 | Alces Technology | Structured light system |
| WO2011088249A2 (en) * | 2010-01-14 | 2011-07-21 | Alces Technology, Inc. | Compact display system |
| CN102175182B (en) * | 2011-01-27 | 2012-10-10 | 浙江大学宁波理工学院 | Structured light three-dimensional measurement device and complete point cloud data acquisition method thereof |
| US8755627B2 (en) * | 2011-04-14 | 2014-06-17 | Lexmark International, Inc. | Method and system for reducing speckles in a captured image |
| ITBO20130407A1 (en) * | 2013-07-26 | 2015-01-27 | Swisslog Italia Spa | DEVICE AND PROCEDURE FOR SINGULARIZING PRODUCTS GROUPED IN BLISTER |
| US9389069B2 (en) | 2014-03-26 | 2016-07-12 | Alces Technology, Inc. | Compact 3D depth capture systems |
| US10018113B2 (en) * | 2015-11-11 | 2018-07-10 | General Electric Company | Ultrasonic cleaning system and method |
| CN106091985B (en) * | 2016-06-07 | 2018-12-04 | 西安交通大学 | A kind of three-dimensional acquisition device and 3 D scanning system |
| CN106767707B (en) * | 2016-12-16 | 2019-06-04 | 中南大学 | A kind of storage status detection method and system based on structure light |
Citations (2)
| Publication number | Priority date | Publication date | Assignee | Title |
|---|---|---|---|---|
| US5852672A (en) * | 1995-07-10 | 1998-12-22 | The Regents Of The University Of California | Image system for three dimensional, 360 DEGREE, time sequence surface mapping of moving objects |
| US5999840A (en) * | 1994-09-01 | 1999-12-07 | Massachusetts Institute Of Technology | System and method of registration of three-dimensional data sets |
Family Cites Families (16)
| Publication number | Priority date | Publication date | Assignee | Title |
|---|---|---|---|---|
| US4875777A (en) | 1987-09-30 | 1989-10-24 | Industrial Technology Institute | Off-axis high accuracy structured light profiler |
| JPH06105166B2 (en) * | 1988-02-22 | 1994-12-21 | 浜松ホトニクス株式会社 | Beam center position detector |
| JPH04287290A (en) * | 1990-11-20 | 1992-10-12 | Imra America Inc | Hough transformation picture processor |
| US5606390A (en) * | 1991-09-27 | 1997-02-25 | Canon Kabushiki Kaisha | Visual-line detecting device and optical apparatus having the same |
| US6005984A (en) * | 1991-12-11 | 1999-12-21 | Fujitsu Limited | Process and apparatus for extracting and recognizing figure elements using division into receptive fields, polar transformation, application of one-dimensional filter, and correlation between plurality of images |
| US6850252B1 (en) * | 1999-10-05 | 2005-02-01 | Steven M. Hoffberg | Intelligent electronic appliance system and method |
| JPH0674724A (en) * | 1992-08-28 | 1994-03-18 | Koyo Seiko Co Ltd | Center of gravity calculating method for optical cutting line in three-dimensional shape measurement |
| JP2715895B2 (en) * | 1994-01-31 | 1998-02-18 | 日本電気株式会社 | Light intensity distribution simulation method |
| US5528339A (en) * | 1994-08-26 | 1996-06-18 | Eastman Kodak Company | Color image reproduction of scenes with color enhancement and preferential tone mapping |
| JP3327068B2 (en) * | 1995-10-05 | 2002-09-24 | 松下電器産業株式会社 | Road surface measurement device |
| US6249315B1 (en) * | 1997-03-24 | 2001-06-19 | Jack M. Holm | Strategy for pictorial digital image processing |
| ATE220465T1 (en) * | 1997-10-29 | 2002-07-15 | Calum E Macaulay | APPARATUS AND METHOD FOR MICROSCOPY USING SPACIALLY MODULATED LIGHT |
| US6782137B1 (en) * | 1999-11-24 | 2004-08-24 | General Electric Company | Digital image display improvement system and method |
| US6639597B1 (en) * | 2000-02-28 | 2003-10-28 | Mitsubishi Electric Research Laboratories Inc | Visibility splatting and image reconstruction for surface elements |
| US6633683B1 (en) * | 2000-06-26 | 2003-10-14 | Miranda Technologies Inc. | Apparatus and method for adaptively reducing noise in a noisy input image signal |
| JP2002071325A (en) * | 2000-09-01 | 2002-03-08 | Kobe Steel Ltd | Method and apparatus for measuring object shape |
-
2003
- 2003-08-28 US US10/652,366 patent/US7302109B2/en not_active Expired - Fee Related
-
2004
- 2004-08-26 DE DE602004009875T patent/DE602004009875T2/en active Active
- 2004-08-26 EP EP04255149A patent/EP1519142B1/en not_active Expired - Fee Related
- 2004-08-27 JP JP2004247900A patent/JP4792214B2/en not_active Expired - Fee Related
Patent Citations (2)
| Publication number | Priority date | Publication date | Assignee | Title |
|---|---|---|---|---|
| US5999840A (en) * | 1994-09-01 | 1999-12-07 | Massachusetts Institute Of Technology | System and method of registration of three-dimensional data sets |
| US5852672A (en) * | 1995-07-10 | 1998-12-22 | The Regents Of The University Of California | Image system for three dimensional, 360 DEGREE, time sequence surface mapping of moving objects |
Also Published As
| Publication number | Publication date |
|---|---|
| EP1519142A3 (en) | 2006-09-20 |
| DE602004009875D1 (en) | 2007-12-20 |
| JP2005077411A (en) | 2005-03-24 |
| DE602004009875T2 (en) | 2008-08-28 |
| EP1519142B1 (en) | 2007-11-07 |
| JP4792214B2 (en) | 2011-10-12 |
| US7302109B2 (en) | 2007-11-27 |
| US20050046872A1 (en) | 2005-03-03 |
Similar Documents
| Publication | Publication Date | Title |
|---|---|---|
| EP1519142B1 (en) | Method for image processing for profiling with structured light | |
| Nayar et al. | Shape from focus: An effective approach for rough surfaces | |
| US6868194B2 (en) | Method for the extraction of image features caused by structure light using image reconstruction | |
| CN111968144B (en) | Image edge point acquisition method and device | |
| US6873422B2 (en) | Systems and methods for high-accuracy displacement determination in a correlation based position transducer | |
| US20200258300A1 (en) | Method and apparatus for generating a 3d reconstruction of an object | |
| CN114240845B (en) | Light cutting method surface roughness measurement method applied to cutting workpiece | |
| JP2009259036A (en) | Image processing device, image processing method, image processing program, recording medium, and image processing system | |
| US6219063B1 (en) | 3D rendering | |
| Le et al. | Reconstruction of accurate 3-D surfaces with sharp edges using digital structured light projection and multi-dimensional image fusion | |
| JP3236362B2 (en) | Skin surface shape feature extraction device based on reconstruction of three-dimensional shape from skin surface image | |
| US7136171B2 (en) | Method for the extraction of image features caused by structure light using template information | |
| CN116615302A (en) | Method for detecting the suspension position of a support bar and flat machine tool | |
| Lee et al. | Machine vision system for curved surface inspection | |
| US6512844B2 (en) | 3D rendering | |
| US6845178B1 (en) | Automatic separation of subject pixels using segmentation based on multiple planes of measurement data | |
| CN113538483B (en) | Coding and decoding method and measuring method of high-precision close-range photogrammetry mark | |
| Hinz et al. | Adaptive merging of large datasets of a 3D measuring endoscope in an industrial environment | |
| Senthilnathan et al. | Estimation of sparse depth based on an inspiration from SFF | |
| CN113793293A (en) | Contour detection method, apparatus, system and computer readable storage medium | |
| Abdullah et al. | Measuring fish length from digital images (FiLeDI) | |
| Stache et al. | Robust circle fitting in industrial vision for process control of laser welding | |
| CN110660073B (en) | Straight line edge recognition equipment | |
| CN108759720B (en) | Smooth surface profile measuring method | |
| Zhang et al. | Center extraction for non-uniform line structured light stripe with wide view field |
Legal Events
| Date | Code | Title | Description |
|---|---|---|---|
| PUAI | Public reference made under article 153(3) epc to a published international application that has entered the european phase |
Free format text: ORIGINAL CODE: 0009012 |
|
| AK | Designated contracting states |
Kind code of ref document: A2 Designated state(s): AT BE BG CH CY CZ DE DK EE ES FI FR GB GR HU IE IT LI LU MC NL PL PT RO SE SI SK TR |
|
| AX | Request for extension of the european patent |
Extension state: AL HR LT LV MK |
|
| PUAL | Search report despatched |
Free format text: ORIGINAL CODE: 0009013 |
|
| AK | Designated contracting states |
Kind code of ref document: A3 Designated state(s): AT BE BG CH CY CZ DE DK EE ES FI FR GB GR HU IE IT LI LU MC NL PL PT RO SE SI SK TR |
|
| AX | Request for extension of the european patent |
Extension state: AL HR LT LV MK |
|
| GRAP | Despatch of communication of intention to grant a patent |
Free format text: ORIGINAL CODE: EPIDOSNIGR1 |
|
| 17P | Request for examination filed |
Effective date: 20070320 |
|
| AKX | Designation fees paid |
Designated state(s): DE FR GB |
|
| RTI1 | Title (correction) |
Free format text: METHOD FOR IMAGE PROCESSING FOR PROFILING WITH STRUCTURED LIGHT |
|
| GRAS | Grant fee paid |
Free format text: ORIGINAL CODE: EPIDOSNIGR3 |
|
| GRAA | (expected) grant |
Free format text: ORIGINAL CODE: 0009210 |
|
| AK | Designated contracting states |
Kind code of ref document: B1 Designated state(s): DE FR GB |
|
| REG | Reference to a national code |
Ref country code: GB Ref legal event code: FG4D |
|
| RIN2 | Information on inventor provided after grant (corrected) |
Inventor name: HU, QINGYING Inventor name: ROSS, JOSEPH BENJAMIN Inventor name: HARDING, KEVIN GEORGE Inventor name: LORRAINE, PETER WILLIAM |
|
| REF | Corresponds to: |
Ref document number: 602004009875 Country of ref document: DE Date of ref document: 20071220 Kind code of ref document: P |
|
| ET | Fr: translation filed | ||
| PLBE | No opposition filed within time limit |
Free format text: ORIGINAL CODE: 0009261 |
|
| STAA | Information on the status of an ep patent application or granted ep patent |
Free format text: STATUS: NO OPPOSITION FILED WITHIN TIME LIMIT |
|
| 26N | No opposition filed |
Effective date: 20080808 |
|
| PGFP | Annual fee paid to national office [announced via postgrant information from national office to epo] |
Ref country code: DE Payment date: 20140827 Year of fee payment: 11 |
|
| PGFP | Annual fee paid to national office [announced via postgrant information from national office to epo] |
Ref country code: FR Payment date: 20140818 Year of fee payment: 11 Ref country code: GB Payment date: 20140827 Year of fee payment: 11 |
|
| REG | Reference to a national code |
Ref country code: DE Ref legal event code: R119 Ref document number: 602004009875 Country of ref document: DE |
|
| GBPC | Gb: european patent ceased through non-payment of renewal fee |
Effective date: 20150826 |
|
| REG | Reference to a national code |
Ref country code: FR Ref legal event code: ST Effective date: 20160429 |
|
| PG25 | Lapsed in a contracting state [announced via postgrant information from national office to epo] |
Ref country code: GB Free format text: LAPSE BECAUSE OF NON-PAYMENT OF DUE FEES Effective date: 20150826 Ref country code: DE Free format text: LAPSE BECAUSE OF NON-PAYMENT OF DUE FEES Effective date: 20160301 |
|
| PG25 | Lapsed in a contracting state [announced via postgrant information from national office to epo] |
Ref country code: FR Free format text: LAPSE BECAUSE OF NON-PAYMENT OF DUE FEES Effective date: 20150831 |