EP1510940A1 - A method of providing a visualisation graph on a computer and a computer for providing a visualisation graph - Google Patents
A method of providing a visualisation graph on a computer and a computer for providing a visualisation graph Download PDFInfo
- Publication number
- EP1510940A1 EP1510940A1 EP03078585A EP03078585A EP1510940A1 EP 1510940 A1 EP1510940 A1 EP 1510940A1 EP 03078585 A EP03078585 A EP 03078585A EP 03078585 A EP03078585 A EP 03078585A EP 1510940 A1 EP1510940 A1 EP 1510940A1
- Authority
- EP
- European Patent Office
- Prior art keywords
- entities
- graph
- entity
- code
- sectors
- Prior art date
- Legal status (The legal status is an assumption and is not a legal conclusion. Google has not performed a legal analysis and makes no representation as to the accuracy of the status listed.)
- Pending
Links
Images


Classifications
-
- G—PHYSICS
- G06—COMPUTING; CALCULATING OR COUNTING
- G06F—ELECTRIC DIGITAL DATA PROCESSING
- G06F16/00—Information retrieval; Database structures therefor; File system structures therefor
- G06F16/90—Details of database functions independent of the retrieved data types
- G06F16/903—Querying
- G06F16/9038—Presentation of query results
Definitions
- the invention relates to a method of providing a visualisation graph on a computer and a computer for providing a visualisation graph.
- Visualisation graphs are tools which allow data to be handled and displayed on a display device according to certain criteria.
- the primary objective of navigation graphs is to display systems of complex interrelationships between entities, e.g. in a database or the world wide web.
- Visualisation graphs can be based on a semantic net including all entity types occurring, where the considered entities are linked to each other by various kinds of relations.
- a visualization graph represents entities as boxes, often referred to as "nodes" of the graph, and relations as lines between the boxes.
- a common way of solving the problem of graphical layout is applying a physical simulation where all entities are treated as masses repulsing each other and the relations are treated as elastic lines trying to pull connected entities together.
- a method of providing a visualisation graph on a computer comprising the steps of:
- a computer for providing a visualisation graph comprising:
- a user terminal comprising means operable to perform any one of the methods of the first aspect of the present invention.
- a program storage device readable by a processing apparatus, said device embodying a program of instructions executable by the processor to perform the steps of any one of the methods of the first aspect of the present invention.
- Figures 1 and 2 show examples of embodiments of the present invention.
- Figure 1 shows the position of attractors for top-level entity types, also referred to as “types” and
- Figure 2 shows the approximate position of attractors for second-level entity types, also referred to as "sub-types”.
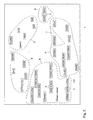
- Figure 1 shows details of a visualisation graph 1 wherein a plurality of entities 2 are displayed. Associated with each entity is an attractor 3. The attractors do not appear on the graph to a user, but are schematically depicted as dotted circles 3 .
- the entities 2 are typically modelled as a mass. There is a repulsive force exerted by a repulsor between each pair of entities.
- the repulsive force may be inversely proportional to the distance or the square of the distance, or any other inverse relationship.
- the relations between entities (not shown in Figure 1) are modelled as springs, typically linear springs. The model provides damping to ensure that the system converges.
- the system is modelled to adopt the lowest energy level.
- the distance and repulsive force is calculated from other entities and nodes. The forces are added to obtain a force vector.
- the reaction of the system in terms of acceleration and deceleration is dependent on the force vector.
- certain types (or kinds) of entities 2 are arranged to appear in the same sector 4 of the graph 1.
- a first embodiment is based on a non-deterministic approach, using attractors and repulsors.
- a second embodiment is based on a deterministic approach using a dynamic, but deterministic, subdivision of the screen and screen areas into sectors and sub-sectors, wherein entity types are allocated to sectors and entity sub-types are allocated to sub-sectors, respectively.
- the angle theta 1- theta 4 of each attractor 3 with respect to a reference may be set by customizing and is inherited by all subtypes (refer to Figure 2 which depicts subtypes 6, wherein subtypes are entities 2 which have a type falling within the scope of a top-level type.
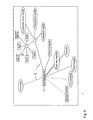
- Figure 2 depicts subtypes 6, wherein subtypes are entities 2 which have a type falling within the scope of a top-level type.
- "strategic business planning" is a sub-type of "activity”. It is seen in Figures 1 and 2 that within each sector 4, 7 the entities to be placed are arranged in Figure 1 in an ellipse, whereas in Figure 2, because there are more entities to be arranged, and thus force vectors are more complex, in each sector 4, the sub-type entities, rather than being arranged in an ellipse are arranged in a more nebulous arrangement.
- Figure 2 shows the approximate location of the attractors 3 as dotted lines. It will be understood that the negotiation of sector size determined in accordance with the number of entities and how they are to be distributed causes the graph to have a particular fuzziness. As mentioned, this is achieved by the provision of the attractors 3. In contrast, in conventional graphs, there is no flexibility in the system to expand or contract a sector beyond or within its boundary, respectively, should the need arise when entities are either added or taken away from the sector.
- the principle of the present invention may also be used to arrange nodes (refer to Figure 2) in a navigation graph without the use of repulsors and/or attractors.
- the display which is typically a computer screen, is divided into sectors 4 assigned to the respective top-level entity types 2.
- the size of each sector depends on the number of entities or nodes it contains, including all visible subtypes 6. For example, if a larger number of entities are to be placed in a particular sector, that sector will become larger.
- the sectors are recursively divided into subtype sectors 7 and again, their relative size depends on the number of entities they contain.
- the segmentation of the screen is repeated each time that entities are added to or removed from the graph 1.
- the distance of the entities or nodes to the center of the graph is an oscillating function of the angle in order to avoid collisions (which in the simulative approach are avoided by the repulsive force between entities). It will be understood that whilst the first and second embodiments may be alternatively implemented, a combination of the first and second embodiments may also be implemented.
- the location on the graph of said allocated entities is adapted in accordance with said additional entity. In this way, the graph becomes dynamic and more versatile.
- the method may include the further step of providing attractors 3 which attract said entities to said predetermined sector in accordance with their entity types. In doing so, a so-called "360° Navigation Graph" is achieved, whereby the location of each entity can be predicted without having to carry out a complete, and thus, very complex deterministic approach. Further, the method may include the further step of providing repulsors to repulse said entities allocated to said predetermined sector 4 from one another. This achieves an optimisation of the distribution of entities 2 within a sector 4.
- the location of an entity 2 on the graph 1 may be determined by the sum of the influence exerted on the entity 2 by the attractor 3 and the repulsors.
- the method may include the steps of: dividing the graph into sectors 4, wherein an entity 2 is allocated to one of the sectors 4 according to its entity type, and dividing the sectors 4 into sub-sectors 7, wherein an entity 2 is allocated to one of the sub-sectors 7 in accordance with its entity sub-type, wherein the size of the sectors 4 and the sub-sectors 7 is determined in accordance with the number of entities of a particular type allocated to the sector 4 and the number of entities of a particular sub-type allocated to the sub-sector 7, respectively.
- the method may include the step of: repeating the dividing steps if the number of entities 2 to be displayed on the graph 1 changes.
- a dynamic deterministic approach is realised, which is adaptive and versatile.
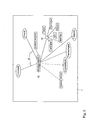
- Figure 3 shows a visualisation graph according to further embodiments of the present invention.
- Figure 3 shows a focus entity 10 with related entities 2 and those comprised in nodes 9, clustered by entity type.
- the dashed lines indicate indirectly related items, "competitors", "market”, selected due to user preferences.
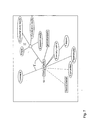
- Figure 4 shows further details of the visualisation graph shown in Figure 3.
- Figure 4 depicts a display of a group's common relations 8 as indicated when a mouse, or other indicator adapted for use with a computer, is passed over the desired node (MouseOver).
- a visualisation graph 1 getting crowded and the data complex to navigate as a result
- groups of entities 9 with common relations 8 are bundled and displayed as group nodes 9 (Fig. 3).
- the method comprises the further step of:
- a selecting step includes abstracting the relations 8 to find the common relation 8. By abstracting the relations 8, characteristics are used to identify common relations 8. In such a way that an even distribution of nodes in the graph is achieved.
- facets are introduced.
- the user may define facets for each entity type. Facets are predefined groups which are characterized by the entity type of their elements or the kind of relation 8 which connects their elements to the focus entity.
- the following facets have been defined for product properties: knowledge, products, technologies, persons, life cycle phases, companies, ideas, insights, facts, concepts, approaches, activities.
- facets are defined, all entities related to the focus entity will be sorted into the corresponding facets (groups) and the dynamic grouping algorithm is used only to subdivide these facets into smaller groups (if possible).
- Figures 5-8 show visualisation graphs according to examples of further embodiments of the present invention.
- Figure 5 depicts an exploding group 15, wherein association of members to group remains visible.
- Figure 6 depicts a display of entity type 16 as viewed with the MouseOver function.
- Figure 7 depicts an explosion of a group into subgroups 17.
- Figure 8 depicts the explosion of a subgroup 18.
- an aspect of the present invention allows the formation of groups in a 2D visualisation graph whilst keeping it clear. According to an embodiment of the present invention this is achieved by keeping the space required for the nodes minimal and the origin of the added nodes traceable. Further, the graph is rearranged in a smooth way to avoid confusion of the user. According to an embodiment of the invention, the following steps are taken:
- the node 9 in response to the first predetermined stimulus, the node 9 remains in the graph to represent the common relation 8.
- the "group node” is kept in the graph and represents the common relations 8, while the single group members (entities) have a link to the group node.
- the entities may be linked to a further entity or node via a link which represents a relation 8 which may not be common to all entities linked to the first node 9.
- certain embodiments of the present invention provide a visualisation graph layout such that the number of nodes is kept low without missing out potentially relevant information.
- d ⁇ d max the distance is the number of relations 8 on the shortest path between a node and the focus node. Since the number of nodes usually increases exponentially with d max , a value of 1 or 2 is appropriate for most purposes.
- entities of certain types may be included in the graph even if they are far more distant to the focus, if they are considered to be of special interest in the current context either due to their entity type or due to the kind of relations 8 linking them to the focus node.
- the context information in this case can be made up, but is not limited, from the following components: /
- the method may comprise the further steps of: storing 24 data corresponding to a plurality of entities and/or nodes 2, 9, wherein a semantic net includes said entities and/or nodes 2, 9 and wherein the entities and/or nodes 2, 9 are linked to each other by a plurality of relations 8, generating a query, performing the query on the data, and outputting at least two of the plurality of data in the form of a visualisation graph 1 representing the results of the query, wherein the graph 1 has a focus entity or node 10 defined by a user or the query, and using context information to determine at least one entity and/or node to be output in the results which is indirectly related to the focus 10.
- the user By providing the possibility to display entities which are indirectly related to the "focus” entity based on the current context and user preferences, the user is able to collect additional information even if there is no direct relationship between entities. Thus, allowing the user to "jump" from context to context within the graph.
- This embodiment of the present invention allows a user to find how large amounts of data are related. The user is able to navigate and explore knowledge domains in a visual way.
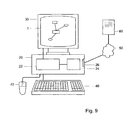
- Figure 9 shows a typical computer arrangement for carrying out the methods according to embodiments of the invention.
- Figure 5 shows a computer 20 including a central processing unit (CPU) 22.
- the computer further includes a storage medium, which may be located in the CPU 22 and/or elsewhere.
- processor readable code is stored, which may be read by the CPU 22 to provide a visualisation graph.
- Various codes may be stored an allocator code processable to allocate the entities to a predetermined sector of the graph depending on their entity type, additional entity allocator code processable so that if an additional entity of a particular entity type is stored in a storing step, the location on the graph of the allocated entities is adapted in accordance with the additional entity.
- the allocator code may include a plurality of attractor codes processable to attract the entities to a predetermined sector of the graph depending on their entity type, respectively, a plurality of repulsor codes processable to repulse the entities allocated to the predetermined sector from one another.
- the attractor codes and the repulsor codes are processable so that the location of an entity on a graph is determined by the sum of the influence exerted on the entity by the attractor code and the repulsor codes.
- the allocator code may further comprise dividing code processable to divide the graph into sectors, wherein an entity is allocated to one of the sectors according to its entity type, and further dividing code processable to further divide the sectors into sub-sectors, wherein an entity is allocated to one of the sub-sectors in accordance with its entity sub-type, wherein the size of the sectors and the sub-sectors is determined in accordance with the number of entities of a particular type allocated to the sector and the number of entities of a particular sub-type allocated to the sub-sector, respectively.
- the allocator code may also include repeater code processable to activate the dividing code if the number of entities to be displayed on a graph changes.
- the processable code may further comprise selection code processable to select those entities from the plurality of entities having a common relation 8 and storing the selected entities as a plurality of groups, representation code processable to represent the groups on the graph as a plurality of nodes, wherein only those relations 8 which all of the nodes have in common are represented.
- the code may also include representation code processable to represent a plurality of entities having a common relation 8 as a node on a visualisation graph, and in response to a predetermined stimulus causing the entities comprised at the node to be displayed, and in response to a further predetermined stimulus causing a graph to restructure so that the entities displayed are replaced by the node.
- a display device 30 such as a screen, for displaying a visualisation graph 1.
- the user may use a keyboard 40, mouse 42 or other operating device to communicate with the computer 20 and to instruct the computer to perform a query.
- the query may be generated automatically. It may alternatively be generated by a user.
- Context information may be defined in the query.
- a computer 20 for providing a visualisation graph 1, the computer 20 may comprise: a database 24, 60 for storing data corresponding to a plurality of entities and/or nodes 2, 9, wherein a semantic net includes said entities and/or nodes 2, 9 and wherein said entities and/or nodes 2, 9 are linked to each other by a plurality of relations 8, a storage medium 22 having recorded therein processor readable code processable to provide a visualisation graph 1, said code including a query code processable to perform a query on said database, an output device 30 for outputting at least two of said plurality of data in the form of a visualisation graph 1 representing the results of said query, wherein said graph 1 has a focus entity or node 10 defined by a user or said query, wherein said code further includes context code processable to express context information which is processable to determine at least one entity and/or node to be output in said results which is indirectly related to
- the context code may be processable to allow at least one entity 2 and/or node 9 to be output in said results which are indirectly related by more than two relations 8.
- the context code may also be processable to enable identification of at least one entity and /or node 2, 9 having a particular interest with respect to the focus 10, and/or may be processable to identify a particular interest on the basis of an entity 2 or node 9 type or due to the relations 8 linking the entity and/or node 2, 9 to the focus 10.
- the context code may be determined by any or a combination of: at least one predetermined user preference, information associated with said focus, or a user's current role and/or session history query.
- the database 24 in which data for building the graph is stored may be located locally at the computer 20.
- the database 60 or an additional database may be located remotely from the computer 20.
- the computer is provided with means to remotely access a remote database.
- a modem 26 connected via the internet 50 or other network or communications link to the remote database 60.
- the embodiment shown in Figure 9 is a typical internet configuration, other configurations may also be possible.
- a stand-alone configuration is also envisaged.
- the database may be distributed over more than one computer. Whilst parts of the processing may be performed on the user's computer, other parts of the processing may be performed remotely at a remote computer. /
- the visualisation graph is concerned with aspects of company dealing with personal hygiene products.
- the invention is not limited in this respect.
- the present invention finds application in any sphere where data is to be navigated. In particular, where complex interrelationships of data are to be navigated. Further applications are found where data in one or more databases is somehow related to one another. Further applications include internet applications, where metadata is accessed and used.
- the expression "visualisation graph” is intended to cover visual representations, such as navigation graphs and other such tools.
Abstract
in response to a query with respect to an entity selected from said plurality of entities, providing a visualisation graph having a plurality of sectors representing the results of said query, and allocating said entities to a predetermined sector of the graph depending on their entity type.
Description
It has been found that conventional visualisation graphs suffer drawbacks. One problem with conventional visualisation graphs using a non-deterministic approach is that entities are arranged in a random. Thus, the orientation within the graph is not optimal.
Figure 1 shows details of a
The
To facilitate orientation, certain types (or kinds) of
It will be understood that the negotiation of sector size determined in accordance with the number of entities and how they are to be distributed causes the graph to have a particular fuzziness. As mentioned, this is achieved by the provision of the
The principle of the present invention may also be used to arrange nodes (refer to Figure 2) in a navigation graph without the use of repulsors and/or attractors.
Further, the method may include the further step of providing repulsors to repulse said entities allocated to said
In a further embodiment, the method may include the steps of: dividing the graph into
In a yet further embodiment, the method may include the step of: repeating the dividing steps if the number of
Figure 4 shows further details of the visualisation graph shown in Figure 3. In particular, Figure 4 depicts a display of a group's
As shown in Figures 3 and 4, to avoid a
The
The selection code is dynamic resulting in a dynamic grouping of the entities. That is, depending on certain criteria such as the context, the selection and abstraction, if applied, may at different times provide different groupings.
In a preferred embodiment, the method comprises the further step of:
In the example, the following facets have been defined for product properties: knowledge, products, technologies, persons, life cycle phases, companies, ideas, insights, facts, concepts, approaches, activities.
Figure 6 depicts a display of
As mentioned, in contrast to conventional visualisation graphs, an aspect of the present invention allows the formation of groups in a 2D visualisation graph whilst keeping it clear. According to an embodiment of the present invention this is achieved by keeping the space required for the nodes minimal and the origin of the added nodes traceable. Further, the graph is rearranged in a smooth way to avoid confusion of the user. According to an embodiment of the invention, the following steps are taken:
- before exploding, the group node increases repulsive force proportionally to the number of entities to be inserted in order to make room for the new nodes. The actual insertion begins, when the neighbour nodes have moved sufficiently far away.
- Although the new nodes inserted into to the graph have a
direct relation 8 to the "focus"node 10, thisrelation 8 is only displayed indirectly: the new entities are connected to the group node which remains in the graph as "bundler" without label and establishes therelation 8 to the "focus"node 10. Thus the number of lines connected to thecenter node 10 remains low. / - While a group "bundler"
node 11 doesn't have a label in order to save space, the group's characteristics are shown when the user moves the mouse pointer over the "bundler"node 11, in the same way as shown in Fig. 4. - Double-clicking a "bundler"
node 11 causes group to collapse again into one node. - The recursive explosion and collapsing of
subgroups 18 is also possible (Fig. 7,8).
In a particular embodiment, the method may include step of: representing a plurality of
In order to enhance navigation of the visualisation graph, entities of certain types may be included in the graph even if they are far more distant to the focus, if they are considered to be of special interest in the current context either due to their entity type or due to the kind of
The context information in this case can be made up, but is not limited, from the following components: /
- Current user's general preferences,
- Context information attached to the "focus" node, and
- Current user's current role and/or session history.
More sophisticated algorithms may be applied to find entities of special interest and it is even possible to let the user create context specific algorithms by means of a scripting language or macro recorder.
According to a particular embodiment, the method may comprise the further steps of: storing 24 data corresponding to a plurality of entities and/or
By providing the possibility to display entities which are indirectly related to the "focus" entity based on the current context and user preferences, the user is able to collect additional information even if there is no direct relationship between entities. Thus, allowing the user to "jump" from context to context within the graph. This embodiment of the present invention allows a user to find how large amounts of data are related. The user is able to navigate and explore knowledge domains in a visual way.
The allocator code may further comprise dividing code processable to divide the graph into sectors, wherein an entity is allocated to one of the sectors according to its entity type, and further dividing code processable to further divide the sectors into sub-sectors, wherein an entity is allocated to one of the sub-sectors in accordance with its entity sub-type, wherein the size of the sectors and the sub-sectors is determined in accordance with the number of entities of a particular type allocated to the sector and the number of entities of a particular sub-type allocated to the sub-sector, respectively.
The allocator code may also include repeater code processable to activate the dividing code if the number of entities to be displayed on a graph changes.
The processable code may further comprise selection code processable to select those entities from the plurality of entities having a
The user may use a
In one embodiment, a
The expression "visualisation graph" is intended to cover visual representations, such as navigation graphs and other such tools.
Claims (25)
- A method of providing a visualisation graph on a computer comprising the steps of:storing data (24) corresponding to a plurality of entities (2) having a particular type, wherein a semantic net includes said entities (2) andwherein said entities (2) are linked to each other by a plurality of relations (8),in response to a query with respect to an entity (2) selected from said plurality of entities (2), providing a visualisation graph (1) having a plurality of sectors (4) representing the results of said query, andallocating said entities (2) to a predetermined sector (1) of the graph (1) depending on their entity type. /
- A method according to claim 1, wherein if an additional entity (2) of a particular entity type is stored in said storing step, the location on the graph of said allocated entities is adapted in accordance with said additional entity.
- A method according to any preceding claim, comprising the further step of providing attractors (3) which attract said entities (2) to said predetermined sector (4) in accordance with their entity types.
- A method according to any preceding claim, comprising the further step of providing repulsors to repulse said entities (2) allocated to said predetermined sector (4) from one another.
- A method according to any of preceding claims 3 or 4, wherein the location of an entity on said graph is determined by the sum of the influence exerted on said entity by said attractor (3) and said repulsors.
- A method according to any preceding claim, comprising the further steps of: dividing said graph into sectors (4), wherein an entity (2) is allocated to one of said sectors (4) according to its entity type, and dividing said sectors (4) into sub-sectors (7), wherein an entity (2) is allocated to one of said sub-sectors (7) in accordance with its entity sub-type, wherein the size of said sectors (4) and said sub-sectors (7) is determined in accordance with the number of entities (2) of a particular type allocated to said sector and the number of entities of a particular sub-type (6) allocated to said sub-sector (7), respectively. /
- A method according to claim 6, comprising the further step of:repeating said dividing steps if the number of entities (2) to be displayed on said graph (1) changes.
- A method according to any preceding claim, comprising the further step of:selecting those entities (2) from said plurality of entities (2) having at least one common relation (8) and storing said selected entities as a plurality of groups, representing said groups on said graph as a plurality of nodes (9), and representing only those relations (8) which all of said nodes (9) have in common.
- A method according to claim 8, wherein said selecting step includes abstracting said relations (8) to find said common relation (8).
- A method according to any preceding claim, comprising the further step of:representing a plurality of entities (2) having a common relation (8) as a first node (9) on said visualisation graph, and in response to a predetermined stimulus causing said entities (2) comprised at said first node (9) to be displayed, and in response to a further predetermined stimulus causing said graph (1) to restructure so that said entities (2) displayed are replaced by said node (9).
- A method according to claim 10, wherein, in response to said first predetermined stimulus, said node (9) remains in said graph to represent said common relation (8).
- A method according to either of claims 10 or 11, wherein said entities (2) are linked to a further entity (2) or node (9) via a link which represents a relation (8) which may not be common to all entities linked to said first node (9).
- A method according to any preceding claim, comprising the further steps of: storing (24) data corresponding to a plurality of entities and/or nodes (2, 9), wherein a semantic net includes said entities and/or nodes (2, 9) and wherein said entities and/or nodes (2, 9) are linked to each other by a plurality of relations 8,
generating a query,
performing said query on said data, and outputting at least two of said plurality of data in the form of a visualisation graph (1) representing the results of said query, wherein said graph (1) has a focus entity or node (10) defined by a user or said query, and
using context information to determine at least one entity and/or node to be output in said results which is indirectly related to said focus (10). - A computer for providing a visualisation graph, said computer comprising:a storage medium (22) having recorded therein processor readable code processable to provide a visualisation graph (1),a database (24, 60) for storing data corresponding to a plurality of entities (2) having a particular type, wherein a semantic net includes said entities (2) and wherein said entities (2) are linked to each other by a plurality of relations (8),a query interface (40, 42) adapted, so that in response to a query with respect to an entity (2) selected from said plurality of entities (2), a visualisation graph (1) is provided representing the results of said query, wherein said code comprises:an allocator code processable to allocate said entities to a predetermined sector (4) of the graph depending on their entity type.
- A computer according to claim 14, wherein if an additional entity (2) of a particular entity type is stored (22) in said storing step, the location on the graph (1) of said allocated entities (2) is adapted in accordance with said additional entity.
- A computer according to either of claims 14 or 15, wherein said allocator code comprises a plurality of attractor codes (3) processable to attract said entities (2) to a predetermined sector (4) of the graph depending on their entity type, respectively.
- A computer according to any of preceding claims 14-16, wherein said allocator code (3) comprises a plurality of repulsor codes processable to repulse said entities (2) allocated to said predetermined sector (4) from one another.
- A computer according to any of preceding claims 16 or 17, wherein the location of an entity (2) on said graph (1) is determined by the sum of the influence exerted on said entity (2) by said attractor code (3) and said repulsor codes.
- A computer according to any of preceding claims 14-18, wherein said allocator code (3) further comprises dividing code processable to divide said graph into sectors (4), wherein an entity is allocated to one of said sectors (4) according to its entity type, and further dividing code processable to further divide said sectors into sub-sectors (7), wherein an entity (2) is allocated to one of said sub-sectors (7) in accordance with its entity sub-type, wherein the size of said sectors (4) and said sub-sectors (7) is determined in accordance with the number of entities (2) of a particular type allocated to said sector (4) and the number of entities of a particular sub-type allocated to said sub-sector (7), respectively.
- A computer according to claim 19, wherein said allocator code comprises repeater code processable to activate said dividing code if the number of entities (2) to be displayed on said graph changes.
- A computer according to any of preceding claims 14-20, wherein said code further comprises selection code processable to select those entities (2) from said plurality of entities having a common relation (8) and storing said selected entities as a plurality of groups, representation code processable to represent said groups on said graph as a plurality of nodes (9), wherein only those relations (8) which all of said nodes (9) have in common are represented.
- A computer according to any of preceding claims 14-21, wherein said code further comprises:representation code processable to represent a plurality of entities (2) having a common relation (8) as a node (9) on said visualisation graph (1), and in response to a predetermined stimulus causing said entities comprised at said node (9) to be displayed, and in response to a further predetermined stimulus causing said graph to restructure so that said entities displayed are replaced by said node (9).
- A computer according to any of preceding claims 14-22, said computer comprises: a database (24, 60) for storing data corresponding to a plurality of entities and/or nodes (2, 9), wherein a semantic net includes said entities and/or nodes (2, 9) and wherein said entities and/or nodes (2, 9) are linked to each other by a plurality of relations 8,
a storage medium (22) having recorded therein processor readable code processable to provide a visualisation graph (1), said code including a query code processable to perform a query on said database (24, 60),
an output device (30) for outputting at least two of said plurality of data in the form of a visualisation graph (1) representing the results of said query, wherein said graph (1) has a focus entity or node (10) defined by a user or said query, wherein said code further includes context code processable to express context information which is processable to determine at least one entity and/or node (2, 9) to be output in said results which is indirectly related to said focus (10). - A user terminal comprising means operable to perform the method of any of claims 1-13.
- A program storage device readable by a processing apparatus, said device embodying a program of instructions executable by the processor to perform the steps of any one of claims 1-13.
Priority Applications (3)
| Application Number | Priority Date | Filing Date | Title |
|---|---|---|---|
| EP03078585A EP1510940A1 (en) | 2003-08-29 | 2003-11-14 | A method of providing a visualisation graph on a computer and a computer for providing a visualisation graph |
| JP2004246055A JP2005100375A (en) | 2003-08-29 | 2004-08-26 | Visualization graph providing method on computer and computer providing visualization graph |
| US10/927,316 US7720857B2 (en) | 2003-08-29 | 2004-08-27 | Method and system for providing an invisible attractor in a predetermined sector, which attracts a subset of entities depending on an entity type |
Applications Claiming Priority (3)
| Application Number | Priority Date | Filing Date | Title |
|---|---|---|---|
| EP03077697A EP1510937A1 (en) | 2003-08-29 | 2003-08-29 | A method of providing a visualisation graph on a computer and a computer for providing a visualisation graph |
| EP03077697 | 2003-08-29 | ||
| EP03078585A EP1510940A1 (en) | 2003-08-29 | 2003-11-14 | A method of providing a visualisation graph on a computer and a computer for providing a visualisation graph |
Publications (1)
| Publication Number | Publication Date |
|---|---|
| EP1510940A1 true EP1510940A1 (en) | 2005-03-02 |
Family
ID=34105748
Family Applications (1)
| Application Number | Title | Priority Date | Filing Date |
|---|---|---|---|
| EP03078585A Pending EP1510940A1 (en) | 2003-08-29 | 2003-11-14 | A method of providing a visualisation graph on a computer and a computer for providing a visualisation graph |
Country Status (3)
| Country | Link |
|---|---|
| US (1) | US7720857B2 (en) |
| EP (1) | EP1510940A1 (en) |
| JP (1) | JP2005100375A (en) |
Cited By (1)
| Publication number | Priority date | Publication date | Assignee | Title |
|---|---|---|---|---|
| CN110647574A (en) * | 2019-09-24 | 2020-01-03 | 厦门市美亚柏科信息股份有限公司 | Social network data display method, terminal device and storage medium |
Families Citing this family (40)
| Publication number | Priority date | Publication date | Assignee | Title |
|---|---|---|---|---|
| EP1510938B1 (en) * | 2003-08-29 | 2014-06-18 | Sap Ag | A method of providing a visualisation graph on a computer and a computer for providing a visualisation graph |
| US7849090B2 (en) | 2005-03-30 | 2010-12-07 | Primal Fusion Inc. | System, method and computer program for faceted classification synthesis |
| US9378203B2 (en) | 2008-05-01 | 2016-06-28 | Primal Fusion Inc. | Methods and apparatus for providing information of interest to one or more users |
| US10002325B2 (en) | 2005-03-30 | 2018-06-19 | Primal Fusion Inc. | Knowledge representation systems and methods incorporating inference rules |
| US8849860B2 (en) | 2005-03-30 | 2014-09-30 | Primal Fusion Inc. | Systems and methods for applying statistical inference techniques to knowledge representations |
| US9177248B2 (en) | 2005-03-30 | 2015-11-03 | Primal Fusion Inc. | Knowledge representation systems and methods incorporating customization |
| US9104779B2 (en) | 2005-03-30 | 2015-08-11 | Primal Fusion Inc. | Systems and methods for analyzing and synthesizing complex knowledge representations |
| US8332782B1 (en) * | 2008-02-22 | 2012-12-11 | Adobe Systems Incorporated | Network visualization and navigation |
| US9087296B2 (en) | 2008-02-22 | 2015-07-21 | Adobe Systems Incorporated | Navigable semantic network that processes a specification to and uses a set of declaritive statements to produce a semantic network model |
| US9361365B2 (en) | 2008-05-01 | 2016-06-07 | Primal Fusion Inc. | Methods and apparatus for searching of content using semantic synthesis |
| CN106845645B (en) | 2008-05-01 | 2020-08-04 | 启创互联公司 | Method and system for generating semantic network and for media composition |
| US8676732B2 (en) | 2008-05-01 | 2014-03-18 | Primal Fusion Inc. | Methods and apparatus for providing information of interest to one or more users |
| WO2009157713A2 (en) * | 2008-06-24 | 2009-12-30 | Samsung Electronics Co., Ltd. | Image processing method and apparatus |
| KR101539935B1 (en) * | 2008-06-24 | 2015-07-28 | 삼성전자주식회사 | Method and apparatus for processing 3D video image |
| CA2734756C (en) | 2008-08-29 | 2018-08-21 | Primal Fusion Inc. | Systems and methods for semantic concept definition and semantic concept relationship synthesis utilizing existing domain definitions |
| US20110060645A1 (en) * | 2009-09-08 | 2011-03-10 | Peter Sweeney | Synthesizing messaging using context provided by consumers |
| US9292855B2 (en) * | 2009-09-08 | 2016-03-22 | Primal Fusion Inc. | Synthesizing messaging using context provided by consumers |
| US20110060644A1 (en) * | 2009-09-08 | 2011-03-10 | Peter Sweeney | Synthesizing messaging using context provided by consumers |
| US9262520B2 (en) | 2009-11-10 | 2016-02-16 | Primal Fusion Inc. | System, method and computer program for creating and manipulating data structures using an interactive graphical interface |
| US8281238B2 (en) * | 2009-11-10 | 2012-10-02 | Primal Fusion Inc. | System, method and computer program for creating and manipulating data structures using an interactive graphical interface |
| US8386495B1 (en) * | 2010-04-23 | 2013-02-26 | Google Inc. | Augmented resource graph for scoring resources |
| US9235806B2 (en) | 2010-06-22 | 2016-01-12 | Primal Fusion Inc. | Methods and devices for customizing knowledge representation systems |
| US10474647B2 (en) | 2010-06-22 | 2019-11-12 | Primal Fusion Inc. | Methods and devices for customizing knowledge representation systems |
| US8819592B2 (en) | 2010-09-03 | 2014-08-26 | Robert Lewis Jackson, JR. | Sparse dynamic selection trees |
| US8775955B2 (en) * | 2010-12-02 | 2014-07-08 | Sap Ag | Attraction-based data visualization |
| US20150135048A1 (en) * | 2011-04-20 | 2015-05-14 | Panafold | Methods, apparatus, and systems for visually representing a relative relevance of content elements to an attractor |
| US20120272168A1 (en) * | 2011-04-20 | 2012-10-25 | Panafold | Methods, apparatus, and systems for visually representing a relative relevance of content elements to an attractor |
| US9098575B2 (en) | 2011-06-20 | 2015-08-04 | Primal Fusion Inc. | Preference-guided semantic processing |
| US11294977B2 (en) | 2011-06-20 | 2022-04-05 | Primal Fusion Inc. | Techniques for presenting content to a user based on the user's preferences |
| US8970595B2 (en) * | 2011-10-26 | 2015-03-03 | Microsoft Corporation | Display and interaction with multidimensional data |
| AU2013249203A1 (en) | 2012-04-18 | 2014-11-13 | Ganalila, Llc | Association mapping game |
| CN104718527B (en) * | 2012-10-12 | 2017-10-20 | 三菱电机株式会社 | Picture transition diagram generating means |
| CN103809943B (en) * | 2012-11-07 | 2018-06-19 | Sap欧洲公司 | Visualize multi-level computer implemented method and readable media and system |
| US9836551B2 (en) * | 2013-01-08 | 2017-12-05 | International Business Machines Corporation | GUI for viewing and manipulating connected tag clouds |
| CA2905304C (en) | 2013-03-13 | 2023-03-21 | Ganalila, Llc | Systems and methods for presenting and discovering relationships between information units |
| US10657178B2 (en) * | 2014-08-22 | 2020-05-19 | Hewlett Packard Enterprise Development Lp | Processing of a generate entity type graph component of a graph analysis system |
| GB2553360A (en) * | 2016-09-05 | 2018-03-07 | Simcentric Ltd | Improvements in searching technology |
| US9836183B1 (en) * | 2016-09-14 | 2017-12-05 | Quid, Inc. | Summarized network graph for semantic similarity graphs of large corpora |
| US10474578B2 (en) * | 2017-08-30 | 2019-11-12 | Oracle International Corporation | Utilization-based throttling of hardware prefetchers |
| US11023481B2 (en) | 2018-08-08 | 2021-06-01 | commos inc. | Navigation platform for performing search queries |
Citations (3)
| Publication number | Priority date | Publication date | Assignee | Title |
|---|---|---|---|---|
| US6154213A (en) * | 1997-05-30 | 2000-11-28 | Rennison; Earl F. | Immersive movement-based interaction with large complex information structures |
| US20030011601A1 (en) * | 2001-06-19 | 2003-01-16 | International Business Machines Corporation | Graphics image creation apparatus, and method and program therefor |
| WO2003069506A2 (en) | 2002-02-12 | 2003-08-21 | Accenture Global Services Gmbh | Display of data element indicia based on data types |
Family Cites Families (66)
| Publication number | Priority date | Publication date | Assignee | Title |
|---|---|---|---|---|
| US5323452A (en) | 1990-12-18 | 1994-06-21 | Bell Communications Research, Inc. | Visual programming of telephone network call processing logic |
| US5619632A (en) | 1994-09-14 | 1997-04-08 | Xerox Corporation | Displaying node-link structure with region of greater spacings and peripheral branches |
| US5590250A (en) | 1994-09-14 | 1996-12-31 | Xerox Corporation | Layout of node-link structures in space with negative curvature |
| US5740440A (en) | 1995-01-06 | 1998-04-14 | Objective Software Technology | Dynamic object visualization and browsing system |
| US5777622A (en) * | 1996-01-05 | 1998-07-07 | International Business Machines Corporation | Method for identifying invisible objects ordered in a tree-like data structure by finding adjoining hidden objects |
| US6144962A (en) | 1996-10-15 | 2000-11-07 | Mercury Interactive Corporation | Visualization of web sites and hierarchical data structures |
| CA2296391C (en) | 1997-07-25 | 2007-03-27 | British Telecommunications Public Limited Company | Visualisation in a modular software system |
| US6356285B1 (en) | 1997-12-17 | 2002-03-12 | Lucent Technologies, Inc | System for visually representing modification information about an characteristic-dependent information processing system |
| US6369819B1 (en) | 1998-04-17 | 2002-04-09 | Xerox Corporation | Methods for visualizing transformations among related series of graphs |
| US6216134B1 (en) | 1998-06-25 | 2001-04-10 | Microsoft Corporation | Method and system for visualization of clusters and classifications |
| US6654761B2 (en) | 1998-07-29 | 2003-11-25 | Inxight Software, Inc. | Controlling which part of data defining a node-link structure is in memory |
| US6263339B1 (en) * | 1998-08-25 | 2001-07-17 | Informix Software, Inc. | Dynamic object visualization and code generation |
| US6154220A (en) | 1998-10-19 | 2000-11-28 | Microsoft Corporation | Rectilinear layout |
| US6496832B2 (en) * | 1998-10-20 | 2002-12-17 | University Of Minnesota | Visualization spreadsheet |
| US6480843B2 (en) | 1998-11-03 | 2002-11-12 | Nec Usa, Inc. | Supporting web-query expansion efficiently using multi-granularity indexing and query processing |
| US6373484B1 (en) | 1999-01-21 | 2002-04-16 | International Business Machines Corporation | Method and system for presenting data structures graphically |
| US6434556B1 (en) | 1999-04-16 | 2002-08-13 | Board Of Trustees Of The University Of Illinois | Visualization of Internet search information |
| US6377287B1 (en) * | 1999-04-19 | 2002-04-23 | Hewlett-Packard Company | Technique for visualizing large web-based hierarchical hyperbolic space with multi-paths |
| EP1050829A3 (en) | 1999-04-22 | 2005-05-18 | International Business Machines Corporation | Visualization of graph-structured name spaces |
| US6789054B1 (en) * | 1999-04-25 | 2004-09-07 | Mahmoud A. Makhlouf | Geometric display tools and methods for the visual specification, design automation, and control of adaptive real systems |
| US6714936B1 (en) | 1999-05-25 | 2004-03-30 | Nevin, Iii Rocky Harry W. | Method and apparatus for displaying data stored in linked nodes |
| US6583794B1 (en) * | 1999-07-01 | 2003-06-24 | Smart Money | Interface system for information mapping |
| US6285951B1 (en) | 1999-07-02 | 2001-09-04 | Pri Automation, Inc. | Dynamic traffic based routing algorithm |
| US6556983B1 (en) | 2000-01-12 | 2003-04-29 | Microsoft Corporation | Methods and apparatus for finding semantic information, such as usage logs, similar to a query using a pattern lattice data space |
| US6868525B1 (en) * | 2000-02-01 | 2005-03-15 | Alberti Anemometer Llc | Computer graphic display visualization system and method |
| US6446083B1 (en) | 2000-05-12 | 2002-09-03 | Vastvideo, Inc. | System and method for classifying media items |
| US6897885B1 (en) * | 2000-06-19 | 2005-05-24 | Hewlett-Packard Development Company, L.P. | Invisible link visualization method and system in a hyperbolic space |
| AU2001278089A1 (en) | 2000-07-31 | 2002-02-13 | Agilix Corporation | Visualization and manipulation of biomolecular relationships using graph operators |
| US6795825B2 (en) | 2000-09-12 | 2004-09-21 | Naphtali David Rishe | Database querying system and method |
| US6981228B1 (en) | 2000-09-29 | 2005-12-27 | Sbc Technology Resources, Inc. | Interactive topology graphs for visualization and characterization of SONET consumption patterns |
| US6792400B2 (en) * | 2000-12-18 | 2004-09-14 | General Motors Corporation | Visualization of complex system interactions |
| US6944830B2 (en) | 2000-12-21 | 2005-09-13 | Xerox Corporation | System and method for browsing hierarchically based node-link structures based on an estimated degree of interest |
| US6646652B2 (en) | 2000-12-21 | 2003-11-11 | Xerox Corporation | System and method for browsing node-link structures based on an estimated degree of interest |
| US6781599B2 (en) | 2001-01-04 | 2004-08-24 | At&T | System and method for visualizing massive multi-digraphs |
| US20020133392A1 (en) | 2001-02-22 | 2002-09-19 | Angel Mark A. | Distributed customer relationship management systems and methods |
| WO2002069192A1 (en) | 2001-02-26 | 2002-09-06 | Compudigm International Limited | Data visualisation system and method |
| US7043702B2 (en) | 2001-03-15 | 2006-05-09 | Xerox Corporation | Method for visualizing user path through a web site and a path's associated information scent |
| US20020158918A1 (en) | 2001-03-28 | 2002-10-31 | Sarnoff Corporation | Method and apparatus for visualizing correlations among and between objects and events |
| US20040030741A1 (en) | 2001-04-02 | 2004-02-12 | Wolton Richard Ernest | Method and apparatus for search, visual navigation, analysis and retrieval of information from networks with remote notification and content delivery |
| JP3790679B2 (en) | 2001-04-06 | 2006-06-28 | インターナショナル・ビジネス・マシーンズ・コーポレーション | Graph data visualization device, graphics creation method, program, and storage medium |
| US6901555B2 (en) | 2001-07-09 | 2005-05-31 | Inxight Software, Inc. | Tree visualization system and method based upon a compressed half-plane model of hyperbolic geometry |
| KR100436356B1 (en) | 2001-08-01 | 2004-06-18 | (주) 위즈도메인 | A method for analyzing and providing inter-citation relationship between patents related to a subject patent |
| US6888548B1 (en) * | 2001-08-31 | 2005-05-03 | Attenex Corporation | System and method for generating a visualized data representation preserving independent variable geometric relationships |
| US7203701B1 (en) | 2002-02-20 | 2007-04-10 | Trilogy Development Group, Inc. | System and method for an interface to provide visualization and navigation of a directed graph |
| US7167910B2 (en) * | 2002-02-20 | 2007-01-23 | Microsoft Corporation | Social mapping of contacts from computer communication information |
| US20030220928A1 (en) | 2002-05-21 | 2003-11-27 | Patrick Durand | Method for organizing and querying a genomic and proteomic databases |
| JP2004069417A (en) | 2002-08-05 | 2004-03-04 | Hitachi Ltd | Method for deciding node coordinates, method for displaying via network and method for screening |
| KR100470977B1 (en) | 2002-09-23 | 2005-03-10 | 학교법인 인하학원 | A fast algorithm for visualizing large-scale protein-protein interactions |
| US8302019B2 (en) | 2002-11-05 | 2012-10-30 | International Business Machines Corporation | System and method for visualizing process flows |
| US20040111255A1 (en) | 2002-12-10 | 2004-06-10 | International Business Machines Corporation | Graph-based method for design, representation, and manipulation of NLU parser domains |
| US7111253B2 (en) | 2002-12-16 | 2006-09-19 | Palo Alto Research Center Incorporated | Method and apparatus for displaying hierarchical information |
| US7224362B2 (en) | 2003-01-30 | 2007-05-29 | Agilent Technologies, Inc. | Systems and methods for providing visualization and network diagrams |
| US7188308B2 (en) | 2003-04-08 | 2007-03-06 | Thomas Weise | Interface and method for exploring a collection of data |
| US7089266B2 (en) | 2003-06-02 | 2006-08-08 | The Board Of Trustees Of The Leland Stanford Jr. University | Computer systems and methods for the query and visualization of multidimensional databases |
| US7167865B1 (en) * | 2003-06-30 | 2007-01-23 | Mvalent, Inc. | Collaborative environment for producing software products |
| EP1510938B1 (en) * | 2003-08-29 | 2014-06-18 | Sap Ag | A method of providing a visualisation graph on a computer and a computer for providing a visualisation graph |
| EP1510939A1 (en) * | 2003-08-29 | 2005-03-02 | Sap Ag | A method of providing a visualisation graph on a computer and a computer for providing a visualisation graph |
| EP1510941A1 (en) * | 2003-08-29 | 2005-03-02 | Sap Ag | A method of providing a visualisation graph on a computer and a computer for providing a visualisation graph |
| EP2487599A1 (en) | 2004-05-04 | 2012-08-15 | Boston Consulting Group, Inc. | Method and apparatus for selecting, analyzing and visualizing related database records as a network |
| US7877737B2 (en) * | 2004-07-23 | 2011-01-25 | University Of Maryland | Tree-to-graph folding procedure for systems engineering requirements |
| US7456840B2 (en) | 2004-08-31 | 2008-11-25 | Oracle International Corporation | Displaying information using nodes in a graph |
| US7421665B2 (en) | 2004-08-31 | 2008-09-02 | Oracle International Corporation | Node scrollers |
| US7468727B2 (en) | 2005-04-19 | 2008-12-23 | Wong Pak C | Methods of visualizing graphs |
| US7627599B2 (en) * | 2005-05-20 | 2009-12-01 | Palo Alto Research Center Incorporated | Method, apparatus, and program product for visualizing tree structured information |
| WO2007062885A1 (en) | 2005-11-29 | 2007-06-07 | International Business Machines Corporation | Method and system for extracting and visualizing graph-structured relations from unstructured text |
| US8122050B2 (en) * | 2008-04-16 | 2012-02-21 | International Business Machines Corporation | Query processing visualization system and method of visualizing query processing |
-
2003
- 2003-11-14 EP EP03078585A patent/EP1510940A1/en active Pending
-
2004
- 2004-08-26 JP JP2004246055A patent/JP2005100375A/en active Pending
- 2004-08-27 US US10/927,316 patent/US7720857B2/en active Active
Patent Citations (3)
| Publication number | Priority date | Publication date | Assignee | Title |
|---|---|---|---|---|
| US6154213A (en) * | 1997-05-30 | 2000-11-28 | Rennison; Earl F. | Immersive movement-based interaction with large complex information structures |
| US20030011601A1 (en) * | 2001-06-19 | 2003-01-16 | International Business Machines Corporation | Graphics image creation apparatus, and method and program therefor |
| WO2003069506A2 (en) | 2002-02-12 | 2003-08-21 | Accenture Global Services Gmbh | Display of data element indicia based on data types |
Non-Patent Citations (17)
| Title |
|---|
| BROCKENAUER R ET AL: "Drawing Clusters and Hierarchies", LECTURE NOTES IN COMPUTER SCIENCE/COMPUTATIONAL SCIENCE (CPAIOR 2011), SPRINGER, DE, vol. 2025 / 2001, 1 June 2003 (2003-06-01), pages 193 - 227, XP002283485, ISBN: 978-3-540-24128-7 * |
| C. FLUIT ET AL.: "Ontology-based Information Visualisation", 5TH INTERNATIONAL CONFERENCE ON INFORMATION VISUALISATION, 25 July 2001 (2001-07-25), pages 546 - 559, XP002281069 |
| EADES P ET AL: "Navigating Clustered Graphs using Force-Directed Methods", JOURNAL OF GRAPH ALGORITHMS AND APPLICATIONS AND APPLICATIONS, BROWN UNIVERSITY, DEPT. OF COMPUTER SCIENCE, PROVIDENCE, RI, US, vol. 4, no. 3, 1 January 2000 (2000-01-01), pages 157 - 181, XP002284042, ISSN: 1526-1719 * |
| FLUIT C ET AL: "Ontology-based Information Visualisation", PROCEEDINGS OF THE INTERNATIONAL CONFERENCE ON INFORMATIONVISUALISATION, XX, XX, 25 July 2001 (2001-07-25), pages 546 - 559, XP002281069 * |
| FLUIT C, SABOU M, VAN HARMELEN F: "Ontology-based Information Visualisation", FIFTH INTERNATIONAL CONFERENCE ON INFORMATION VISUALISATION (IV'01), 25 July 2001 (2001-07-25) - 27 July 2001 (2001-07-27), London, England, pages 546 - 559, XP002281069 * |
| G. WILLS, NICHE WORKS - INTERACTIVE VISUALIZATION OF VERY LARGE GRAPHS, 1999, pages 190 - 212 |
| GOLOVCHINSKY G ET AL: "Subverting structure: data-driven diagram generation", VISUALIZATION, 1995. VISUALIZATION '95. PROCEEDINGS., IEEE CONFERENCE ON ATLANTA, GA, USA 29 OCT.-3 NOV. 1995, LOS ALAMITOS, CA, USA,IEEE COMPUT. SOC, US, 29 October 1995 (1995-10-29), pages 217 - 223,455, XP010151200, ISBN: 0-8186-7187-4 * |
| HERMAN ET AL.: "Graph Visualization and Navigation in Information Visualization: a Survey", IEEE TRANSACTIONS ON VISUALIZATION AND COMPUTER GRAPHICS, vol. 6, no. 1, 2000, pages 24 - 43, XP000930481, DOI: doi:10.1109/2945.841119 |
| HERMAN I, MELANÇON G, SCOTT MARSHALL M: "Graph visualization and Navigation in Information Visualization: a Survey", IEEE TRANSACTIONS ON VISUALIZATION AND COMPUTER GRAPHICS, vol. 6, no. 1, 2000, pages 24 - 43, XP002281070 * |
| MUKHERJEA S ET AL: "Interactive clustering for navigating in hypermedia systems", ACM EUROPEAN CONFERENCE ON HYPERMEDIA TECHNOLOGY, PROCEEDINGS, XX, XX, 1 September 1994 (1994-09-01), pages 136 - 145, XP002283483, DOI: 10.1145/192757.192787 * |
| MUTTON P ET AL: "Visualization of semantic metadata and ontologies", SEVENTH INTERNATIONAL CONFERENCE ON INFORMATION VISUALISATION, 16 July 2003 (2003-07-16), pages 300 - 305, XP010648515 * |
| P. MUTTON ET AL.: "Visualization of Semantic Metadata and Ontologies", 7-TH INTERNATIONAL CONFERENCE ON INFORMATION VISUALIZATION, 16 July 2003 (2003-07-16), pages 300 - 305, XP010648515, DOI: doi:10.1109/IV.2003.1217994 |
| Q. NGUYEN ET AL.: "A Space-Optimized Tree Visualization", INFORMATION VISUALIZATION, 28 October 2002 (2002-10-28) |
| ROTH A: "Modellierung und Anwendung von Ontologien am Beispiel "Operations Research & Management Science"", 12 July 2002, UNIVERSITÄT PADERBORN, PADERBORN, GERMANY, XP002281071 * |
| SCOTT MARSHALL: "Methods and Tools for the Visualization and Navigation of Graphs", PHD THESIS UNIVERSITE BORDEAUX, XX, XX, 1 January 2001 (2001-01-01), pages complete, XP002284043 * |
| SOUGATA MUKHERJEA ET AL: "Requirements and architecture of an information visualization tool", 28 October 1995, DATABASE ISSUES FOR DATA VISUALIZATION, SPRINGER BERLIN HEIDELBERG, BERLIN, HEIDELBERG, PAGE(S) 57 - 75, ISBN: 978-3-540-62221-5, XP019197115 * |
| XIAOBO WANG ET AL: "Generating customized layouts", 20 September 1995, GRAPH DRAWING. SYMPOSIUM ON GRAPH DRAWING, (PROCEEDINGS OF GRAPH DRAWING '95 - 20-22 SEPT. 1995 - PASSAU, GERMANY), SPRINGER BERLIN HEIDELBERG, BERLIN, HEIDELBERG, PAGE(S) 504 - 515, ISBN: 978-3-540-60723-6, XP019189981 * |
Cited By (2)
| Publication number | Priority date | Publication date | Assignee | Title |
|---|---|---|---|---|
| CN110647574A (en) * | 2019-09-24 | 2020-01-03 | 厦门市美亚柏科信息股份有限公司 | Social network data display method, terminal device and storage medium |
| CN110647574B (en) * | 2019-09-24 | 2022-05-03 | 厦门市美亚柏科信息股份有限公司 | Social network data display method, terminal device and storage medium |
Also Published As
| Publication number | Publication date |
|---|---|
| US20050114384A1 (en) | 2005-05-26 |
| US7720857B2 (en) | 2010-05-18 |
| JP2005100375A (en) | 2005-04-14 |
Similar Documents
| Publication | Publication Date | Title |
|---|---|---|
| US7720857B2 (en) | Method and system for providing an invisible attractor in a predetermined sector, which attracts a subset of entities depending on an entity type | |
| US7853552B2 (en) | Method and system for increasing a repulsive force between a first node and surrounding nodes in proportion to a number of entities and adding nodes to a visualization graph | |
| US7549309B2 (en) | Method and system for restructuring a visualization graph so that entities linked to a common node are replaced by the common node in response to a predetermined stimulus | |
| EP1510941A1 (en) | A method of providing a visualisation graph on a computer and a computer for providing a visualisation graph | |
| JP3747404B2 (en) | Graphics image creating apparatus, method and program thereof | |
| JP4355050B2 (en) | Method, apparatus and medium for visualizing deformation between a series of related graphs | |
| Kreuseler et al. | A scalable framework for information visualization | |
| JP4355049B2 (en) | USAGE BASED CIRCUIT AND DISPLAY METHOD, DEVICE AND MEDIUM FOR GENERALIZED GRAPH STRUCTURE | |
| WO2011142720A1 (en) | A self-organizing and contextual graphical user interface | |
| Stober et al. | Musicgalaxy: A multi-focus zoomable interface for multi-facet exploration of music collections | |
| EP1510937A1 (en) | A method of providing a visualisation graph on a computer and a computer for providing a visualisation graph | |
| US20230145348A1 (en) | Force-directed graph layout | |
| JP4518388B2 (en) | Web page browsing device | |
| Artignan et al. | Multiscale visual analysis of lexical networks | |
| GB2593700A (en) | Force-directed graph layout | |
| Hao et al. | RELT–visualizing trees on mobile devices | |
| Greffard et al. | Immersive dynamic visualization of interactions in a social network | |
| Moere et al. | Visualizing abstract information using motion properties of data-driven infoticles | |
| Somasundaram | OntoSELF: A 3D ontology visualization tool | |
| TW202333035A (en) | Method for representing objects of a network in a gui with a graph clustering | |
| Moldeklev | Generating tree-like graphs | |
| Darakapalli | Visualization of Knowledge Representation & Distributed Activation Spreading in Long-Term Memory | |
| JP4370985B2 (en) | Real-time access information display method, apparatus and program | |
| Bichler | Visualization framework for information graphs: an incremental approach | |
| Mank | CristalView-The visualization of a Cristal |
Legal Events
| Date | Code | Title | Description |
|---|---|---|---|
| PUAI | Public reference made under article 153(3) epc to a published international application that has entered the european phase |
Free format text: ORIGINAL CODE: 0009012 |
|
| AK | Designated contracting states |
Kind code of ref document: A1 Designated state(s): AT BE BG CH CY CZ DE DK EE ES FI FR GB GR HU IE IT LI LU MC NL PT RO SE SI SK TR |
|
| AX | Request for extension of the european patent |
Extension state: AL LT LV MK |
|
| 17P | Request for examination filed |
Effective date: 20050623 |
|
| AKX | Designation fees paid |
Designated state(s): AT BE BG CH CY CZ DE DK EE ES FI FR GB GR HU IE IT LI LU MC NL PT RO SE SI SK TR |
|
| RAP1 | Party data changed (applicant data changed or rights of an application transferred) |
Owner name: SAP AG |
|
| 17Q | First examination report despatched |
Effective date: 20061108 |
|
| STAA | Information on the status of an ep patent application or granted ep patent |
Free format text: STATUS: EXAMINATION IS IN PROGRESS |