-
This invention relates to digital image processing and in particular
to processing a digital image to enhance its color, brightness, and tone scale
characteristics.
-
Many digital imaging systems enhance the contrast and lightness
characteristics of digital images through the application of a tone scale curve. For
a generalized tone scale curve f(), the input pixel value x is transformed to an
output pixel value f(x). The shape of the tone scale curve determines the visual
effect imparted to the processed digital image. Some tone scale curves applied to
digital image are independent of the pixel values in the digital image to be
processed. Such image independent tone scale curves are useful for establishing a
photographic look to the processed digital images. While image independent tone
scale curves can be used to enhance many digital images, digital images that are
either too high or low in contrast can benefit from the application of a tone scale
curve that is responsive to the distribution of pixel values in the digital image to
be processed. For image dependent tone scale curves, the mathematical formula
used to generate the function f(x) determines the degree and nature of the image
enhancement.
-
When a compressive tone scale function, that is, the tone scale
function designed to reduce the numerical range of pixel values, is applied
directly to image pixel data, the spatial detail in the image can be diminished. In
addition, if the compressive tone scale function is applied directly to a color
digital image that is in a red-green-blue representation, the tone scale function can
reduce the colorfulness (saturation) characteristics of the processed digital image.
In general, better results can be achieved if the compressive tone scale function is
applied directly to the luminance signal of a luminance-chrominance image
representation. This procedure leaves the chrominance signals unchanged but can
lead to processed images that have diminished spatial detail and look unnaturally
colorful.
-
In the method disclosed by Gallagher and Gindele in commonly-assigned
US-A-6,167,165, the spatial detail of the processed image can be mostly
restored. In this method, a tone scale function is applied directly to the luminance
signal and the spatial frequency detail of the tone scale modified luminance signal
is adjusted inversely proportional to the slope of the applied tone scale function.
The resultant processed digital images have more spatial detail and appear more
natural.
-
A spatial filter can be used to apply a tone scale function to a
digital image in such a manner that the image spatial detail will be relatively
unaffected. This is particularly useful for compressive tone scale functions
designed to reduce the image dynamic range. Such spatial filtering methods have
been disclosed in commonly-assigned US-A-6,317,521 and US-A-6,285,798.
When applying compressive tone scale functions to the luminance signal with a
spatial filter, the color characteristics of the processed digital images look more
natural even though the chrominance signals are not modified.
Some of the color problems incurred with the application of tone scale functions
to luminance-chrominance representation digital images can be solved using the
method disclosed by Gallagher and Gindele in commonly-assigned US-A-6,408,103.
In this method the chrominance signals are modified as a function of
the slope of the applied tone scale function. Modifying the chrominance signals
in this manner tends to alleviate the unnatural color effects that would otherwise
result.
-
Some images naturally have a low numerical range to the pixel
values and can be enhanced by applying an expansive tone scale function
designed to increase the numerical range of pixel values. Simple histogram
stretching methods are well known in the art. Typically a histogram is calculated
from the image pixel values and the minimum and maximum pixel values are
obtained. A tone scale function is constructed using a linear transform equation
that expands the pixel values to achieve a predetermined goal. For example the
minimum pixel value is mapped to a lower pixel value while the maximum pixel
value is mapped to a higher pixel value. Applying an expansive tone scale
function to image pixel data when in a red-green-blue representation has the effect
of increasing image contrast, spatial detail, and color saturation. In general, the
increase in contrast and spatial detail is viewed as an improvement in image
quality. However, the increase in color saturation can lead to super-saturated
color that can appear unnaturally colorful. Applying an expansive tone scale
function to the luminance signal of a luminance-chrominance representation has
the effect of increasing image contrast and spatial detail, but decreasing the
apparent color saturation even though the chrominance signals are mathematically
unaltered.
-
In commonly-assigned US-A-6,317,521 Gallagher and Gindele
disclose spatial filtering method for applying tone scale functions to digital images.
In this method, the luminance channel of a luminance-chrominance representation
digital image is separated into two signal parts. A tone scale function is applied
directly to one of the signal parts and the other signal part is added back to the
modified signal part. Tone scale functions generated with the methods disclosed in
commonly-assigned US-A-4,731,671 and US-A-4,745,465 have been applied with
the spatial filtering method disclosed in commonly-assigned US-A-6,317,521 with
success. In general, more spatial detail is preserved in the enhanced digital images
than if a spatial filter were not used.
-
In commonly-assigned US-A-6,285,798 Lee discloses a method of
generating a tone scale curve for the purposes of reducing the dynamic range of a
digital image. The tone scale curve construction method establishes six
constraints and then performs a successive integration procedure to satisfy the
constraints. In Lee's method, a dark point determined by the 0.5% image
cumulative histogram function value is mapped to a white paper density, a bright
point determined by the 99.5% image cumulative histogram function value is
mapped to a black paper density, and a mid-point is mapped to itself. Next a
shadow slope constraint of greater than 1.0 is imposed at the 0.5% shadow point,
a highlight slope constraint of 1.0 is imposed at the 99.5% highlight point, and a
mid-tone slope constraint of 1.0 is imposed at the mid-point. In commonly-assigned
US-A-6,285,798 Lee also discloses a wave-let based spatial filtering
technique for applying the generated tone scale function to image data. This
spatial filtering technique helps preserve image spatial detail while enhancing the
tonal characteristics with the compressive nature of the tone scale function. That
is, the tone scale functions produced by Lee's method compress, or reduce, the
scene dynamic range of the image data. Lee's method does not account for the
possibility that some digital images require an expansion of the dynamic range of
the digital image to achieve enhancement.
-
The above mentioned methods are individually designed to either
avoid or remedy specific problems with image spatial detail and color
characteristics when for applying tone scale functions to digital images.
However, these methods have been designed to work primarily for compressive
tone scale functions.
-
It is an object of the present invention to improve the method for
applying a tone scale function to a digital image to enhance the tonal and spatial
detail characteristics of the digital image.
-
This object is achieved by a method of enhancing the tonal
characteristics of a digital image, comprising the steps of:
- a) receiving a source digital image including a plurality of
pixels;
- b) producing a tone scale function that can be used to enhance
the tonal characteristics of the source digital image;
- c) classifying the tone scale function into one of two or more
categories based on the effect the tone scale function will have on the numerical
range of pixel values, wherein the classification categories include expansive and
compressive; and
- d) using the tone scale function, the source digital image, and
a spatial filter to produce an enhanced digital image when the tone scale function
has been classified as compressive, and using the tone scale function and the
source digital image without a spatial filter to produce the enhanced digital image
when the tone scale function has been classified as expansive.
-
-
The present invention facilitates using functions that are either
compressive or expansive to improve image luminance contrast wherein
compressive tone scale functions are applied using a spatial filter designed to
preserve spatial detail and expansive tone scale functions are applied without
using a spatial filter resulting in a processed digital image with improved spatial
detail.
- FIG. 1 is a functional block diagram showing the component parts
of a system implementation of the present invention;
- FIG. 2 is a functional block diagram of the digital image processor;
- FIG. 3a is a graph of an example of a rendering function;
- FIG. 3b is a graph of another example of a rendering function;
- FIG. 4 is a functional block diagram of the tone scale module;
- FIG. 5 is a functional block diagram of the tone scale function
applicator;
- FIG. 6a is a functional block diagram of the compressive function
applicator;
- FIG. 6b is a functional block diagram of the expansive function
applicator;
- FIG. 7. is a graph illustrating a family of highlight tone scale
segments and a family of shadow tone scale segments;
- FIG. 8a is a graph of an example of a compressive highlight
component function and its corresponding slope function;
- FIG. 8b is a graph of an example of a compressive shadow
component function and its corresponding slope function;
- FIG. 8c is a graph of an example of a tone scale function
constructed from a compressive highlight and shadow tone scale segment and its
corresponding slope function;
- FIG. 9 is a graph illustrating a family of highlight tone scale
segments and a family of shadow tone scale segments constructed;
- FIG. 10a is a graph illustrating the construction details of an
expansive highlight component function;
- FIG. 10b is a graph illustrating the construction details of an
expansive shadow component function;
- FIG. 10c is a graph of an example of a tone scale function
constructed from an expansive highlight and shadow tone scale segment and its
corresponding slope function;
- FIG. 11 is a graph illustrating a family of highlight tone scale
segments and a family of shadow tone scale segments;
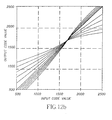
- FIG. 12a is a graph illustrating a family of highlight tone scale
segments and a family of shadow tone scale segments for both compressive and
expansive type functions;
- FIG. 12b is another graph illustrating a family of highlight tone
scale segments and a family of shadow tone scale segments for both compressive
and expansive type functions; and
- FIG. 13 is a graph illustrating an example image histogram
function and its corresponding cumulative histogram function.
-
-
In the following description, a preferred embodiment of the present
invention will be described as a software program. Those skilled in the art will
readily recognize that the equivalent of such software may also be constructed in
hardware. Because image processing algorithms and systems are well known, the
present description will be directed in particular to algorithms and systems
forming part of, or cooperating more directly with, the method in accordance with
the present invention. Other aspects of such algorithms and systems, and
hardware and/or software for producing and otherwise processing the image
signals involved therewith, not specifically shown or described herein, may be
selected from such systems, algorithms, components and elements thereof known
in the art. Given the description as set forth in the following specification, all
software implementation thereof as a computer program is conventional and
within the ordinary skill in such arts.
-
Still further, as used herein, the computer program may be stored
in a computer readable storage medium, which may comprise, for example:
magnetic storage media such as a magnetic disk (such as a floppy disk) or
magnetic tape; optical storage media such as an optical disc, optical tape, or
machine readable bar code; solid state electronic storage devices such as random
access memory (RAM), or read only memory (ROM); or any other physical
device or medium employed to store a computer program.
-
A digital image is comprised of one or more digital image
channels. Each digital image channel is comprised of a two-dimensional array of
pixels. Each pixel value relates to the amount of light received by the imaging
capture device corresponding to the geometrical domain of the pixel. For color
imaging applications, a digital image will typically consist of red, green, and blue
digital image channels. Other configurations are also practiced, for example,
cyan, magenta, and yellow digital image channels. For monochrome applications,
the digital image consists of one digital image channel. Motion imaging
applications can be thought of as a time sequence of digital images. Those skilled
in the art will recognize that the present invention can be applied to, but is not
limited to, a digital image channel for any of the above mentioned applications.
-
Although the present invention describes a digital image channel as
a two-dimensional array of pixels values arranged by rows and columns, those
skilled in the art will recognize that the present invention can be applied to mosaic
(non-rectilinear) arrays with equal effect.
-
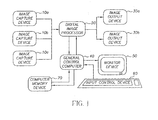
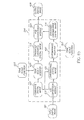
The present invention may be implemented in computer hardware.
Referring to FIG. 1, the following description relates to a digital imaging system
which includes an image capture device 10, a digital image processor 20, image
output devices 30a and 30b, and a general control computer 40. The system may
include a monitor device 50 such as a computer console or paper printer. The
system may also include an input control device 60 for an operator such as a
keyboard and or mouse pointer. Still further, as used herein, the present invention
may be implemented as a computer program and may be stored in a computer
memory device 70, that is, a computer readable storage medium, which may
comprise, for example: magnetic storage media such as a magnetic disk (such as
a floppy disk) or magnetic tape; optical storage media such as an optical disc,
optical tape, or machine readable bar code; solid state electronic storage devices
such as random access memory (RAM), or read only memory (ROM); or any
other physical device or medium employed to store a computer program. Before
describing the present invention, it facilitates understanding to note that the
present invention is preferably utilized on any well known computer system, such
as a personal computer.
-
Multiple image capture devices 10a, 10b, and 10c are shown
illustrating that the present invention can be used for digital images derived from
a variety of imaging devices. For example, FIG. 1 can represent a digital
photofinishing system where the image capture device 10a may be a film scanner
device which produces digital images by scanning a conventional photographic
image, for example, color negative film or slide film transparencies. Similarly,
image capture device 10b could be a digital camera. A digital image processor 20
provides the means for processing the digital images to produce pleasing looking
images on an intended output device or media. Multiple image output devices
30a and 30b are shown illustrating that the present invention may be used in
conjunction with a variety of output devices which may include a digital
photographic printer and soft copy display. It should also be noted that the
present invention can be implemented within the hardware and software of a
digital camera such that the digital images produced by the digital camera have
been processed with the present invention prior to being exported by the digital
camera.
-
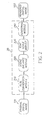
The digital image processor 20 depicted in FIG. 1 is illustrated in
more detail in FIG. 2. The cascaded image processing modules shown in FIG. 2
represents a digital image processing path. An original digital image 101 is
received from one of the image input devices shown in FIG. 1 and processed to
produce a rendered digital image 103 that can be realized on an image output
device. A RLSE (relative log scene exposure) conversion module 310 receives
the original digital image 101 and generates an RLSE digital image that is
prepared for balancing and the application of a tone scale function. A scene
balance module 320 receives the RLSE digital image and performs a lightness and
color balance adjustment resulting in a source digital image. A tone scale module
330 receives the source digital image, generates a tone scale function from the
source digital image and applies the tone scale function to the source digital image
resulting in an enhanced digital image. If the RLSE conversion module 310 and
the scene balance module 320 are omitted from the image processing path of
modules, the tone scale module 330 receives the original digital image 101
directly as the source digital image. A rendering module 340 processes the
enhanced digital image such that the pixel values of the generated rendered digital
image 103 have been prepared to yield a pleasing result when used in conjunction
with an output image device such as a digital printer. As part of the processing
performed by the rendering module 340, a rendering function R(x) is applied to
the pixel data of the enhanced digital image to achieve the input to output pixel
mapping required of the output image device. The configuration of processing
modules shown in FIG. 2 is used for processing digital images that are either
monochrome or color in nature. That is, the original digital image 101 includes
one or more digital image channels of pixels wherein each digital image channel
relates to a different color or pixels such as, an original digital image 101 that
includes red, green, and blue representation or a luminance-chrominance
representation.
-
The tone scale functions produced are designed to work best with
digital images that are in a relative log scene exposure representation (RLSE).
That is, the pixels of the original digital image 101 have a logarithmic relationship
with respect to the original scene intensities of light from which the original
digital image 101 is derived. For example, the image capture device 10a shown in
FIG. 1 can represent a photographic film scanner that produces digital images that
have a linear or logarithmic relationship with the amount of transmitted light
projected through a photographic negative or positive film transparency sample.
If the pixels values of the resultant original digital image 101 have a logarithmic
relationship with the received light (that is, the pixels are in a density
representation), the original digital image 101 is considered to be in a relative 1og
scene exposure representation. If the pixels of the original digital image 101 have
a linear relationship with the received light, the original digital image 101 is
considered to be in a linear exposure representation since, to within a reasonable
approximation, the amount of light transmitted through the photographic film
sample is linearly proportional to the amount of light received from the original
photographed scene. A linear exposure representation digital image can be
transformed into a relative log scene exposure representation by a linear-to-logarithmic
transform implemented as function or as look-up-table (LUT) with
the RLSE module 310 shown in FIG. 2.
-
The most common representation of digital images produced with
digital cameras is a rendered representation, that is, the digital image has been
processed such that it will be yield a natural appearing image on an electronic
display device. For most digital images produced with digital cameras the
intended output image device is a CRT monitor device sometimes referred to as a
gamma domain representation. Rendered digital images can also be transformed
into a relative log scene exposure representation using a LUT transform. For
digital images produced with digital cameras, the transform includes an inverse of
the power law function associated with the intended electronic display device
followed by an inverse rendering tone scale function related to the rendering tone
scale function that the digital camera used to produce the original digital image
101. Alternatively, the method disclosed by McCarthy and others in commonly-assigned
US-A-6,282,311 can be used to produce an RLSE representation from a
rendered digital image.
-
While the best results are achieved with digital images that are in a
relative log scene exposure representation, the present invention can be used to
enhance the appearance of digital images that are in other representations such as
linear and gamma domain representations described above. In particular, the
present invention can be used to process digital images that are in a visual domain
such as CIELAB (one of the color spaces defined by the International
Commission on Illumination abbreviated as CIE).
-
The scene balance module 320 receives the RLSE digital image
from the RLSE conversion module 310 and performs a lightness and color
balance adjustment. The resulting processed digital image is called the source
digital image since it is the input digital image to the tone scale module 330. The
lightness adjustment to the pixel data accounts for exposure variability in the
original digital image 101. The present invention can be used with any algorithm
that performs a lightness adjustment, or luminance balance, of the input pixel
data. In particular, the lightness balance procedure includes calculating one or
more prediction features from the RLSE digital image. These predication features
are combined using a linear equation of the prediction features into a single
brightness balance value that relates to an estimate of the pixel value
corresponding to a theoretical 18% gray scene reflector. While there are many
such prediction features that are useful, the present invention uses a spatial
activity measure as the most important prediction feature. An RLSE luminance-chrominance
digital image is generated from the RLSE digital image. Next, a
spatial activity filter is applied to the luminance pixel data of the RLSE
luminance-chrominance digital image. The spatial activity filter calculates the
minimum difference of adjacent pixel values within a 3 by 3 pixel region and
assigns the minimum difference to the pixel. Pixels with minimum difference
values that exceed a predetermined threshold are averaged to produce the first
prediction feature. The second prediction feature is calculated by dividing the
luminance pixels of the RLSE luminance-chrominance digital image into four
strips and calculating the average the maximum pixel value from each of the four
strips. Other prediction features that have proved to be useful are the average
pixel value and the 90% cumulative histogram pixel value.
-
After the brightness balance value of the RLSE digital image has
been calculated, the color cast of the RLSE digital image is calculated that can be
used to remove an overall color cast. The principle causes of color casts are
variation in the color of the source illumination and secondarily the color fidelity
of the image sensor that recorded the original digital image. A color balance
position is calculated for the RLSE digital image which represents the
chrominance coordinates of a theoretical color-neutral scene reflector. The color
balance position is calculated using a two dimensional Gaussian weighting surface
applied to the chrominance pixel data of the RLSE luminance-chrominance digital
image. Although the chrominance pixel data can be averaged in an unweighted
manner, better results have been obtained using the two dimensional Gaussian
weighting surface. This is principally due to the de-emphasis of highly colorful
scene objects from the calculation. A balance look-up-table is calculated for each
color of the RLSE digital image using the calculated color balance position and
the brightness balance value. The balance look-up-table is applied to the RLSE
digital image to produce the source digital image for the tone scale module 330.
As a result of the application of the balance look-up-table, pixel values in the
RLSE digital image that have a value equal to the predicted balance value are
transformed to a value equal to a system defined reference gray point. Similarly,
pixels with corresponding chrominance values that correspond to the color
balance position will be transformed to a color neutral position.
-
It should be noted that it is also possible to combine the operation
of the lightness balance procedure described above with the construction of the
tone scale function described in later detail below. The lightness balance
operation is equivalent to adjusting the reference gray point used in the
construction of the tone scale function. If the lightness balance operation is
combined with the construction of the tone scale function, the reference gray
point is image dependent since the pixels of the digital image being processed are
used to calculate the reference gray point.
-
The rendering module 340 accepts the enhanced digital image from
the tone scale module 330 and prepares the pixel data for display on an output
image device. The rendering module 340 performs a color transformation, a tonal
rendering transformation, and an output encoding transformation. The pixel data
must be transformed such that the pixel data representing different original scene
colors are appropriate for the color spectral characteristics associated with the
output image device. This can be accomplished in a multiple step procedure.
First the RLSE representation pixel data of the enhanced digital image is
transformed into a linear representation. Next a color matrix transform is applied
to the linear representation pixel data. The color matrix can be a 3 by 3 element
matrix wherein the elements of the matrix are determined by analyzing a
collection of imaged color patch targets and measuring the resultant color
produced with the intended output image device.
-
The other task includes the transformation of the pixel data from
the linear or relative-log-scene -exposure representation to a rendered
representation with the application of a rendering function R(x). In general, the
dynamic range of the enhanced digital image is much larger than can be displayed
on typical output image devices such as CRT monitors or photographic paper.
Therefore, if the pixel data of the enhanced digital image were received by the
output image device directly, much of the pixel data would be clipped in the
extreme light and dark parts of the image with a substantial loss of spatial detail.
The rendering function performs a graceful roll-off of the pixel data such that the
processed pixel data when displayed will result in a gradual loss of spatial detail
as pixel values approach the limits of the output image device.
-
The present invention can be used with many different
mathematical forms for the rendering function such as a rendering function
produced with the method disclosed in commonly-assigned US-A-5,300,381 by
Buhr and others. In general, optimal results are obtained using rendering
functions that have a sigmoid shape, that is, rendering functions having a zero or
near slope for extreme input pixel values and having a maximum magnitude slope
that is achieved for mid-tone input values. Some rendering functions can have a
relatively high slope for the darkest domain of input pixel values but many
rendering functions have a zero or near zero slope characteristic for the lightest
domain of pixel values. The rendering function, to an extent, mimics the photo
response characteristics of photographic paper used in analog imaging
applications.
-
Although it is possible to use a rendering function that is dependent
on the digital image being processed, the preferred embodiment of the present
invention uses a sigmoid shaped rendering function that is independent of the
digital image. Image dependent modification to the digital image being processed
is performed by the tone scale module 330 prior to the application of the
rendering function. Thus, the tone scale module 330 is responsible for scene
dependent changes to the image content while the rendering module 340 is
responsible for preparing the final processed image for an image output device.
-
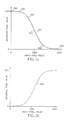
FIG. 3a shows a graph of an example rendering function R(x)
(indicated by curve 590) that is suitable for use with the present invention. Point
591 corresponds to an input pixel value equal to the reference gray point. Point
592 indicates the rendering function response for a highlight pixel value
corresponding to a light region in the original digital image 101. Point 593
indicates the rendering function response for a shadow pixel value corresponding
to a dark region in the original digital image 101. Point 595 indicates the
rendering function response corresponding to brightest reproduced output value of
the output image device. Similarly, point 596 indicates the rendering function
response corresponding to the darkest reproduced output value of the output
image device. Point 597 indicates the point on the rendering function for which
the instantaneous slope has a maximum magnitude which does not necessarily
coincide with the reference gray point 591. The point of maximum magnitude
slope is also the inflection point of the sigmoid function, that is, a local maximum
or minimum in the corresponding slope function of the rendering function R(x).
The example rendering function shown in FIG. 3a is appropriate for a digital
imaging system that uses a 12-bit pixel value representation for processing digital
images. Many output display devices accept digital images with an 8-bit pixel
value representation. The example rendering function shown in FIG. 3a maps 12-bit
input pixel values ranging from 0 to 4095 to output rendering pixel values
ranging from 255 to 0.
-
The example rendering function shown in FIG. 3a is typical for use
with a digital printer that produces digital photographic prints. The output pixel
value scale shown can relate to photographic paper densities, for example, the
digital printer can be calibrated such that each pixel code value is equal to 100
times the optical density that will be produced on the print. However, the present
invention can also be used with electronic display devices. A typical rendering
function for use with an electronic display device is shown in FIG. 3b as indicated
by curve 598. Note that the rendering function R(x) shown in FIG. 3b produces
higher numerical output rendering pixel values for higher numerical input pixel
values. For a typical computer monitor device, the output pixel values will range
from 0 (representing black) to 255 (representing white). The example rendering
function shown in FIG. 3b maps 12-bit input pixel values ranging from 0 to 4095
to output rendering pixel values ranging from 0 to 255.
-
The last operation performed by the rendering module 340 is the
encoding of the output pixel values for use with an output image device. Most
output image devices are calibrated to accept pixel data with a known implied
relationship. For example, some digital image printers are calibrated to accept
visual lightness related pixel data while other devices are calibrated for optical
density related pixel data. The encoding operation performs an intensity
transformation that prepares the pixel data for the specific device.
-
The rendering module 340 can also perform the operation of
preparing the image pixel data of the enhanced digital image for an unspecified
output image device. For example, the pixel data can be transformed into CIE
XYZ coordinates such as defined by the International Image Consortium's Profile
Connection Space.
-
Referring to FIG. 2, the chain of image processing modules is
designed to work well with or without the inclusion of the tone scale module 330.
The scene balance module 320 accommodates exposure and illumination system
variability. The rendering module 340 prepares the image data for viewing on an
output image device. It will be appreciated by those skilled in the art that the
digital image processor 20 as depicted in FIG. 2 without the use of the tone scale
module 330 will yield acceptable photographic results. That is, the contrast,
lightness, and color reproduction of the system are set for optimal photographic
results for the majority of typical digital images. The inclusion of the tone scale
module 330 enhances the appearance of the processed digital images such that
digital images that deviate from the norm, in terms of dynamic range, will be
tonally enhanced and digital images that are at the norm for the system will be
unaltered by the tone scale module 330. For a typical implementation of the
present invention, the dynamic range of the original digital images 101 (ratio of
corresponding original scene intensities based on the extremes of the image) is
approximately 64 to 1. The enhanced digital images corresponding to processed
original digital images 101 that have approximately a 64 to 1 dynamic range will
be little affected by the tone scale module 330. Conversely, the enhanced digital
images corresponding to processed original digital images 101 that have a
dynamic range greater than 64 to 1 and less than 64 to 1 can be significantly
enhanced by the tone scale module 330, that is, rendered with more detail and
more color saturation. In particular, low contrast original digital image will, in
general, experience a contrast gain, while high contrast original digital images
will, in general, experience a reduction in contrast resulting in more spatial detail
and more saturated color.
-
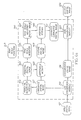
The tone scale module 330 depicted in FIG. 2 is illustrated in more
detail in FIG. 4. The source digital image 102 is received by the analysis image
generator 250, which produces a lower spatial resolution digital image from
source digital image 102 called the analysis digital image 201. The tone scale
function generator 230 receives the analysis digital image 201, analyzes the
content of the analysis digital image 201, and produces the tone scale function
203. The tone scale function is a single valued function that is defined for the
range of pixel values in the source digital image 102. The tone scale function
applicator 240 applies the tone scale function 203 to the source digital image 102
to generate the enhanced digital image 104. The shape of the tone scale function
determines the contrast and lightness changes that will be imparted to the
enhanced digital image 104.
-
The tone scale function applicator 240 shown in FIG. 4 is shown in
more detail in FIG. 5. The tone scale function classifier 241 receives and
analyzes the tone scale function 203. The tone scale function 203 is classified
into one of two or more categories based on the effect the tone scale function will
have on the numerical range of pixel values of a processed digital image. In a
preferred embodiment, the tone scale function 203 is classified as a compressive
function or an expansive function. The tone scale function 203 is classified as a
compressive function if the range of output numerical pixel values is less than the
range of input numerical pixel values. Conversely, the tone scale function 203 is
classified as an expansive function if the range of output numerical pixel values is
greater than the range of input numerical pixel values. The tone scale function
classifier also receives an input digital image 401. If the tone scale function 203
is classified as a compressive function, the input digital image 401 and the tone
scale function 203 are directed to the compressive function applicator 242.
Similarly, if the tone scale function 203 is classified as an expansive function, the
input digital image 401 and the tone scale function 203 are directed to the
expansive function applicator 242. Therefore, either the compressive function
applicator 242 or the expansive function applicator 244 is used to process the
input digital image 401 to produce the output digital image 409 which is the
enhanced digital image 104 shown in FIG. 4. In particular, the compressive
function applicator 242 uses the tone scale function 203, the input digital image
401, and a spatial filter to generate an output digital image 409 when the tone
scale function 203 has been classified as compressive, and the expansive function
applicator 244 uses the tone scale function 203 and the input digital image 401
without a spatial filter to generate the output digital image 409 when the tone
scale function 203 has been classified as expansive.
-
While the present invention can be used with any method of
generating a tone scale function, the preferred embodiment uses tone scale
functions that are constructed from two tone scale segments. However, regardless
of the tone scale function construction method, the tone scale function is classified
as either compressive or expansive. The present invention can be used with any
tone scale function classification method. For example, the average slope of the
tone scale function 203 can be calculated and compared with a pre-determined
threshold value. If the average slope is greater than the pre-determined threshold
the tone scale function 203 is classified as an expansive function. Otherwise the
tone scale function 203 is classified as a compressive function.
-
The preferred embodiment of the present invention uses a
histogram based method for determining the tone scale function classification.
The input digital image 401 is analyzed by calculating a histogram function of the
luminance pixel information, that s, a frequency of occurrence function. The
cumulative 1.0 and 99.0 fixed percentile luminance pixel values are calculated
from the histogram function and denoted by P1 and P99 respectively. The value of
the corresponding output pixel values produced with the tone scale function 203
are recorded as T1 and T99 respectively. The tone scale function 203 is classified
as a compressive function if the difference between T99 and T1 is less than or
equal to the difference between P99 and P1. Otherwise the tone scale function 203
is classified as an expansive function. Other classification rules can also be used
to classify the tone scale function 203. For example, the tone scale function 203
can be classified as expansive only if the ratio of the difference between the T99
and T1 relative to the difference between the difference between P99 and P1
exceeds a predetermined threshold value.
-
The compressive function applicator 242 shown in FIG. 5 is shown
in more detail in FIG. 6a. The LCC conversion module 210 receives the input
digital image 401 in the form of a red-green-blue image representation and
generates a luminance digital image 107 and a chrominance digital image 109. A
pedestal generation module 410 receives the luminance digital image 107 and
produces the pedestal digital image 403. The pedestal generation module 410
employs a spatial filter, applied to the luminance digital image 107, that removes
texture from the luminance digital image 107 but leaves edge information. In the
context of the present invention, texture refers to image content including fine
spatial detail and spatial shading structure. As a natural consequence of the filter,
noise is also removed. Thus the pedestal digital image 403 is a highly smoothed
version of the luminance digital image 107 with much of the edge content of the
luminance digital image 107. The pedestal digital image 403 is subtracted from
the luminance digital image 107 by a difference module 420 resulting in a texture
digital image 402. It will be appreciated that all of the information of the
luminance digital image 107 is contained between the pedestal digital image 403
or the texture digital image 402. The tone scale modifier 430 applies the tone
scale function 203 directly to the pixels of the pedestal digital image 403 resulting
in the tone adjusted digital image 407. Therefore, the tonal characteristics of the
pedestal digital image 403 are enhanced by the application of the tone scale
function 203 without affecting the texture content of the luminance digital image
107. An addition module 440 combines the tone adjusted digital image 407 with
the texture digital image 402 to produce the enhanced luminance digital image
113. Therefore, the enhanced luminance digital image 113 is a tone scale
enhanced version of the luminance digital image 107 that has the texture image
structure content of the luminance digital image 107. A RGB conversion module
220 receives the enhanced luminance digital image 113 and the chrominance
digital image 109 and produces the output digital image 409.
-
Applying a tone scale function by using a spatial filter is
particularly advantageous when the tone scale function is compressive. When
compressive tone scale functions are applied directly to an input digital image, the
tonal characteristics will be enhanced but the texture image structure can be
diminished in magnitude. Using a spatial filter to apply the tone scale function
can achieve the desired tone scale enhancement while maintaining the texture
image structure. A variety of spatial filters can be used to achieve an improved
result. The present invention uses the spatial filter disclosed in commonly-assigned
US-A-6,317,521 by Gallagher and Gindele which employs the use of a
control, or masking, signal to preserve the edges in the pedestal digital image 403.
In this method, the spatial filter produces a first signal containing predominantly
low-pass spatial frequency information (the pedestal digital image 403) and
second signal containing predominantly high-pass spatial frequency information
(the texture digital image 402) from the luminance digital image channel such that
when the first and second signals are added together the resultant signal would be
equal to the luminance digital image channel. This separation of signals is
accomplished with a non-linear operation that modifies the spatial filtering based
on detecting edges within a low-pass frequency version of the luminance
information. The tone scale function 203 is then applied to the first signal to
produce a modified first signal. The modified first signal is then combined with
the second signal to produce a modified luminance digital image channel.
-
The present invention can also be used with a similar method
disclosed by Lee in commonly-assigned US-A-6,285,798. Another spatial filter
that can be employed is a simple low-pass filter, such as a two dimensional
Gaussian filter. However, if a low-pass filter is used, the dimension of the
Gaussian standard deviation parameter should be very large, for example, one
quarter of the dimension of the digital image being processed.
-
It should also be noted that the input digital image 401 input to the
compressive function applicator 242 can be processed with the spatial filtering
technique directly in a red-green-blue image representation. For this embodiment,
the red, green, and blue color digital image channels of the input digital image
401 are spatially filtered individually using the spatial filter described above to
produce a first and second signal for each digital image channel. The first and
second signal for each digital image channel when added together result in a
signal equal to the unfiltered digital image channel. The tone scale function 203
is then applied to the first signal corresponding to each digital image channel to
produce a modified first signal. The modified first signal from each digital image
channel is then combined with the corresponding second signal to produce a
modified digital image channel of each color wherein the modified digital image
channels constitute the enhanced digital image 104.
-
The expansive function applicator 244 shown in FIG. 5 is shown in
more detail in FIG. 6b. The LCC conversion module 210 receives the input
digital image 401 in the form of a red-green-blue image representation and
generates a luminance digital image 107 containing one digital image channel and
a chrominance digital image 109 containing two chrominance digital image
channels. The tone scale modifier 430 applies the tone scale function 203 directly
to the pixels of the luminance digital image 107 resulting in the enhanced
luminance digital image 113. Therefore, the tonal characteristics of the
luminance digital image 107 are enhanced by the application of the tone scale
function 203 while also amplifying the texture content of the luminance digital
image 107. A chrominance modifier 432 receives the tone scale function 203, the
luminance digital image 107, and the chrominance digital image 109 and
amplifies the chrominance pixel values in accordance with the tone scale function
203 to produce the enhanced chrominance digital image 114. The enhanced
luminance digital image 113 and the enhanced chrominance digital image 114 are
combined by the RGB conversion module 220 to produce the output digital image
409. Those skilled in the art will recognize that the present invention can be
practiced with digital images in other representations, such as but not limited to, a
CMYK (cyan, magenta, yellow, black) image representation. A luminance-chrominance
representation of a CMYK digital image could have one luminance
digital image channel and three chrominance digital image channels.
-
The chrominance modifier 432 (shown in FIG. 6b) first calculates
a slope function s() for the received tone scale function 203. Next a chrominance
amplification factor (α) is calculated for each luminance pixel value (λ) given
expression (1)
α(λ) = µ (s(λ) - 1.0) + 1. 0
where the parameter µ regulates the degree of chrominance amplification. For
example, if the parameter µ is set to 1.0, the chrominance pixel values will be
amplified by the same degree as the luminance pixel values. That is, the
luminance contrast is increased by the same percentage as the color contrast. If
the µ parameter is set to zero, the chrominance pixel values will remain the same
and there will be no color contrast amplification. Through experimentation, the
preferred value for the µ parameter has been determined to be 0.5. By setting the
µ parameter to 0.5, low contrast images can be enhanced by an expansive tone
scale function without excessively amplifying the color. This is particularly
useful for enhancing low contrast images that contain faces.
-
For digital imaging applications that require or desire a high degree
of chrominance amplification (approximately equivalent to using parameter µ =
1.0 in Equation (1) above), an alternative embodiment of the expansive function
applicator can be used. For this alternative embodiment, the tone scale modifier
430 receives the input digital image 401 directly in a red-green-blue image
representation and produces the output digital image 409 by applying the tone
scale function 203 to each color channel of the input digital image. With this
embodiment, when the tone scale function has been classified as compressive, the
tone scale function is preferable applied to one color channel of the digital image.
However, when the tone scale function is classified as expansive, then the tone
scale function is applied to each of the channels of the digital image.
-
A LCC module 210 shown in FIG. 6a and FIG. 6b employs a 3 by
3 element matrix transformation to convert the red, green, and blue pixel values of
the source digital image 102 into luminance and chrominance pixel values. Let
the variables Rij, Gij, and Bij refer to the pixel values corresponding to the red,
green, and blue digital image channels located at the ith row and jth column. Let
the variables Lij, GMij, and ILLij refer to the transformed luminance, first
chrominance, and second chrominance pixel values respectively of an LCC
representation digital image. The 3 by 3 elements of the matrix transformation
are described by (2).
Lij = 0.333 Rij + 0.333 Gij + 0.333 Bij
GMij = -0.25 Rij + 0.50 Gij - 0.25 Bij
ILLij = -0.50 Rij + 0.50 Bij
-
The RGB conversion module 220 shown in FIG. 6a and FIG. 6b
employs a 3 by 3 element matrix transformation to convert the luminance and
chrominance pixel values into red, green, and blue pixel values by performing the
inverse matrix operation to the LCC conversion module 210. The matrix
elements of the RGB conversion module are given by (3) and represents the
inverse matrix of the matrix given by (1).
Rij = Lij - 0.666 GMij - ILLij
Gij = Lij + 1.333 GMij
Bij = Lij - 0.666 GMij + ILLij
-
The tone scale function generator 230 shown in FIG. 4 is described
in more detail hereinbelow. The tone scale function generator 230 can be used in
either an automatic mode, wherein the tone scale function 203 is calculated using
the pixels of the analysis digital image 201, or in a manual mode, wherein the
tone scale function 203 is calculated using user input selections 231 provided via
a graphical user interface.
-
The tone scale function 203, is a single valued function, that is, one
output pixel value for each input pixel value, defined for the range of pixels
values in the source digital image 102. The shape of the tone scale function 203
is important since the shape determines the effect on the processed digital images.
The tone scale function 203 is constructed from two function segments wherein
the two function segments share just one input pixel value in common. A
reference gray point pixel value corresponding to an 18% scene reflector is
defined as the input pixel value in common that divides the function domain into
the two tone scale segments. The function segment relating to the brighter image
regions, that is, image regions corresponding to bright regions of the original
photographed scene, is called the highlight tone scale segment. The function
segment relating to the darker image regions, that is, image regions corresponding
to dim regions of the original photographed scene, is called the shadow tone scale
segment. It should be noted that the tone scale function 203 is a continuous
function insofar as the implementation in computer software and/or hardware will
allow. It should also be noted that the tone scale function 203 can have a
continuous first derivative.
-
An important aspect of the construction of the tone scale function
203 is the use of a different mathematical function for two different tone scale
segments. Using a different mathematical function for each tone scale segment
allows the tone scale function 203 to be independently controllable in each of the
tone scale segments allowing for a greater degree of customization for the digital
image to be processed.
-
The pixel polarity of a digital image used in a digital imaging
system is an arbitrary decision made by the system architect. For example,
positive pixel polarity digital images have pixels wherein higher numerical values
relate to more light having been received. Conversely, negative pixel polarity
digital images have pixels wherein higher numerical values relate to less light
having been received. The present invention can be used with digital images of
either pixel polarity. However, in the interest of clarity, the following description
will assume a positive pixel polarity convention. Those skilled in the art will
recognize that references made to the increasing or decreasing function slope
values are with respect to positive pixel polarity digital images. The description
of function slope characteristics must be reversed for systems using negative pixel
polarity digital images. This is an important aspect of interpretation since
mathematically an increasing or decreasing function is defined with respect to
numerically increasing abscissa values. For example, in the description of the
construction of the highlight and shadow component functions given hereinbelow,
some shadow component functions are described as having a monotonically
increasing slope property while some highlight component functions are described
as having a monotonically decreasing slope property. This description is with
regard to a positive pixel polarity convention. For a negative pixel polarity
convention, the equivalent shadow component functions would be described as
having a monotonically decreasing slope property while the equivalent highlight
component functions would be described as having a monotonically increasing
slope property. Similarly, for a positive pixel polarity convention, the tone scale
function has a slope function that is always greater than or equal to zero.
Conversely, or a negative pixel polarity convention, the tone scale function can
have a slope function that is always less than or equal to zero.
-
The highlight tone scale segment is constructed from one or more
component functions some of which satisfy the following constraints: 1) the
component function can have a monotonically decreasing slope function for all
input pixel values equal to or greater than the reference gray point, and 2) the
component function can have a monotonically increasing function value for all
input pixel values equal to or greater than the reference gray point and less than or
equal to a maximum input pixel value expressed in the digital image. At the
reference gray point, the two tone scale function segments can have the same
value. A function is monotonic over a given domain if the function has constant
sign (for digital implementations the slope function is taken as a reasonable
approximation of the first derivative function). It should also be noted that the
function characteristics for input pixel values greater than what is expressed in a
particular image is an academic issue since no pixels will be affected. Both of the
above mentioned constraints are important and require some explanation.
-
The highlight tone scale segment relates to the bright pixels, that is,
pixels relating to more light having been received. In general, for high dynamic
range digital images the corresponding rendered digital images produced without
the present invention have little or no spatial detail in the very brightest image
regions. This is a consequence of the overall high system contrast required to
pleasingly render digital images of average dynamic range. Therefore, for high
dynamic range digital images some of the image content contained in the bright
pixels cannot be rendered such that spatial detail modulation is preserved in the
rendered digital image 103. Improved spatial detail modulation can be achieved
if the tone scale function 203 maps high input pixel values to lower output pixel
values. This results in processed digital images with darker highlight content in
the resultant rendered digital image 103. There are many functions that can
perform such an input to output mapping operation. However, monotonically
increasing functions have been experimentally determined to be more robust, that
is, produce fewer image artifacts, than functions that are not monotonic.
-
While many monotonic functions can achieve the operation of
mapping high input pixel values to lower output pixel values, all functions impose
some form of compromise in contrast with regard to image regions corresponding
to different average pixel values. In particular, the instantaneous slope value (first
derivative) of the component functions used to construct the highlight tone scale
segment can significantly affect the perception of contrast and spatial detail
modulation in the resultant rendered digital image 103. Therefore, the highlight
tone scale segment constructed using component functions having a
monotonically decreasing instantaneous slope value can improve the rendering of
spatial detail modulation for bright image regions by mapping highlight pixels to
lower output pixel values. Image regions corresponding to higher instantaneous
slope values within the domain of the highlight tone scale segment tend to
preserve more image detail modulation. Thus the monotonically decreasing
instantaneous slope condition advantages image content corresponding to pixel
values that are numerically closer in value to the reference gray point. In general,
important image content, such as the main subject region, tends to be numerically
closer to the reference gray point while background image content tends to be
exhibited more uniformly with regard to pixel values.
-
Similarly, the shadow tone scale segment is constructed from one
or more component functions some of which satisfy the following constraints: 1)
the component function can have a monotonically increasing slope function for all
input pixel values equal to or less than the reference gray point, and 2) the
component function can have a monotonically increasing function value for all
input pixel values equal to or less than the reference gray point and greater than or
equal to a minimum input pixel value expressed in the digital image. Similarly,
the monotonicity property of the component functions used to construct the
shadow tone scale segment relates to more robust image quality results. The
monotonically increasing slope function property of the component functions used
to construct the shadow tone scale segment is similarly important since this
condition also advantages image content corresponding to pixel values that are
numerically closer in value to the reference gray point. For high dynamic range
images, the monotonically increasing slope function property of the component
functions used to construct the shadow tone scale segment achieves a low input
pixel value to higher output pixel value mapping operation. This results in
processed digital images with lighter shadow content in the resultant rendered
digital image 103.
-
A natural consequence of the above mentioned slope function
constraints produces tone scale functions that have high slope function values at
the reference gray point. Therefore the choice of the reference gray point value is
important since it determines which regions in images will experience high slope
function values. A reference gray point value corresponding to an 18% gray
scene reflector is chosen since it represents approximately the midpoint of
perceptual lightness. Other choices for the value of the reference gray point can
also produce excellent results. Reasonable values for the reference gray point
range from a 10% scene reflector value to a 25% scene reflector value.
-
In a first embodiment of the tone scale function generator 230
shown in FIG. 4, either the highlight or the shadow tone scale segment is
constructed using a single component function based on exponential functions.
The component function used for the highlight tone scale segment is given by the
formula (4)
f h1(x) = β h1 (1 - e -(x-xρ)/αh1 ) + x ρ
where xρ represents the reference gray point, and βh1 and αh1 are numerical
constants that determine the shape and slope of the component function f h1 (x).
The component function used for the shadow tone scale segment is given by the
formula (5)
f s1(x) = βs1(1 - e -(x-x ρ)/αs1 ) + x ρ
where βs1 and αs1 are numerical constants that similarly determine the shape and
slope of the component function f s1(x). If a slope constraint of 1.0 is imposed at
the reference gray point, the constants βh1 and βs1 are equal to αh1 and αs1
respectively. For this condition, the equations for the functions f h1(x) and f s1(x)
are given as (6) and (7)
f h1(x) = αh1(1 -e -(x - x ρ)/αh1 ) + x ρ
f s1(x) = αs1 (1 - e-(x-x ρ)/αs1 ) + x ρ
and the expression for the tone scale function 203 T(x) is given by (8).
T(x) = f h1(x) for x>= xρ
T(x) = f s1(x) for x<xρ
-
The highlight component function is constrained to pass through a
specified coordinate point defined by an abscissa value x ho that results in an
ordinate value x w as given by (9).
x w = αh1 (1 - e -(x ho-x ρ)/αh1 ) + xρ
This constraint achieves a highlight white point mapping objective. For the
highlight component function, the white point value xw is predetermined based on
the pixel value that is preferably mapped by the rendering function R(x) to
correspond to a photographic white paper density of approximately 0.2. With the
variables x w and x ρ defined, the value of the variable αh1 can be solved for a given
value of x ho using expression (9) by an iterative numerical solution. Similarly, the
shadow component function is constrained to pass through a specified coordinate
point defined by an abscissa value x so that results in an ordinate value x b as given
by (10).
x b = αs1 (1 - e -(x so - x ρ)/αs1 ) + x ρ
This constraint achieves a shadow black point mapping objective. For the shadow
tone scale function, the black point value x w is predetermined based on the pixel
value that is preferably mapped by the rendering function R(x) to correspond to a
photographic black paper density of approximately 2.0. Generally speaking, the
aforementioned white point value and dark point value represent first and second
predetermined target densities or code values. While these target densities have
been described with reference to density measurements of photographic paper,
those skilled in the art will recognize that the same approach may be used even if
the output device is not photographic paper (a computer monitor, for example.)
With the variables x b and x ρ defined, the value of the variable αs1 can be solved
for a given value of x so using expression (10) by the iterative numerical solution.
The iterative numerical solution for expressions (9) and (10) includes a process of
first estimating an initial value of αs1, calculating each side of the equation,
calculating an error term as the difference, inspecting the error, making an
adjustment to the estimate of αs1, and iterating the procedure until the error term
is of an acceptably low magnitude. The iterative solution results are computed for
all possible values of αs1 and stored in a LUT. The same calculations and
procedure are used to determine the value of αh1.
-
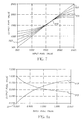
The variables x ho and x so are control variables in the expressions
(9) and (10) that, once selected, determine the function shape and slope
characteristics for expressions (6) and (7). FIG. 7 shows a graph depicting a
family of curves that represent highlight tone scale segments generated with
different values of x ho and a family of curves that represent shadow tone scale
segments generated with different values of x so. Point 500 represents the
reference gray point xρ. Curve 501 represents a highlight tone scale segment
constructed from one highlight component function. Curve 502 represents a
shadow tone scale segment constructed from one shadow component function.
Line 503 represents the one-to-one input-to-output line. For each of the highlight
tone scale segments shown in FIG. 7, the highlight component function graphed
has a monotonically decreasing instantaneous slope value. Similarly, for each of
the shadow tone scale segments shown in FIG. 7, the component function graphed
has a monotonically increasing instantaneous slope value. The variables x ho and
x so can be selected independently. Thus the shape of the two tone scale segments
can be controlled independent from one another.
-
The expressions (6) and (7) were derived with the constraint that
the slope function (corresponding to the component function), when evaluated at
the reference gray point, must be equal to 1.0. In another embodiment,
exponential functions are used in similar fashion with a slope constraint imposed.
The slope of the highlight component function must be equal to a selected value
ϕh and the shadow component function must be equal to a selected value ϕs. For
this embodiment, the imposed slope constraint results in a relationship between
the variables βh1 and αh1 in expression (4) and βs1 and αs1 in expression (5) given
by expressions (11) and (12) respectively.
βh1 = ϕh αh1
βs1 = ϕs αs1
The expressions for the highlight component function and the shadow component
function are given by expressions (13) and (14) respectively.
f h1(x) = ϕh αh1 (1 - e-(x- x ρ)/αh1 ) + x ρ
f s1(x) = ϕs αs1(1-e -(x-x ρ)/αs1 ) + x ρ
-
The first derivative functions that represent the slope function of
the highlight and shadow component functions are given by expressions (15) and
(16) respectively.
f h1'(x) = ϕhe-(x-x ρ)/αh1
f s1'(x) = ϕs e -(x-x ρ)/αs1
-
If the value of x ho is greater than the value of x w, the highlight
component function will map a greater range of input pixel values to a lesser
range of output pixel values and is therefore considered a compressive function.
Conversely, if the value of x ho is less than the value of x w, the highlight
component function will map a lesser range of pixel values to a greater range of
pixel values and is therefore considered an expansive function. Similarly, if the
value of x so is less than the value of x b, the shadow component function will map
a greater range of input pixel values to a lesser range of output pixels value and is
therefore considered a compressive function. Conversely, if the value of x so is
greater than the value of x b, the shadow component function will map a lesser
range of pixel values to a greater range of pixel values and is therefore considered
an expansive function. Therefore, based on the values of the variables x ho and x w,
the highlight tone scale segment can be classified as compressive, expansive, or
neutral. When the value x ho is equal to the value of x w, the highlight tone scale
segment is classified as neutral since for this unique condition the highlight tone
scale segment assumes the identity mapping function. Based on the values of the
variables x so and x b, the shadow tone scale segment can be classified as
compressive, expansive, or neutral. Similarly, when the value x so is equal to the
value of x b, the shadow tone scale segment is classified as neutral since for this
unique condition the shadow tone scale segment assumes the identity mapping
function.
-
For compressive highlight component functions, the numerical
constant αh1 is positive. The corresponding slope function of the highlight
component function given by expression (15) for positive values of ϕh yields
positive slope function values for all x values greater than or equal to the
reference gray point x ρ. The expression for the second derivative function, or the
slope function of the slope function of the highlight component function is given
by expression (17).
f h1"(x) = -(ϕh/αh1) e -(x-x ρ)/αh1
FIG. 8a shows an example graph of a highlight tone scale segment generated with
a ϕh variable set to 1.0, a reference gray point set to 0.0 and a αh1 variable set to
1.0. As can be seen by inspection of the graph shown in FIG. 8a and by
expression (17), positive values of αh1 and ϕh result in a compressive highlight
tone scale segment with a monotonically decreasing slope function that assumes
values that are greater than or equal to zero. Curve 512 depicts such a highlight
component function used to construct a highlight tone scale segment and curve
513 depicts its corresponding slope function. The reference gray point is
indicated by point 511.
-
Similarly, for compressive shadow component functions, the
numerical constant αs1 is negative. The corresponding slope function of the
shadow component function given by expression (16) for the positive values of ϕs
yields positive slope values for all x values less than or equal to the reference gray
point x ρ. The expression for the second derivative function, or slope function of
the slope function of the shadow component function is given by expression (18).
f s1"(x) = - (ϕs/αs1) e -(x-x ρ)/αs1
FIG. 8b shows an example graph of a shadow tone scale segment generated with a
ϕs variable set to 1.0, a reference gray point set to 0.0 and a αs1 variable set to 1.0.
As can be seen by inspection of the graph shown in FIG. 8b and by expression
(18), positive values of αs1 and ϕs result in a compressive shadow tone scale
segment with a monotonically increasing slope function that assumes values that
are greater than or equal to zero. Curve 515 depicts such a shadow component
function used to construct a shadow tone scale segment and curve 516 depicts its
corresponding slope function. The reference gray point is indicated by point 514.
-
An example tone scale function 203, shown in FIG. 8c, was
constructed from a highlight and shadow tone scale segment, each of which is
constructed from a single component function as described above. The equal
slope condition, as described above, is not a requirement of the tone scale
functions generated by the present invention. In the example tone scale function
shown in FIG. 8c, the slopes of the highlight and shadow tone scale segments are
not equal when evaluated at the reference gray point. Curve 517 represents the
tone scale function 203 and curve 518 its corresponding slope function. The
reference gray point is indicated by point 519. As can be seen in the example
graph shown in FIG. 8c, the tone scale function has a discontinuity in the slope
function at the reference gray point. Tone scale functions having continuous
slope function are, in general, desirable. However, experimentation has shown
that the discontinuity in the slope function of a tone scale function when applied
to digital images relating to natural photographed scenes is not often a problem.
Other methods for generating tone scale functions, such as described in
commonly-assigned US-A-6,285,798 have imposed a continuity of slope
constraint on the process of construction. The experimentation performed in
support of the present invention has found that the continuity of slope constraint
can be unnecessarily restrictive for some digital imaging applications. By not
imposing the continuity of slope constraint, a greater diversity of useful tone scale
functions can be produced. In particular, tone scale functions that are constructed
in a manner responsive to the pixels of the source digital image when applied to
the source digital image can achieve a greater level of overall contrast
enhancement.
-
In another embodiment, the highlight tone scale segment is
constructed from a compressive highlight component function. Recall that for
compressive highlight component functions x ho is greater than x w. For this
embodiment, the expression given by (6) is combined with a linear function
which relaxes the function's slope condition at the reference gray point. The
expression for the highlight component function is given by (19)
f h1(x) = (1 - HC)αh1 (1 - e -(x-x ρ)/αh1 ) + HC γHC (x - x ρ) + x ρ
where the variable γHC represents the average slope for the function over the
interval from x ρ to x ho and is given by expression (20).
γHC = (x w - x ρ) / (x ho - xρ )
The variable HC determines the contribution of the linear function to the highlight
component function. The variable HC can be selected to affect a change in the
shape of the highlight tone scale segments that uses expression (19) as a highlight
component function. If HC is set to 0.0, expression (19) reverts to expression (6).
If HC is set to 1.0, the expression (19) assumes a linear function given by
expression (21).
f h1(x) = γ HC (x-xρ ) + x ρ
Thus the variable HC is a control parameter that can be used to select the degree
to which the highlight component function behaves as a pure exponential
function. Similarly, the expression for the shadow component function is given
by (22)
f s1(x) = (1 - sc) αs1 (1 - e -(x-x ρ)/αs1) + sc γsc (x - x ρ) + xρ
where the variable γsc represents the average slope for the function over the
interval from x so to x ρ and is given by expression (23).
γSC = (x b - xρ )/(x so - x ρ)
The variable sc can be selected to change the shape of the shadow tone scale
segments that use expression (22) as a shadow component function. If SC is set
to 0.0, expression (22) reverts to expression (7). If sc is set to 1.0, expression
(22) assumes a linear function given by expression (24).
f s1(x) = γsc (x - x ρ) + x ρ
Thus the variable sc is a control parameter that can be used to select the degree to
which the shadow component function behaves as a pure exponential function.
-
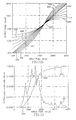
Changing the HC and sc variables can have a significant impact
on the appearance of the processed digital images. Setting the HC and SC
variables toward 0.0 results in processed digital images that have a more
traditional photographic high contrast appearance. Conversely, setting the HC and
SC variables toward 1.0 results in processed digital images that have a more
professional photographic low contrast appearance more appropriate for
portraiture. FIG. 9 shows a graph depicting a family of curves that represent
highlight tone scale segments generated with expression (19) using different
values of x ho and a family of curves that represent shadow tone scale segments
generated with expression (22) using different values of x so. Point 521 represents
the reference gray point x ρ. Curve 522 represents a highlight tone scale segment
constructed from one highlight component function. Curve 523 represents a
shadow tone scale segment constructed from one shadow component function.
Line 524 represents the identity mapping one-to-one input pixel value-to-output
pixel value line. The tone scale function 203 can be constructed from any of the
highlight tone scale segments depicted in FIG. 9 or any of the shadow tone scale
segments since the variables x ho and x so can be selected independently. It should
also be noted that if the variables HC and SC are not set to 0.0, the resultant tone
scale function will, in general, not have a continuous slope function at the
reference gray point.
-
A highlight component function constructed with expressions (4),
(6), or (13), for the case in which x ho is less than x w, will result in a function that
has a monotonically increasing instantaneous slope. An example of such a
function is depicted as curve 530 in FIG. 10a. While the function indicated by
curve 530 satisfies the mapping of input pixel value x ho to output pixel value x w, a
tone scale function based on such a function can produce some unnatural looking
images. This is mainly due to the fact that the slope of the highlight component
function depicted by curve 530 has a slope that is monotonically increasing, not
monotonically decreasing, for the input pixel range near the reference gray point.
However, a highlight component function can be constructed using the
expressions (4), (6), or (13), reflected about the line indicated as line 531 given by
(25) for input pixel values greater than or equal to the reference gray point
(indicated by point 533).
y(x) = (x w - x ρ) / (x ho - xρ ) (x - xρ ) + xρ
The function produced by the reflection process, as indicated by curve 532 in
FIG. 10a, is a monotonically increasing function with a monotonically decreasing
instantaneous slope. The functional form of the expansive highlight component
function is calculated by the following steps. First the expression (4), (6), or (13)
is solved using the constraint x ho = x w to determine the numerical constant αh1. In
the second step, a first rotation transform is applied to a coordinate pair (x,f(x))
resulting in a transformed coordinate pair (u,v) as given by (26)
u = x cos() + f(x) sin()
v = -x sin() - f(x) cos()
where the angle is given by (27).
= tan-1((x w - xρ )/(x ho - xρ ))
The first rotation transform is designed to transform the line described by
expression (24) into the x-axis. In the third step the v coordinate is reflected
about the new x-axis by taking the negative of the value v coordinate. In the
fourth step, a reverse rotation transform is applied to the coordinate pair (u, -v)
for the coordinate pair (u',v') as given by (28).
u' = u cos() + v sin()
v' = x sin() - v cos()
In the fifth step, the coordinate pair (u',v') defines a highlight component function
g(u) and is evaluated for the range of input pixel values.
-
Referring to FIG. 10b, an expansive shadow component function
can be constructed in similar manner as described above for the case in which x so
> x b. The shadow component function can be constructed using the function
described by (5), (7), or (14), reflected about the line indicated as line 535 given
by (29) for input pixel values less than or equal to the reference gray point
(indicated by point 534) using the constraint x so = x b to determine the numerical
constant αs1.
y(x) = (x b - xρ ) / (x so - x ρ) (x - xρ ) + xρ
The curve indicated by 536 depicted in FIG. 10b shows a function using (5), (7),
or (14) for a positive numerical constant αs1. The corresponding expansive
shadow component function produced via the reflection processing steps is
indicated by curve 537.
-
An example graph of a tone scale function constructed from an
expansive highlight tone scale segment and an expansive shadow tone scale
segment constructed with the component functions described above is shown in
FIG. 10c. Since both the highlight and shadow tone scale segments are
expansive, the tone scale function, indicated by curve 539, is classified as an
expansive function over the range of input pixel values from x so to x ho. The
combined linear functions given by expressions (25) and (29) are shown as line
540 with the reference gray point as indicated by point 538. The tone scale
function depicted in FIG. 8c as curve 517 is classified as a compressive function
over the range of input pixel values from x so to x ho since both the highlight and
shadow tone scale segments used in its construction are compressive component
functions. The reference gray point is indicated by point 538.
-
It is possible to construct a tone scale function from an expansive
shadow component function and a compressive highlight component function or
from a compressive shadow component function and an expansive highlight
component function since the shape of the two tone scale segments are
independently controllable. Such a tone scale function is referred to herein as an
eclectic function since the two segments are of different shape classification.
While is would be possible to have a tone scale applicator module specific to the
eclectic function classification category, the present invention uses the
compressive function applicator 242 to apply the tone scale function 203 for
eclectic functions. Thus, the eclectic functions are reclassified as compressive
functions. For tone scale functions constructed from a highlight and shadow tone
scale segment, the present invention classifies the tone scale function 203 as
compressive if either tone scale segment individually has been classified as
compressive. Otherwise the tone scale function 203 is classified as expansive. It
should be noted that other classification rule sets can be used. For example, the
eclectic tone scale functions can be classified as expansive tone scale functions.
-
In a preferred embodiment, the expansive highlight component
function f h1(x) is constructed using the expression (4) subject the constraints given
by (30) and (31).
f h1(x ho') = x w
f h1'(x w) = 1.0
where the variable x ho' is given by the expression (32)
f h1(x ho') = (1.0 - ηH) (x w - x ho) + x ho
and the variable ηH represents a control parameter that can be used to select the
shape of the function. With these two constraints placed on the function f h1(x),
the highlight component function achieves the goal of mapping the prescribed
input pixel value x ho' to the prescribed output pixel value x w. The average slope
of the function γHE over the interval from x ρ to x ho' is given by the expression (33)
γHE = (x w - x ρ)/(x ho' - x ρ)
which is greater than 1.0 since x w is greater than x ho'. In a similar manner as
described above, the variables αh1 and βh1 used in the expression (4) are solved by
iterative numerical approximation and stored in a LUT for later recall. The
variable ηH is preferably set to 0.5. As a further refinement, the highlight
component function is combined with a linear function using a control parameter
HE. The final expression for the expansive highlight component function is given
by (34).
f h1(x) = (1 - HE) αh1 (1 - e -(x-x ρ)/αh1 ) + HE γHE + xρ
-
Similarly, the expansive shadow component function f s1(x) is
constructed using the expression (5) subject the constraints given by (35) and
(36).
f s1(x so') = x b
f s1'(x b) = 1.0
where the variable x so' is given by the expression (37)
f s1(x so') = (1.0 - ηs) (x b - x so) + x so
and the variable ηs represents a control parameter that can be used to select the
shape of the function. With these two constraints placed on the function f s1(x), the
shadow component function achieves the goal of mapping the prescribed input
pixel value x so' to the prescribed output pixel value x b. The average slope of the
function γSE over the interval from x so' to xρ is given by the expression (38)
γSE = (x ρ- x b)/(x ρ - x so')
which is greater than 1.0 since x b is less than x so'. In a similar manner as
described above, the variables αs1 and βs1 used in the expression (5) are solved by
iterative numerical approximation and stored in a look-up-table (LUT) for later
recall. The variable ηs is preferably set to 0.5. As a further refinement, the
shadow component function is combined with a linear function using a control
variable SE. The final expression for the expansive shadow component function
is given by (39).
f s1(x) = (1 - SE) αs1 (1 - e -(x-x ρ)/αs1 ) + SE γSE + xρ
FIG. 11 depicts a family of highlight and shadow tone scale segments each
generated from a single expansive component function using expressions (34) and
(39) respectively. Point 541 represents the reference gray point xρ. Line 542
represents the identity mapping one-to-one input pixel value-to-output pixel value
line. Curve 543 represents an example a highlight tone scale segment using
expression (34). Curve 544 represents an example shadow tone scale segment
using expression (39).
-
An important feature of the tone scale segments constructed with
the two-segment method is the gradual transition in function shape corresponding
to a transition from compressive to expansive type functions. FIG. 12a depicts a
family of highlight tone scale segments constructed from a single highlight
component function using expression (19) when the component function is
compressive and expression (34) when the component function is expansive.
Point 549 indicates the reference gray point. Curve 550 indicates a highly
compressive highlight component function while curve 551 indicates a mildly
highlight component function. The higher the degree of compression, the greater
the curvature of the function. When the highlight component function is neither
compressive nor expansive, the function assumes the identity mapping one-to-one
input-to-output line indicated by curve 552. Curve 553 indicates a mildly
expansive highlight component function. Curve 554 indicates a highly expansive
highlight component function. The higher the degree of expansion, the greater
the curvature of the function. Thus for mildly compressive and mildly expansive
highlight component functions, the shape of the function is closer to a straight
line. For the compressive highlight component functions used to construct the
highlight component segments as shown in FIG. 12a a value of 0.0 was used for
the variable HC. For the expansive highlight component functions used to
construct the highlight component segments shown in FIG. 12a a value of 0.0 was
used for the variable HE. It should be noted that the value of the HC variable
used in expression (19) can be selected independent of the value of the HE
variable used in expression (34).
-
The shape of the shadow tone scale segments also have a graceful
transition between compressive and expansive function types. FIG. 12a also
depicts a family of shadow tone scale segments constructed from a single shadow
component function using expression (22) when the component function is
compressive and expression (39) when the component function is expansive.
Curve 555 indicates a highly compressive shadow component function while
curve 556 indicates a mildly shadow component function. The higher the degree
of compression, the greater the curvature of the function. When the shadow
component function is neither compressive nor expansive, the function assumes
the identity mapping one-to-one input-to-output line indicated by line 557. Curve
558 indicates a mildly expansive shadow component function. Curve 559
indicates a highly expansive shadow component function. The higher the degree
of expansion, the greater the curvature of the function. Thus for mildly
compressive and mildly expansive shadow component functions, the shape of the
function is closer to a straight line. For the compressive shadow component
functions used to construct the shadow component segments as shown in FIG. 12a
a value of 0.0 was used for the variable SC. For the expansive shadow
component functions used to construct the shadow component segments shown in
FIG. 12a a value of 0.0 was used for the variable SE. It should be noted that the
value of the SC variable used in expression (22) can be selected independent of
the value of the SE variable used in expression (39).
-
FIG. 12b depicts a similar family of highlight and shadow tone
scale segments constructed using expressions (19), (34), (22) and (39) with the
values of the variables HC, HE, SC, and SE all set to a value of 0.5. As can be
seen from the curves depicted in FIG. 12b, the tone scale segments make a
gradual transition in function shape for a corresponding transition from
compressive to expansive type functions.
-
In another construction method for a compressive highlight
component function, the variable ϕh is made a function of the degree of
compression, that is, the ratio of (x w - xρ ) to (x ho - x ρ). The expression for the
highlight component function f h1(x) is given by (13) where the slope variable ϕh
in expression (13) is given by (40)
ϕh = 1.0 - ηh (1.0 - (x w / x ho))
and the variable ηh controls the shape of the highlight component function. The
variable ηh can be selected. When the variable ηh is set to 1.0, the highlight
component function assumes the equation of a line given as expression (21).
When the variable ηh is set to 0.0, the highlight component function assumes the
equation of the exponential function given as expression (13). Similarly, for a
compressive shadow component function, the variable ϕs is made a function of
the degree of compression, that is, the ratio of (x ρ - x b) to (xρ - x so). The
expression for the shadow component function f s1(x) is given by (14) where the
slope variable ϕs in expression (14) is given by (41)
ϕs = 1.0 - ηs (1.0 - (x b/x so))
and the variable ηs controls the shape of the shadow component function. When
the variable ηs is set to 1.0, the shadow component function assumes the equation
of a line given as expression (24). When the variable ηs is set to 0.0, the shadow
component function assumes the equation of the exponential function given as
expression (14).
-
Referring to FIG. 4, the pixels of the source digital image, that is,
the input digital image to the tone scale module 330, can be used to determine the
variables x ho and x so and thus determine the shape of the tone scale function. The
analysis image generator 250 receives the source digital image and produces an
analysis digital image 201 by applying a low-pass spatial filter and performing a
sampling operation. The result is a lower spatial resolution version of the source
digital image that has fewer pixels representing the same image content. Typical
spatial resolutions for the analysis digital image 201 is approximately 64 by 96
pixels. The analysis digital image is also converted to be in a luminance-chrominance
representation using expression (2).
-
The tone scale function generator 230 calculates the tone scale
function 203 by analyzing the pixels of the analysis digital image 201. A pixel
histogram function, that is, a frequency of occurrence function, is calculated from
the pixels of the luminance digital image channel of the analysis digital image
201. A cumulative histogram function is calculated from the pixel histogram
function by integrating the values of the pixel histogram as a function of pixel
value. FIG. 14 shows a graph of an example histogram function indicated by
curve 601 and its corresponding cumulative histogram function indicated by curve
602. The cumulative histogram function is scaled between 0.0 and 1.0 and relates
to the percentage area of the digital image with 1.0 corresponding to 100 percent
of image area. The ordinate value of the cumulative histogram function relates to
a given percentage image area Z. The corresponding abscissa value relates to the
pixel value P for which the percentage of pixels in the image that have values less
than P is given by Z. The 99.0% cumulative histogram function value is used to
determine the value of the highlight point, variable x ho. The 1.0% cumulative
histogram function value is used to determine the value of the shadow point,
variable x so. The values for the variables x ho and x so are indicated as points 603
and 604 respectively on the graph shown in FIG. 14.
-
Referring to FIG. 3 and FIG. 4, the tone scale function generator
230 can accept user input selections 231 in the generation of the tone scale
function 203. For example a user of the system shown in FIG. 1 can view
possible selections and/or control parameters on the monitor device 50 and
indicate selections using the input control device 60 such as a keyboard or mouse
pointing device. When used in this manual user mode, a highlight control
parameter and a shadow control parameter are used to change the shape of the
component functions that are used to generate the highlight tone scale segment
and shadow tone scale segment respectively.
-
The present invention is preferably practiced in an image
processing system including a source of digital images, such as a scanner, a
computer programmed to process digital images, and an output device such as a
thermal or ink-jet printer. The method of the present invention may be sold as a
computer program product including a computer readable storage medium bearing
computer code for implementing the steps of the invention.
-
Computer readable storage medium may include, for example;
magnetic storage media such as a magnetic disc (for example, a floppy disc) or
magnetic tape; optical storage media such as optical disc or optical tape; bar code;
solid state electronic storage devices such as random access memory (RAM) or
read only memory (ROM); or any other physical device or medium employed to
store a computer program.
-
Other features of the invention are included below.
-
The method wherein the pixel values of the source digital image
have a logarithmic relationship to original scene intensities.
-
The method wherein the tone scale function is adjusted by a user
controlling at least one parameter.
-
The method including the steps of:
- classifying the highlight tone scale segment into one of two or
more categories based on the effect the highlight tone scale segment will have on
the corresponding numerical range of pixel values, wherein the classification
categories include expansive and compressive;
- classifying the shadow tone scale segment into two or more
categories based on the effect the shadow tone scale segment will have on the
corresponding numerical range of pixel values of a processed digital image,
wherein the classification categories include expansive and compressive;
- classifying the tone scale function as compressive when either the
highlight or shadow tone scale segment has been classified as compressive and
classifying the tone scale function as expansive when both the highlight and
shadow tone scale segments have been classified as expansive.
-
-
The method wherein the slopes of the highlight and shadow tone
scale segments are each equal at the reference point.
-
The method wherein the slopes of the highlight and shadow tone
scale segments are unequal at the reference point.
-
The method wherein the tone scale function has an inflection point
at the reference point.
-
The method wherein the reference point is calculated using the
pixels of the source digital image.
-
The method including the step of using the pixels of the source
digital image to produce a histogram and using the histogram to produce the
highlight tone scale segment.
-
The method wherein the highlight tone scale segment maps a fixed
percentile of the histogram to a predetermined output value corresponding to a
predetermined density.
-
The method including the step of using the pixels of the source
digital image to produce a histogram and using the histogram to produce the
shadow tone scale segment.
-
The method wherein the shadow tone scale segment maps a fixed
percentile of the histogram to a predetermined output value corresponding to a
predetermined density.