EP1407233B1 - Flow diagnostic system - Google Patents
Flow diagnostic system Download PDFInfo
- Publication number
- EP1407233B1 EP1407233B1 EP02725990A EP02725990A EP1407233B1 EP 1407233 B1 EP1407233 B1 EP 1407233B1 EP 02725990 A EP02725990 A EP 02725990A EP 02725990 A EP02725990 A EP 02725990A EP 1407233 B1 EP1407233 B1 EP 1407233B1
- Authority
- EP
- European Patent Office
- Prior art keywords
- data
- diagnostic
- pressure
- flow
- pressure data
- Prior art date
- Legal status (The legal status is an assumption and is not a legal conclusion. Google has not performed a legal analysis and makes no representation as to the accuracy of the status listed.)
- Expired - Fee Related
Links
Images


Classifications
-
- G—PHYSICS
- G01—MEASURING; TESTING
- G01F—MEASURING VOLUME, VOLUME FLOW, MASS FLOW OR LIQUID LEVEL; METERING BY VOLUME
- G01F1/00—Measuring the volume flow or mass flow of fluid or fluent solid material wherein the fluid passes through a meter in a continuous flow
- G01F1/05—Measuring the volume flow or mass flow of fluid or fluent solid material wherein the fluid passes through a meter in a continuous flow by using mechanical effects
- G01F1/34—Measuring the volume flow or mass flow of fluid or fluent solid material wherein the fluid passes through a meter in a continuous flow by using mechanical effects by measuring pressure or differential pressure
- G01F1/50—Correcting or compensating means
-
- G—PHYSICS
- G01—MEASURING; TESTING
- G01F—MEASURING VOLUME, VOLUME FLOW, MASS FLOW OR LIQUID LEVEL; METERING BY VOLUME
- G01F1/00—Measuring the volume flow or mass flow of fluid or fluent solid material wherein the fluid passes through a meter in a continuous flow
- G01F1/05—Measuring the volume flow or mass flow of fluid or fluent solid material wherein the fluid passes through a meter in a continuous flow by using mechanical effects
- G01F1/34—Measuring the volume flow or mass flow of fluid or fluent solid material wherein the fluid passes through a meter in a continuous flow by using mechanical effects by measuring pressure or differential pressure
- G01F1/36—Measuring the volume flow or mass flow of fluid or fluent solid material wherein the fluid passes through a meter in a continuous flow by using mechanical effects by measuring pressure or differential pressure the pressure or differential pressure being created by the use of flow constriction
- G01F1/363—Measuring the volume flow or mass flow of fluid or fluent solid material wherein the fluid passes through a meter in a continuous flow by using mechanical effects by measuring pressure or differential pressure the pressure or differential pressure being created by the use of flow constriction with electrical or electro-mechanical indication
-
- G—PHYSICS
- G01—MEASURING; TESTING
- G01F—MEASURING VOLUME, VOLUME FLOW, MASS FLOW OR LIQUID LEVEL; METERING BY VOLUME
- G01F25/00—Testing or calibration of apparatus for measuring volume, volume flow or liquid level or for metering by volume
- G01F25/10—Testing or calibration of apparatus for measuring volume, volume flow or liquid level or for metering by volume of flowmeters
-
- G—PHYSICS
- G05—CONTROLLING; REGULATING
- G05B—CONTROL OR REGULATING SYSTEMS IN GENERAL; FUNCTIONAL ELEMENTS OF SUCH SYSTEMS; MONITORING OR TESTING ARRANGEMENTS FOR SUCH SYSTEMS OR ELEMENTS
- G05B13/00—Adaptive control systems, i.e. systems automatically adjusting themselves to have a performance which is optimum according to some preassigned criterion
- G05B13/02—Adaptive control systems, i.e. systems automatically adjusting themselves to have a performance which is optimum according to some preassigned criterion electric
- G05B13/0265—Adaptive control systems, i.e. systems automatically adjusting themselves to have a performance which is optimum according to some preassigned criterion electric the criterion being a learning criterion
- G05B13/0275—Adaptive control systems, i.e. systems automatically adjusting themselves to have a performance which is optimum according to some preassigned criterion electric the criterion being a learning criterion using fuzzy logic only
-
- G—PHYSICS
- G05—CONTROLLING; REGULATING
- G05B—CONTROL OR REGULATING SYSTEMS IN GENERAL; FUNCTIONAL ELEMENTS OF SUCH SYSTEMS; MONITORING OR TESTING ARRANGEMENTS FOR SUCH SYSTEMS OR ELEMENTS
- G05B21/00—Systems involving sampling of the variable controlled
- G05B21/02—Systems involving sampling of the variable controlled electric
-
- G—PHYSICS
- G05—CONTROLLING; REGULATING
- G05D—SYSTEMS FOR CONTROLLING OR REGULATING NON-ELECTRIC VARIABLES
- G05D7/00—Control of flow
- G05D7/06—Control of flow characterised by the use of electric means
- G05D7/0617—Control of flow characterised by the use of electric means specially adapted for fluid materials
- G05D7/0629—Control of flow characterised by the use of electric means specially adapted for fluid materials characterised by the type of regulator means
- G05D7/0635—Control of flow characterised by the use of electric means specially adapted for fluid materials characterised by the type of regulator means by action on throttling means
Definitions
- the present invention relates to fluid process control systems.
- the present invention relates to diagnostic systems for fluid flow in process control systems.
- Fluid flow meters are used in industrial process control environments to measure fluid flow and provide flow signals for flow indicators and controllers.
- Inferential flow meters measure fluid flow in a pipe by measuring a pressure drop near a discontinuity within the pipe.
- the discontinuity primary element
- the discontinuity can be an orifice, a nozzle, a venturi, a pitot tube, a vortex shedding bar, a target or even a simple bend in the pipe.
- Flow around the discontinuity causes both a pressure drop and increased turbulence.
- the pressure drop is sensed by a pressure transmitter (secondary element) placed outside the pipe and connected by impulse lines or impulse passageways to the fluid in the pipe. Reliability depends on maintaining a correct calibration. Erosion or buildup of solids on the primary element can change the calibration. Impulse lines can become plugged over time, which also adversely affects calibration.
- Disassembly and inspection of the impulse lines is one method used to detect and correct plugging of lines.
- Another known method for detecting plugging is to periodically add a "check pulse" to the measurement signal from a pressure transmitter. This check pulse causes a control system connected to the transmitter to disturb the flow. If the pressure transmitter fails to accurately sense the flow disturbance, an alarm signal is generated indicating line plugging.
- Another known method for detecting plugging is sensing of both static and differential pressures. If there is inadequate correlation between oscillations in the static and differential pressures, then an alarm signal is generated indicating line plugging.
- Still another known method for detecting line plugging is to sense static pressures and pass them through high pass and low pass filters. Noise signals obtained from the filters are compared to a threshold, and if variance in the noise is less than the threshold, then an alarm signal indicates that the line is blocked.
- WO00/50851 and US6,119,047 disclose apparatus and methods of this general type.
- the present invention provides a flow diagnostic system according to claim 1 and a method according to claim 6.
- a flow diagnostic system for coupling to a primary flow sensing element via impulse lines.
- the flow diagnostic system may include a pressure transmitter that couples to the impulse lines and generates digital pressure data representing pressure.
- a control system receives the pressure data and provides the pressure data and real time clock readings associated with pressure data to a diagnostic application stored in the flow diagnostic system.
- the diagnostic application includes a first algorithm that calculates a difference between the pressure data and a moving average of the pressure data.
- the diagnostic application also includes a second algorithm that receives the difference and calculates a trained data set of historical pressure data during a training mode and calculates a current pressure data set during a monitoring mode and then generates diagnostic data as a function of the current pressure data set relative to the historical pressure data, which indicates changes in the condition of flow sensing.
- the diagnostic application includes a third algorithm that generates a report indicating the diagnostic data.
- the diagnostic application can be provided over a network from an application service provider (ASP) or other source and can run on the control system, the ASP or another remote computer.
- ASP application service provider
- a flow diagnostic system can diagnose the condition of either the primary element or impulse lines connected to a pressure transmitter.
- a diagnostic application is downloadable over a network from an application service provider (ASP), or can be obtained from a computer-readable medium such as a CD-ROM or removable disc.
- the diagnostic application can run on the control system, a remote computer or the ASP and provide a diagnostic report.
- the diagnostic application runs on a processor that is high powered relative to the low power embedded processor found in the pressure transmitter. With the use of the high powered processor, sophisticated diagnostics can be performed in real time and provide prompt reports to a plant operator about the condition of primary elements or impulse lines or both. There is no need to use processing time on the processor imbedded in the transmitter for diagnostics, and the transmitter can perform its measurement tasks rapidly.
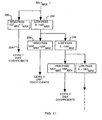
- FIG. 1 is a schematic illustration of a generalized example of a flow diagnostic system 100 that diagnoses the condition of impulse lines 104 and/or a primary flow element 106 placed in a fluid piping system 108.
- the impulse lines 104 and the primary element 106 are referred to collectively as a "pressure generator.”
- pressure generator means a primary element (e.g., an orifice plate, a pitot tube, a nozzle, a venturi, a shedding bar, a bend in a pipe or other flow discontinuity adapted to cause a pressure drop in flow) together with impulse pipes or impulse passageways that couple the pressure drop from locations near the primary element to a location outside the flow pipe.
- the spectral and statistical characteristics of this pressure presented by this defined “pressure generator” at a location outside the flow pipe to a connected pressure transmitter 82 can be affected by the condition of the primary element as well as on the condition of the impulse pipes.
- the connected pressure transmitter can be a self-contained unit, or it can be fitted with remote seals as needed to fit the application.
- a flange on the pressure transmitter 102 couples to a flange adapter on the impulse lines 104 to complete the pressure connections in a conventional manner.
- the pressure transmitter 102 couples to a primary flow element 106 via impulse lines 104 to sense flow.
- Primary element 106 is an orifice plate clamped between pipe flanges 105.
- Pressure transmitter 102 is coupled to the impulse lines 104 and provides pressure data along line 110 to a control system 112.
- Pressure transmitter 102 is preferably a differential pressure transmitter.
- Line 110 is typically a conventional 4-20 mA loop that provides all of the electrical energization for transmitter 102 and also carries digital pressure data representing the pressure sensed by pressure transmitter 102.
- Pressure transmitter 102 includes an embedded microprocessor that generates the digital pressure data, however, the computing power of the embedded microprocessor is limited by the power available from the 4-20 mA loop.
- the digital pressure data is typically transmitted in a standard industry format using a digital protocol such as HART, Foundation Fieldbus, Profibus, CAN or the like.
- Control system 112 receives the digital pressure data on line 110 and providing the pressure data and real time clock readings associated with pressure data to a diagnostic application stored in the flow diagnostic system 100.
- the diagnostic application can be a application 134 that is stored in and running on a processor in control system 112, an application 130 stored in and running on a processor at an application service provider 126, an application 132 stored in and running on a processor in a remote computer 122 or any combination of these locations. In each of these locations, relatively high power computing is available in comparison to the limited computing power available from the embedded processor in transmitter 102.
- An arrangement where the diagnostic application is stored on one computer (112, 122 or 126) and running on another one of the computers (112, 122, 126) is also contemplated.
- the diagnostic application (134, 130, 132 or a combination of 134, 130 or 132) includes a first algorithm calculating a difference between the pressure data and a moving average of the pressure data.
- the diagnostic application further includes a second algorithm receiving the difference and calculating a trained data set of historical pressure data during a training mode and calculating a current pressure data set during a monitoring mode and generating diagnostic data as a function of the current pressure data set relative to the historical pressure data indicating changes in the condition of flow sensing.
- the diagnostic application also includes a third algorithm generating a report indicating the diagnostic data.
- the report can be presented to an user at control system monitor 114, a printer 124 or monitor associated with remote computer 122 or a report 128 generated by the application service provider 126. It is appreciated that the report can take a variety of forms or displays that communicate the diagnostic data to the user.
- the control system 112 couples along line 118 to a network 116.
- Network 116 also couples along line 120 to the remote computer 122, and couples along line 127 to the application service provider 126.
- the remote computer 122 is located in the offices of the plant operator, while the line 127 is a long distance connection, typically over the internet, to an application service provider 126 at any desired location.
- the network 116 can provide the diagnostic application to the control system 112 or the remote computer 122.
- the network can also provide the pressure data and associated real time clock readings to the diagnostic application running at the remote computer 122 or the application service provider 126.
- FIG. 1 is a generalized illustration, and not all diagnostics systems include all of the features shown in FIG. 1 .
- FIG. 2 is a schematic illustration of a first embodiment of a control system 206 that is part of a flow diagnostic system such as flow diagnostic system 100 in FIG. 1 .
- Pressure transmitter 200 is coupled via impulse lines 201 to an integral orifice plate 202 in a fluid flow system. Pressure transmitter 200 couples to control system 206 along line 204.
- the pressure transmitter generates digital pressure data (P) and associated digital real time clock readings (RTC) as illustrated at 205.
- the real time clock readings provided by the transmitter 200 with each pressure reading indicate the relative time that each pressure reading is taken by the transmitter 200.
- the real time clock reading can be as simple as a sequential number for each reading.
- the real time clock reading can be an approximate time that each reading taken.
- the control system 206 receives the digital information 205 at a transmitter bus interface 208.
- Transmitter bus interface 208 formats the data properly for communication on the bus 210 that is internal to the control system 206.
- the information 205 is used by process control software 214 to couple control signals along line 215 to a valve or other control device.
- Control system 206 includes a network interface 212 that can pass the digital information 205 along to a network on line 218 in a case where the diagnostic application is not running on the control system 206. In a case where the diagnostic application is running on the control system 206, the network interface 212 can receive the diagnostic application from line 218 and format it for transmission over the bus 210.
- the network interface 212 is bidirectional.
- the control system 206 includes a processor, random access memory, non-volatile memory and I/O devices.
- FIG. 3 is a schematic illustration of a second embodiment of a control system 306 that is part of a flow diagnostic system such as flow diagnostic system 100 in FIG. 1 .
- Pressure transmitter 300 is coupled via impulse lines 301 to an integral orifice plate 302 in a fluid flow system. Pressure transmitter 300 couples to control system 306 along line 304. The pressure transmitter generates digital pressure data (P) as illustrated at 305. Transmitter 300 generates real time clock readings.
- P digital pressure data
- transmitter bus interface 308 In an instance where the transmitter 300 generates real time clock readings, these reading are coupled through transmitter bus interface 308 to real time clock circuit 318 via a bus 310 that is internal to control system 306.
- Real time clock circuit 318 then generates a corresponding synchronized real time clock reading that is synchronized with other real time clock readings in the control system 306. This synchronization allows for synchronized comparison of data from multiple transmitters, for example, in a case where differential pressure is measured using two absolute pressure transmitters.
- control system 306 includes a network interface 312 that can pass digital information (pressure data 305 and synchronized real time clock readings) along to a network on line 318 in a case where the diagnostic application is not running on the control system 306. If the network connected to line 318 is busy or otherwise unavailable, then the digital information can be temporarily stored in storage device 320 and later transmitted via the network to a diagnostic application running on a remote computer. This storage 320 can also be used in instances where it is desired to use batch processing for diagnostics.
- the network interface 312 can receive the diagnostic application from line 318 and format it for transmission over the bus 310 internal to control system 306.
- FIG. 4 is a block diagram of a diagnostic application 432 running on a remote computer 422. Pressure data and real time clock reading from a pressure transmitter are provided on line 320 from a network 316.
- a first algorithm 440 stored in computer 422 calculates a difference between the series of digital pressure data points received from network 316 and a moving average of the series of digital pressure data points. Real time clock readings associated with each digital pressure data point are used to ensure that the digital pressure data points, which may be delayed or out of order after passing through network 316, are reassembled in a correct time sequence at the input to algorithm 440.
- the difference calculated in algorithm 440 is coupled along line 442 to a second algorithm 444.
- the second algorithm 444 is also stored in the computer 422.
- the second algorithm 444 receives the difference calculated by algorithm 440 and calculates a trained data set of historical data during a training mode and calculates a current data set during a monitoring mode and generates diagnostic data 446 as a function of the current data set relative to the historical data indicating changes in the condition of the pressure generator (not illustrated in FIG. 4 ).
- a third algorithm 448 receives the diagnostic data 446 and generates a report 450 indicating the diagnostic data to a user.
- the report 450 can take forms such as a monitor display or a printed report.
- FIG. 5 is a block diagram of a diagnostic application running on a remote computer 522 that diagnoses the condition of impulse lines.
- a difference (subtract moving average) algorithm 540 receives digital pressure data from network 516 via line 520 and generates difference data on line 542 representing a sensed pressure minus a moving average of the sensed pressure.
- a calculate algorithm 552 receives the difference data from line 542 and calculates a trained output 553 of historical data obtained during a training mode or time interval. After training, calculate algorithm 554 calculates a monitor output 555 of current data obtained during a monitoring mode or normal operation time of the fluid flow meter.
- a diagnostic algorithm 556 receives the trained output 553 and the monitor output 555 and generates a diagnostic data output 558 indicating a current condition of the pressure generator relative to an historical condition.
- calculate algorithm 554 stores the historical data in memory for later use in the comparison.
- A is the moving average
- P is a series of sequentially sensed pressure values
- W is a numerical weight for a sensed pressure value
- m is a number of previous sensed pressure values in the series.
- the historical data comprises statistical data, for example, the mean ( ⁇ ) and standard deviation ( ⁇ ) of the difference output or other statistical measurements
- the diagnostic output 558 indicates impulse line plugging.
- the diagnostic application switches between a training mode when it is installed and a monitoring mode when it is in use measuring flow as illustrated by switch 550.
- the calculate algorithm 554 stores historical data in the training mode.
- the diagnostic data output 558 indicates a real time condition of the pressure generator.
- statistical data such as the mean ⁇ and standard deviation ⁇
- the corresponding sample statistical data such as sample mean X and sample standard deviation s, are calculated from a relatively smaller number of data points.
- hundreds of data points are used to calculate statistical data such as ⁇ and ⁇ , while only about 10 data points are used to calculate sample statistical data such as X and s.
- the number of data points during monitoring is kept smaller in order to provide diagnostics that is real time, or completed in about 1 second.
- Diagnostic algorithm 556 indicates line plugging if the sample standard deviation s deviates from the standard deviation ⁇ by a preset amount, for example 10%.
- FIG. 6 is a block diagram of a diagnostic application running on a remote computer 622 that diagnoses the condition of a primary flow element.
- the diagnostic application of FIG. 6 is arranged generally along the lines of the diagnostic application of FIG. 5 .
- a difference algorithm 640 receives digital pressure data from network 616 via line 620.
- the diagnostic application switches between a training mode and a monitoring mode by switch 650.
- the diagnostic output 658 indicates a condition of the primary element, while in FIG. 5 , the diagnostic output 558 indicates a condition of the impulse lines.
- calculate algorithms 652, 654 calculate and store data on power spectral density (PSD) of the difference output on line 642 rather than statistical data which is used in FIG. 5 .
- PSD power spectral density
- the power spectral density data is preferably in the range of 0 to 100 Hertz.
- the center frequency of a bandpass filter can be swept across a selected range of frequencies to generate a continuous or quasi-continuous power spectral density as a function of frequency in a manner that is well known.
- Various known Fourier transforms can be used.
- Power spectral density, Fi can also be calculated using Welch's method of averaged periodograms for a given data set.
- a front end filter with a filter frequency less than fs / 2 is used to reduce aliasing in the spectral calculations.
- Fi is thus the power spectrum sequence and i goes from 1 to N which is the total number of points in the original data sequence. N, usually a power of 2, also sets the frequency resolution of the spectrum estimation. Therefore, Fi is also known as the signal strength at the i th frequency.
- the power spectrum typically includes a large number points at predefined frequency intervals, defining a shape of the spectral power distribution as a function of frequency.
- a relatively larger sample of the spectral density at baseline historical conditions and a relatively smaller sample of the spectral density at monitoring conditions are compared.
- the relatively smaller sample allows for a real time indication of problems in about 1 second.
- An increase in the related frequency components of the power spectrum can indicate the degradation of the primary element.
- orifice plates as primary elements for example, changes as high as 10% are observed in spectral components when the orifice plate is degraded to a predetermined level.
- the amount of change can be adjusted as needed, depending on the tolerable amount of degradation and the type of primary element in use.
- the amount of change needed to indicate a problem is arrived at experimentally for each type of primary element arrangement. Fuzzy logic can also be used to compare the many points of the power spectrums.
- the pressure data is typically a calibrated output, and the diagnostic data indicates if the pressure generator is out of calibration.
- FIG. 7 is a detailed flow chart of a process diagnosing the condition of impulse lines.
- the algorithm starts at 702.
- a moving average is subtracted from differential pressure data as shown at 704 to calculate a difference.
- historical data on the calculated difference is acquired and stored at 706 as statistical data ⁇ and ⁇ , for example.
- current data on the difference is acquired and stored at 708 as statistical data X and s. The smaller sample of current data is compared to the larger sample of the historical data to diagnose the condition of the impulse lines.
- Comparisons 710 of historical and current statistical data are made at 714, 716, 718 and a selected diagnostic output is generated at 730, 732, 734 as a function of the comparisons made at 712, 714, 716, 718 respectively.
- the process loops back at 720, 722, 724, 726 or 728 to repeat the monitor mode diagnostics, or the transmitter can be shut down until maintenance is performed. If the diagnostic process itself fails, an error indication is provided on the diagnostic output at 736.
- the historical data set comprises statistical data such as data on the mean ( ⁇ ) and standard deviation ( ⁇ ) of the calculated difference;
- the current data set comprises current sample statistical data, such as the sample average ( X ) and sample deviation (s) of the calculated difference.
- the sample deviation (s) is compared to the standard deviation ( ⁇ ) to diagnose impulse line plugging, for example.
- Other known statistical measures of uncertainty, or statistical measures developed experimentally to fit this application can also be used besides mean and standard deviation.
- the diagnostics can be temporarily suspended as shown at 712 until usual flow conditions are reestablished. This helps to prevent false alarm indications.
- the transmitter generates a calibrated output and the flow diagnostic system generates a diagnostic output that indicates if the pressure generator is out of calibration.
- the primary element can comprise, for example, a simple pitot tube or an averaging pitot tube as illustrated below in the example shown in FIG. 16 .
- the primary element and impulse pipes can be combined in an integral orifice such as illustrated in FIGS 2-3 .
- An orifice plate adapted for clamping between pipe flanges is illustrated in FIG. 1 .
- the primary element can comprise a venturi, a nozzle or an orifice (not illustrated).
- a standard arrangement of a pressure generator can be used with a flow diagnostic system that is adapted to provide the diagnostics outputs.
- the flow diagnostic system adapts itself to the characteristics of the pressure generator during the training mode and has a standard of comparison stored during the training mode that is available for comparison during the monitoring or operational mode.
- the standard of comparison can be adjusted as needed by a technician via the network.
- the fluid flow meter provides a calibrated flow rate output and the diagnostic report indicates if the pressure generator is out of calibration.
- FIG. 8 is a flow chart of a process diagnosing the condition of a primary element.
- the condition of the primary element can include erosion or fouling of the primary element.
- the method or algorithm starts at 802. Digital pressure data is gathered in a training mode or time interval as shown at 804. A power spectrum of the sensor data, minus the moving average, is calculated at 806. The power spectrum obtained is identified as the training power spectrum at 808 and stored in non-volatile memory 810. After completion of training, the process moves on to monitoring or normal use. A further power spectrum of current pressure data, minus the moving average, is evaluated at 812, and the power spectrum so obtained in stored in memory 814, that can be either RAM or nonvolatile memory. At 816, the power spectrum Fi obtained during training is compared to the power spectrum Fi obtained during monitoring.
- a primary element warning (PE Warning) is generated as shown at 818. If the power spectrums Fi and Fi are sufficiently similar, then no primary element warning is generated. After the comparison at 816 and generation of a PE Warning, as needed, program flow moves to obtain new real time pressure data at 820 and the monitoring process moves on to a new evaluation at 812, or the flow meter can shut down when there is a PE warning.
- the process in FIG. 8 can loop continuously in the monitoring mode to provide real time information concerning the condition of the primary element.
- FIG. 9 a flow chart illustrates a process that provides diagnosis of both primary element (PE) and impulse lines (IL).
- Program flow starts at 902.
- pressure data minus a moving average, is obtained and training power spectrum and training statistics are stored in nonvolatile memory as explained above.
- impulse line diagnostics (such as those explained in Fig. 7 ) are performed at step 906 in FIG. 9 .
- current impulse line statistics are compared to historical (training) impulse line statistics (as detailed in FIG. 7 ) at 908. If the comparison indicates a problem with plugging of impulse lines, then an impulse line warning is generated as shown at 910. If no problem with the impulse lines is apparent, then program flow moves on to primary element (PE) diagnostics at 912.
- PE primary element
- power spectral density for the current real time data is calculated (as explained above in connection with FIG. 8 ).
- the current power spectral density is compared to the historical power spectral density at 914, and if there is a difference large enough to indicate a problem with the primary element, then a PE Warning is generated as shown at 916. If the differences in the power spectral densities are small, then no PE warning is generated as shown at 918.
- Program flow continues on at 920 to repeat the IL and PE diagnostics, or the flow meter can be shut down if there is a PE or IL warning until maintenance is performed.
- Any of the methods can be stored on a computer-readable medium as a plurality of sequences of instructions, the plurality of sequences of instructions including sequences that, when executed by a diagnostic application in a flow diagnostic system, cause the flow diagnostic system to perform a diagnostic method relative to a primary element and impulse lines coupled to the transmitter.
- the flow diagnostics system can also be used with a transmitter (not illustrated) which includes remote seals connected by flexible capillary tubes that are filled with a controlled quantity of isolation fluid such as silicone oil.
- the isolator arrangement permits the transmitter electronics to be spaced away from extremely hot process fluids which contact the remote seals.
- the flow diagnostics system can also be used to detect leaking and pinching off of capillary tubes using the diagnostic techniques described above to provide diagnostic data.
- the flow diagnostics system can also be used with a transmitter (not illustrated) which connects to taps near the bottom and top of a tank.
- the transmitter provides an output that represents a time integral of flow in and out of the tank.
- the transmitter includes circuitry, or alternatively software, that measures the differential pressure between the taps and computes the integrated flow as a function of the sensed differential pressure and a formula stored in the transmitter relating the sensed pressure to the quantity of fluid in the tank. This formula is typically called a strapping function and the quantity of fluid which has flowed into or out of the tank can be integrated as either volumetric or mass flow, depending on the strapping function stored in transmitter.
- the transmitter can be located either near the bottom or the top of tank, with a tube going to the other end of the tank, often called a "leg.”
- This leg can be either a wet leg filled with the fluid in the tank, or a dry leg filled with gas. Remote seals can also be used with such a transmitter.
- the flow diagnostic system includes a signal preprocessor algorithm that isolates signal components in the pressure data such as frequencies, amplitudes or signal characteristics which are related to a plugged impulse line or degraded primary element.
- the signal preprocessor provides an output to a signal evaluator in the difference algorithm.
- the signal preprocessor isolates a portion of the signal by filtering, performing a wavelet transform, performing a Fourier transform, use of a neural network, statistical analysis, or other signal evaluation techniques.
- Such preprocessing is preferably implemented in the difference algorithm or in a specialized digital signal processor.
- signal preprocessor can comprise a filter, for example a band pass filter, to generate the isolated signal output.
- FFT Fast Fourier transform
- the signal preprocessor comprises a wavelet processor which performs a wavelet analysis on the sensor signal as shown in FIGS. 10 , 11 and 12 using a discrete wavelet transform. Wavelet analysis is well suited for analyzing signals which have transients or other non-stationary characteristics in the time domain. In contrast to Fourier transforms, wavelet analysis retains information in the time domain, i.e., when the event occurred.
- Wavelet analysis is a technique for transforming a time domain signal into the frequency domain which, like a Fourier transformation, allows the frequency components to be identified.
- the output includes information related to time. This may be expressed in the form of a three dimensional graph with time shown on one axis, frequency on a second axis and signal amplitude on a third axis.
- a discussion of wavelet analysis is given in On-Line Tool Condition Monitoring System With Wavelet Fuzzy Neural Network, by L. Xiaoli et al., 8 JOURNAL OF INTELLIGENT MANUFACTURING pgs. 271-276 (1997 ).
- a portion of the sensor signal is windowed and convolved with a wavelet function.
- This convolution is performed by superimposing the wavelet function at the beginning of a sample, multiplying the wavelet function with the signal and then integrating the result over the sample period.
- the result of the integration is scaled and provides the first value for continuous wavelet transform at time equals zero. This point may be then mapped onto a three dimensional plane.
- the wavelet function is then shifted right (forward in time) and the multiplication and integration steps are repeated to obtain another set of data points which are mapped onto the 3-D space. This process is repeated and the wavelet is moved (convolved) through the entire signal.
- the wavelet function is then scaled, which changes the frequency resolution of the transformation, and the above steps are repeated.
- FIG. 10 is a graph of amplitude versus frequency versus time of a process variable signal such as the pressure data reading from a pressure transmitter.
- Data from a wavelet transformation of digital pressure data is shown in FIG. 10 .
- the data is graphed in three dimensions and forms a surface 170.
- the digital pressure data includes a small signal peak 172 at about 1 kHz at time t 1 and another peak 174 at about 100 Hz at time t 2 .
- surface 170 or portions of surface 170 are evaluated to determine impulse piping or primary element degradation.
- DWT discrete wavelet transform
- Mallat algorithm is a two channel sub-band coder.
- the Mallet algorithm provides a series of separated or decomposed signals which are representative of individual frequency components of the original signal.
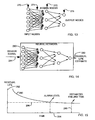
- FIG. 11 is a block diagram of a discrete wavelet transformation.
- FIG. 11 illustrates an example in which an original set of digital pressure data or signal S is decomposed using a sub-band coder of a Mallet algorithm.
- the signal S has a frequency range from 0 to a maximum of f MAX .
- the signal is passed simultaneously through a first high pass filter 250 having a frequency range from 1/2 f MAX to f MAX , and a low pass filter 252 having a frequency range from 0 to 1/2 f MAX . This process is called decomposition.
- the output from the high pass filter provides "level 1" discrete wavelet transform coefficients 254.
- the level 1 coefficients 254 represent the amplitude as a function of time of that portion of the input signal which is between 1/2 f max and f max* .
- the output from the 0 - 1/2 f max low pass filter 252 is passed through subsequent high pass (1/4 f max - 1/2 f max ) filter 256 and low pass (0 - 1/4 f max ) filter 258, as desired, to provide additional levels (beyond "level 1") of discrete wavelet transform coefficients.
- the outputs from each low pass filter can be subjected to further decompositions offering additional levels of discrete wavelet transformation coefficients as desired. This process continues until the desired resolution is achieved or the number of remaining data samples after a decomposition yields no additional information.
- the resolution of the wavelet transform is chosen to be approximately the same as the sensor or the same as the minimum signal resolution required to monitor the signal.
- Each level of DWT coefficients is representative of signal amplitude as a function of time for a given frequency range. Coefficients for each frequency range are concatenated to form a graph such as that shown in FIG. 10 .
- padding is added to the signal by adding data to the sensor signal near the borders of windows used in the wavelet analysis. This padding reduces distortions in the frequency domain output.
- This technique can be used with a continuous wavelet transform or a discrete wavelet transform.
- “Padding” is defined as appending extra data on either side of the current active data window, for example, extra data points are added which extend 25% of the current window beyond either window edge.
- the padding is generated by repeating a portion of the data in the current window so that the added data "pads" the existing signal on either side. The entire data set is then fit to a quadratic equation which is used to extrapolate the signal 25% beyond the active data window.
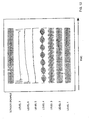
- FIG. 12 is a graph showing signals output from a discrete wavelet transformation (DWT) such as that shown in FIG. 11 .
- FIG. 12 illustrates an example showing a signal S generated by a pressure transmitter and the resultant approximation signals yielded in seven decomposition levels labeled level 1 through level 7.
- signal level 7 is representative of the lowest frequency DWT coefficient which can be generated. Any further decomposition yields noise. All levels, or only those levels which relate impulse piping or primary element degradation are provided.
- the algorithm evaluates the isolated signal received from the signal preprocessing and in one embodiment, monitors an amplitude of a certain frequency or range of frequencies identified and provides a diagnostic output if a threshold is exceeded.
- Signal evaluator can also comprise more advanced decision making algorithms such as fuzzy logic, neural networks, expert systems, rule based systems, etc.
- Commonly assigned U.S. Patent Application No. 08/623,569 describes various decision making systems which can be implemented in a signal evaluator.
- the diagnostic application performs diagnostics related to the impulse piping or primary element using information derived from a differential pressure sensor.
- the diagnostic application can provide a residual lifetime estimate, an indication of a failure, an indication of an impending failure or a calibration output which is used to correct for errors in the sensed process variable.
- empirical models or polynomial curve-fitting are used to detect line plugging or primary element degradation.
- a polynomial-like equation which has a combination of input signals such as various statistical parameters can be used to detect primary element degradation or impulse line plugging. Constants for the equations can be stored in a memory or received over the network.
- the signal can be analyzed using a neural network.
- a neural network is a multi-layer neural network.
- BPN Backpropagation Network
- FIG. 13 is a diagram showing a simplified neural network.
- FIG. 13 illustrates a typical topology of a three-layer neural network architecture that can be implemented in the diagnostic application.
- the first layer 270 usually referred to as the input buffer, receives the information, and feeds them into the inner layers.
- the second layer in a three-layer network, commonly known as a hidden layer 272, receives the information from the input layer, modified by the weights on the connections 274 and propagates this information forward. This is illustrated in the hidden layer 272 which is used to characterize the nonlinear properties of the system analyzed.
- the last layer is the output layer 276 where the calculated outputs (estimations) are presented to the environment.
- FIG. 14 is a diagram showing a neural network 280 used to provide a residual lifetime estimate.
- FIG. 14 illustrates a schematic of a neural network which provides a residual life estimate 282 for a primary element or impulse pipe based upon a sensor (transmitter) signal 284.
- the sensor signal can be either a raw sensor signal or a sensor signal which has been processed through signal processing techniques.
- FIG. 15 is a graph 290 of residual life 292 versus time 294.
- FIG. 15 illustrates a graph of residual life versus time and shows that an alarm level 296 can be set prior to an estimated failure time 298. This allows the system to provide an alarm output prior to actual failure of the device.
- This embodiment uses a set of if-then rules to reach a conclusion on the status of the impulse piping or primary element.
- This embodiment may be implemented easily in analog or digital circuitry. For example, with a simple rule, if the signal drops a certain amount below a historical mean, an output can be provided which indicates that an impulse line is plugged or is in the process of becoming plugged.
- more complex rules can be used which use multiple statistical parameters or signal components of the sensor signal to provide more accurate or different information.
- one or more of the decomposition signal(s) in a wavelet analysis directly relate to line plugging and are used to diagnose the transmitter.
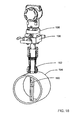
- FIG. 16 illustrates a diagnostic fluid flow meter that has a pitot tube for a primary element.
- the primary element can comprise a simple pitot tube or an averaging pitot tube as illustrated.
- the pitot tube 190 can be inserted through a tap 192 on a pipe 194.
- An instrument manifold 196 can couple between the pressure generator (including pitot inlets and impulse pipes internal to the pitot tube 190) and a pressure transmitter 198.
- FIG. 17 illustrates a computer platform 1 that connects via an interface 2 to one of several Hart interchange Devices 4.
- Interface 2 can be an RS232-RS485 converter; an ethernet connection, an intranet or internet connection, or other suitable interface that communicates information to the computer platform 1.
- the computer platform 1 is typically a personal computer located in a maintenance shop area that includes application software such as an Asset Management Solutions (AMS) software application from Rosemount Inc.
- AMS Asset Management Solutions
- Each Hart interchange devices 4 couples to one or more pressure transmitters 6 via a termination panel 8.
- the Hart interchange devices 4 are coupled via a DIN rail or bus 10 to a control system 12.
- a diagnostic application 14 as described above in connection with FIGS. 1-16 also resides on computer platform 1.
- Computer platform 1 provides a diagnostic report as explained above. The arrangement illustrated in FIG.
- control system 17 allows substantially all of the diagnostic software to run on computer platform 1 (which is a small control system) rather than place additional overhead on control system 12.
- control system includes control systems such as control system 112 in FIG. 1 which provide electrical feedback to a fluid processing plant as well as computers that perform a monitoring function such as computer platform 1, where the feedback to the fluid processing plant comprises human intervention based on a diagnostic report generated by the computer platform 1.
- circuit elements may not be partitioned into separate blocks as shown, but components used for various functional blocks can be intermingled and shared. Likewise with software, some instructions can be shared as part of several functions and be intermingled with unrelated instructions.
Abstract
Description
- The present invention relates to fluid process control systems. In particular, the present invention relates to diagnostic systems for fluid flow in process control systems.
- Fluid flow meters are used in industrial process control environments to measure fluid flow and provide flow signals for flow indicators and controllers. Inferential flow meters measure fluid flow in a pipe by measuring a pressure drop near a discontinuity within the pipe. The discontinuity (primary element) can be an orifice, a nozzle, a venturi, a pitot tube, a vortex shedding bar, a target or even a simple bend in the pipe. Flow around the discontinuity causes both a pressure drop and increased turbulence. The pressure drop is sensed by a pressure transmitter (secondary element) placed outside the pipe and connected by impulse lines or impulse passageways to the fluid in the pipe. Reliability depends on maintaining a correct calibration. Erosion or buildup of solids on the primary element can change the calibration. Impulse lines can become plugged over time, which also adversely affects calibration.
- Disassembly and inspection of the impulse lines is one method used to detect and correct plugging of lines. Another known method for detecting plugging is to periodically add a "check pulse" to the measurement signal from a pressure transmitter. This check pulse causes a control system connected to the transmitter to disturb the flow. If the pressure transmitter fails to accurately sense the flow disturbance, an alarm signal is generated indicating line plugging. Another known method for detecting plugging is sensing of both static and differential pressures. If there is inadequate correlation between oscillations in the static and differential pressures, then an alarm signal is generated indicating line plugging. Still another known method for detecting line plugging is to sense static pressures and pass them through high pass and low pass filters. Noise signals obtained from the filters are compared to a threshold, and if variance in the noise is less than the threshold, then an alarm signal indicates that the line is blocked.
-
WO00/50851 US6,119,047 disclose apparatus and methods of this general type. - These known methods rely on providing static pressure sensors or disassembly of the flow meter, increasing complexity and reducing reliability. These known methods do not provide for diagnosing the condition of the primary element. There is thus a need for a better diagnostic technology providing more predictive, less reactive maintenance for reducing cost or improving reliability.
- The present invention provides a flow diagnostic system according to
claim 1 and a method according toclaim 6. - A flow diagnostic system is disclosed for coupling to a primary flow sensing element via impulse lines. The flow diagnostic system may include a pressure transmitter that couples to the impulse lines and generates digital pressure data representing pressure.
- A control system receives the pressure data and provides the pressure data and real time clock readings associated with pressure data to a diagnostic application stored in the flow diagnostic system.
- The diagnostic application includes a first algorithm that calculates a difference between the pressure data and a moving average of the pressure data.
- The diagnostic application also includes a second algorithm that receives the difference and calculates a trained data set of historical pressure data during a training mode and calculates a current pressure data set during a monitoring mode and then generates diagnostic data as a function of the current pressure data set relative to the historical pressure data, which indicates changes in the condition of flow sensing.
- The diagnostic application includes a third algorithm that generates a report indicating the diagnostic data.
- The diagnostic application can be provided over a network from an application service provider (ASP) or other source and can run on the control system, the ASP or another remote computer.
-
-
FIG. 1 is a schematic illustration of a flow diagnostic system that diagnoses the condition of impulse lines and/or a primary flow element. -
FIG. 2 is a schematic illustration of a first embodiment of a control system that is part of a flow diagnostic system. -
FIG. 3 is a schematic illustration of a second embodiment of a control system that is part of a flow diagnostic system. -
FIG. 4 is a block diagram of a diagnostic application. -
FIG. 5 is a block diagram of a diagnostic application that diagnoses the condition of impulse lines. -
FIG. 6 is a block diagram of a diagnostic application that diagnoses the condition of a primary flow element. -
FIG. 7 is a flow chart of a process diagnosing the condition of impulse lines. -
FIG. 8 is a flow chart of a process diagnosing the condition of a primary element. -
FIG. 9 is a flow chart of a process of diagnosing the condition of both impulse lines and a primary element. -
FIG. 10 is a graph of amplitude versus frequency versus time of a process variable signal. -
FIG. 11 is a block diagram of a discrete wavelet transformation. -
FIG. 12 is a graph showing signals output from a discrete wavelet transformation. -
FIG. 13 is a diagram showing a simplified neural network. -
FIG. 14 is a diagram showing a neural network used to provide a residual lifetime estimate. -
FIG. 15 is a graph of residual life versus time. -
FIG. 16 illustrates a diagnostic fluid flow meter that has a pitot tube for a primary element. -
FIG. 17 illustrates a block diagram of a computer platform communicating with a transmitter via a field network. - In the present invention, a flow diagnostic system is provided that can diagnose the condition of either the primary element or impulse lines connected to a pressure transmitter. A diagnostic application is downloadable over a network from an application service provider (ASP), or can be obtained from a computer-readable medium such as a CD-ROM or removable disc. The diagnostic application can run on the control system, a remote computer or the ASP and provide a diagnostic report. The diagnostic application runs on a processor that is high powered relative to the low power embedded processor found in the pressure transmitter. With the use of the high powered processor, sophisticated diagnostics can be performed in real time and provide prompt reports to a plant operator about the condition of primary elements or impulse lines or both. There is no need to use processing time on the processor imbedded in the transmitter for diagnostics, and the transmitter can perform its measurement tasks rapidly.
-
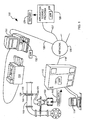
FIG. 1 is a schematic illustration of a generalized example of a flowdiagnostic system 100 that diagnoses the condition ofimpulse lines 104 and/or aprimary flow element 106 placed in afluid piping system 108. Theimpulse lines 104 and theprimary element 106 are referred to collectively as a "pressure generator." - The term "pressure generator" as used in this application means a primary element (e.g., an orifice plate, a pitot tube, a nozzle, a venturi, a shedding bar, a bend in a pipe or other flow discontinuity adapted to cause a pressure drop in flow) together with impulse pipes or impulse passageways that couple the pressure drop from locations near the primary element to a location outside the flow pipe. The spectral and statistical characteristics of this pressure presented by this defined "pressure generator" at a location outside the flow pipe to a connected pressure transmitter 82 can be affected by the condition of the primary element as well as on the condition of the impulse pipes. The connected pressure transmitter can be a self-contained unit, or it can be fitted with remote seals as needed to fit the application. A flange on the pressure transmitter 102 (or its remote seals) couples to a flange adapter on the
impulse lines 104 to complete the pressure connections in a conventional manner. Thepressure transmitter 102 couples to aprimary flow element 106 viaimpulse lines 104 to sense flow.Primary element 106, as illustrated, is an orifice plate clamped betweenpipe flanges 105. -
Pressure transmitter 102 is coupled to theimpulse lines 104 and provides pressure data alongline 110 to acontrol system 112.Pressure transmitter 102 is preferably a differential pressure transmitter.Line 110 is typically a conventional 4-20 mA loop that provides all of the electrical energization fortransmitter 102 and also carries digital pressure data representing the pressure sensed bypressure transmitter 102.Pressure transmitter 102 includes an embedded microprocessor that generates the digital pressure data, however, the computing power of the embedded microprocessor is limited by the power available from the 4-20 mA loop. The digital pressure data is typically transmitted in a standard industry format using a digital protocol such as HART, Foundation Fieldbus, Profibus, CAN or the like. -
Control system 112 receives the digital pressure data online 110 and providing the pressure data and real time clock readings associated with pressure data to a diagnostic application stored in the flowdiagnostic system 100. - As explained in more detail below, the diagnostic application can be a
application 134 that is stored in and running on a processor incontrol system 112, anapplication 130 stored in and running on a processor at anapplication service provider 126, anapplication 132 stored in and running on a processor in aremote computer 122 or any combination of these locations. In each of these locations, relatively high power computing is available in comparison to the limited computing power available from the embedded processor intransmitter 102. An arrangement where the diagnostic application is stored on one computer (112, 122 or 126) and running on another one of the computers (112, 122, 126) is also contemplated. - The diagnostic application (134, 130, 132 or a combination of 134, 130 or 132) includes a first algorithm calculating a difference between the pressure data and a moving average of the pressure data. The diagnostic application further includes a second algorithm receiving the difference and calculating a trained data set of historical pressure data during a training mode and calculating a current pressure data set during a monitoring mode and generating diagnostic data as a function of the current pressure data set relative to the historical pressure data indicating changes in the condition of flow sensing. The diagnostic application also includes a third algorithm generating a report indicating the diagnostic data. The report can be presented to an user at control system monitor 114, a
printer 124 or monitor associated withremote computer 122 or areport 128 generated by theapplication service provider 126. It is appreciated that the report can take a variety of forms or displays that communicate the diagnostic data to the user. - The
control system 112 couples alongline 118 to anetwork 116.Network 116 also couples alongline 120 to theremote computer 122, and couples alongline 127 to theapplication service provider 126. Typically, theremote computer 122 is located in the offices of the plant operator, while theline 127 is a long distance connection, typically over the internet, to anapplication service provider 126 at any desired location. - The
network 116 can provide the diagnostic application to thecontrol system 112 or theremote computer 122. The network can also provide the pressure data and associated real time clock readings to the diagnostic application running at theremote computer 122 or theapplication service provider 126. - The illustration in
FIG. 1 is a generalized illustration, and not all diagnostics systems include all of the features shown inFIG. 1 . -
FIG. 2 is a schematic illustration of a first embodiment of acontrol system 206 that is part of a flow diagnostic system such as flowdiagnostic system 100 inFIG. 1 . -
Pressure transmitter 200 is coupled viaimpulse lines 201 to anintegral orifice plate 202 in a fluid flow system.Pressure transmitter 200 couples to controlsystem 206 alongline 204. The pressure transmitter generates digital pressure data (P) and associated digital real time clock readings (RTC) as illustrated at 205. The real time clock readings provided by thetransmitter 200 with each pressure reading indicate the relative time that each pressure reading is taken by thetransmitter 200. In an instance where the transmitter generates pressure readings at a generally constant rate, the real time clock reading can be as simple as a sequential number for each reading. In an instance where the pressure reading are somewhat more irregularly spaced in time, the real time clock reading can be an approximate time that each reading taken. - The
control system 206 receives thedigital information 205 at atransmitter bus interface 208.Transmitter bus interface 208 formats the data properly for communication on thebus 210 that is internal to thecontrol system 206. Theinformation 205 is used byprocess control software 214 to couple control signals alongline 215 to a valve or other control device.Control system 206 includes anetwork interface 212 that can pass thedigital information 205 along to a network online 218 in a case where the diagnostic application is not running on thecontrol system 206. In a case where the diagnostic application is running on thecontrol system 206, thenetwork interface 212 can receive the diagnostic application fromline 218 and format it for transmission over thebus 210. Thenetwork interface 212 is bidirectional. Thecontrol system 206 includes a processor, random access memory, non-volatile memory and I/O devices. -
FIG. 3 is a schematic illustration of a second embodiment of acontrol system 306 that is part of a flow diagnostic system such as flowdiagnostic system 100 inFIG. 1 . -
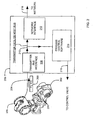
Pressure transmitter 300 is coupled viaimpulse lines 301 to anintegral orifice plate 302 in a fluid flow system.Pressure transmitter 300 couples to controlsystem 306 alongline 304. The pressure transmitter generates digital pressure data (P) as illustrated at 305.Transmitter 300 generates real time clock readings. - In an instance where the
transmitter 300 generates real time clock readings, these reading are coupled throughtransmitter bus interface 308 to realtime clock circuit 318 via abus 310 that is internal to controlsystem 306. Realtime clock circuit 318 then generates a corresponding synchronized real time clock reading that is synchronized with other real time clock readings in thecontrol system 306. This synchronization allows for synchronized comparison of data from multiple transmitters, for example, in a case where differential pressure is measured using two absolute pressure transmitters. - In either instance, the pressure data and synchronized real time clock readings can be used by
process control software 314 to couple control signals alongline 315 to a valve or other control device.Control system 306 includes anetwork interface 312 that can pass digital information (pressure data 305 and synchronized real time clock readings) along to a network online 318 in a case where the diagnostic application is not running on thecontrol system 306. If the network connected toline 318 is busy or otherwise unavailable, then the digital information can be temporarily stored instorage device 320 and later transmitted via the network to a diagnostic application running on a remote computer. Thisstorage 320 can also be used in instances where it is desired to use batch processing for diagnostics. - In a case where the diagnostic application is running on the
control system 306, thenetwork interface 312 can receive the diagnostic application fromline 318 and format it for transmission over thebus 310 internal to controlsystem 306. -
FIG. 4 is a block diagram of adiagnostic application 432 running on aremote computer 422. Pressure data and real time clock reading from a pressure transmitter are provided online 320 from anetwork 316. - A
first algorithm 440 stored incomputer 422 calculates a difference between the series of digital pressure data points received fromnetwork 316 and a moving average of the series of digital pressure data points. Real time clock readings associated with each digital pressure data point are used to ensure that the digital pressure data points, which may be delayed or out of order after passing throughnetwork 316, are reassembled in a correct time sequence at the input toalgorithm 440. The difference calculated inalgorithm 440 is coupled alongline 442 to a second algorithm 444. - The second algorithm 444 is also stored in the
computer 422. The second algorithm 444 receives the difference calculated byalgorithm 440 and calculates a trained data set of historical data during a training mode and calculates a current data set during a monitoring mode and generatesdiagnostic data 446 as a function of the current data set relative to the historical data indicating changes in the condition of the pressure generator (not illustrated inFIG. 4 ). - A
third algorithm 448 receives thediagnostic data 446 and generates areport 450 indicating the diagnostic data to a user. Thereport 450, as explained above, can take forms such as a monitor display or a printed report. -
FIG. 5 is a block diagram of a diagnostic application running on aremote computer 522 that diagnoses the condition of impulse lines. - In
FIG. 5 , a difference (subtract moving average)algorithm 540 receives digital pressure data fromnetwork 516 vialine 520 and generates difference data online 542 representing a sensed pressure minus a moving average of the sensed pressure. A calculatealgorithm 552 receives the difference data fromline 542 and calculates a trainedoutput 553 of historical data obtained during a training mode or time interval. After training, calculatealgorithm 554 calculates amonitor output 555 of current data obtained during a monitoring mode or normal operation time of the fluid flow meter. - In
FIG. 5 , adiagnostic algorithm 556 receives the trainedoutput 553 and themonitor output 555 and generates adiagnostic data output 558 indicating a current condition of the pressure generator relative to an historical condition. InFIG. 5 , calculatealgorithm 554 stores the historical data in memory for later use in the comparison. - In
difference algorithm 540, the moving average is calculated according to the series in Eq. 1:
where A is the moving average, P is a series of sequentially sensed pressure values, and W is a numerical weight for a sensed pressure value, m is a number of previous sensed pressure values in the series. Provision can also be made indifference circuit 540 to filter out spikes and other anomalies present in the sensed pressure. InFIG. 5 , the historical data comprises statistical data, for example, the mean (µ) and standard deviation (σ) of the difference output or other statistical measurements, and thediagnostic output 558 indicates impulse line plugging. The diagnostic application switches between a training mode when it is installed and a monitoring mode when it is in use measuring flow as illustrated byswitch 550. The calculatealgorithm 554 stores historical data in the training mode. Thediagnostic data output 558 indicates a real time condition of the pressure generator. - In
FIG. 5 , statistical data, such as the mean µ and standard deviation σ, are calculated based on a relatively large number of data points or flow measurements. The corresponding sample statistical data, such as sample mean X and sample standard deviation s, are calculated from a relatively smaller number of data points. Typically, hundreds of data points are used to calculate statistical data such as µ and σ, while only about 10 data points are used to calculate sample statistical data such as X and s. The number of data points during monitoring is kept smaller in order to provide diagnostics that is real time, or completed in about 1 second.Diagnostic algorithm 556 indicates line plugging if the sample standard deviation s deviates from the standard deviation σ by a preset amount, for example 10%. -
FIG. 6 is a block diagram of a diagnostic application running on aremote computer 622 that diagnoses the condition of a primary flow element. The diagnostic application ofFIG. 6 is arranged generally along the lines of the diagnostic application ofFIG. 5 . Adifference algorithm 640 receives digital pressure data fromnetwork 616 vialine 620. The diagnostic application switches between a training mode and a monitoring mode byswitch 650. - In
FIG. 6 , thediagnostic output 658 indicates a condition of the primary element, while inFIG. 5 , thediagnostic output 558 indicates a condition of the impulse lines. InFIG. 6 , calculatealgorithms line 642 rather than statistical data which is used inFIG. 5 . - The power spectral density data is preferably in the range of 0 to 100 Hertz. The center frequency of a bandpass filter can be swept across a selected range of frequencies to generate a continuous or quasi-continuous power spectral density as a function of frequency in a manner that is well known. Various known Fourier transforms can be used.
- Power spectral density, Fi, can also be calculated using Welch's method of averaged periodograms for a given data set. The method uses a measurement sequence x(n) sampled at fs samples per second, where n = 1, 2, ...N . A front end filter with a filter frequency less than fs/2 is used to reduce aliasing in the spectral calculations. The data set is divided into Fk,i as shown in Eq. 2:

- There are Fk,i overlapping data segments and for each segment, a periodogram is calculated where M is the number of points in the current segment. After all periodograms for all segments are evaluated, all of them are averaged to calculate the power spectrum:

- Once a power spectrum is obtained for a training mode, this sequence is stored in memory, preferably EEPROM, as the baseline power spectrum for comparison to real time power spectrums. Fi is thus the power spectrum sequence and i goes from 1 to N which is the total number of points in the original data sequence. N, usually a power of 2, also sets the frequency resolution of the spectrum estimation. Therefore, Fi is also known as the signal strength at the ith frequency. The power spectrum typically includes a large number points at predefined frequency intervals, defining a shape of the spectral power distribution as a function of frequency.
- In the detection of the primary element degradation, a relatively larger sample of the spectral density at baseline historical conditions and a relatively smaller sample of the spectral density at monitoring conditions are compared. The relatively smaller sample allows for a real time indication of problems in about 1 second. An increase in the related frequency components of the power spectrum can indicate the degradation of the primary element. Using orifice plates as primary elements, for example, changes as high as 10% are observed in spectral components when the orifice plate is degraded to a predetermined level. The amount of change can be adjusted as needed, depending on the tolerable amount of degradation and the type of primary element in use. The amount of change needed to indicate a problem is arrived at experimentally for each type of primary element arrangement. Fuzzy logic can also be used to compare the many points of the power spectrums.
- The pressure data is typically a calibrated output, and the diagnostic data indicates if the pressure generator is out of calibration.
-
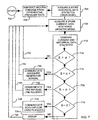
FIG. 7 is a detailed flow chart of a process diagnosing the condition of impulse lines. - The algorithm starts at 702. A moving average is subtracted from differential pressure data as shown at 704 to calculate a difference. During a train mode, historical data on the calculated difference is acquired and stored at 706 as statistical data µ and σ, for example. During an operational MONITOR mode, current data on the difference is acquired and stored at 708 as statistical data X and s. The smaller sample of current data is compared to the larger sample of the historical data to diagnose the condition of the impulse lines.
Comparisons 710 of historical and current statistical data are made at 714, 716, 718 and a selected diagnostic output is generated at 730, 732, 734 as a function of the comparisons made at 712, 714, 716, 718 respectively. - After completion of any diagnostic output, the process loops back at 720, 722, 724, 726 or 728 to repeat the monitor mode diagnostics, or the transmitter can be shut down until maintenance is performed. If the diagnostic process itself fails, an error indication is provided on the diagnostic output at 736. In the method of diagnosis illustrated in
FIG. 7 , the historical data set comprises statistical data such as data on the mean (µ) and standard deviation (σ) of the calculated difference; the current data set comprises current sample statistical data, such as the sample average (X) and sample deviation (s) of the calculated difference. The sample deviation (s) is compared to the standard deviation (σ) to diagnose impulse line plugging, for example. Other known statistical measures of uncertainty, or statistical measures developed experimentally to fit this application can also be used besides mean and standard deviation. When there is an unusual flow condition where X is much different than µ, the diagnostics can be temporarily suspended as shown at 712 until usual flow conditions are reestablished. This helps to prevent false alarm indications. - In
FIGS. 1-7 , the transmitter generates a calibrated output and the flow diagnostic system generates a diagnostic output that indicates if the pressure generator is out of calibration. InFIGS. 1-7 , the primary element can comprise, for example, a simple pitot tube or an averaging pitot tube as illustrated below in the example shown inFIG. 16 . The primary element and impulse pipes can be combined in an integral orifice such as illustrated inFIGS 2-3 . An orifice plate adapted for clamping between pipe flanges is illustrated inFIG. 1 . The primary element can comprise a venturi, a nozzle or an orifice (not illustrated). A standard arrangement of a pressure generator can be used with a flow diagnostic system that is adapted to provide the diagnostics outputs. The flow diagnostic system adapts itself to the characteristics of the pressure generator during the training mode and has a standard of comparison stored during the training mode that is available for comparison during the monitoring or operational mode. The standard of comparison can be adjusted as needed by a technician via the network. In each arrangement, the fluid flow meter provides a calibrated flow rate output and the diagnostic report indicates if the pressure generator is out of calibration. -
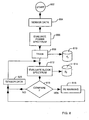
FIG. 8 is a flow chart of a process diagnosing the condition of a primary element. - The condition of the primary element can include erosion or fouling of the primary element. The method or algorithm starts at 802. Digital pressure data is gathered in a training mode or time interval as shown at 804. A power spectrum of the sensor data, minus the moving average, is calculated at 806. The power spectrum obtained is identified as the training power spectrum at 808 and stored in
non-volatile memory 810. After completion of training, the process moves on to monitoring or normal use. A further power spectrum of current pressure data, minus the moving average, is evaluated at 812, and the power spectrum so obtained in stored inmemory 814, that can be either RAM or nonvolatile memory. At 816, the power spectrum Fi obtained during training is compared to the power spectrum Fi obtained during monitoring. If there is a significant difference between Fi and Fi which is indicative of a problem with the primary element, a primary element warning (PE Warning) is generated as shown at 818. If the power spectrums Fi and Fi are sufficiently similar, then no primary element warning is generated. After the comparison at 816 and generation of a PE Warning, as needed, program flow moves to obtain new real time pressure data at 820 and the monitoring process moves on to a new evaluation at 812, or the flow meter can shut down when there is a PE warning. The process inFIG. 8 can loop continuously in the monitoring mode to provide real time information concerning the condition of the primary element. - In
FIG. 9 , a flow chart illustrates a process that provides diagnosis of both primary element (PE) and impulse lines (IL). Program flow starts at 902. During a training mode illustrated at 904, pressure data, minus a moving average, is obtained and training power spectrum and training statistics are stored in nonvolatile memory as explained above. Next, impulse line diagnostics (such as those explained inFig. 7 ) are performed atstep 906 inFIG. 9 . InFIG. 9 , after impulse line diagnostics are performed, current impulse line statistics are compared to historical (training) impulse line statistics (as detailed inFIG. 7 ) at 908. If the comparison indicates a problem with plugging of impulse lines, then an impulse line warning is generated as shown at 910. If no problem with the impulse lines is apparent, then program flow moves on to primary element (PE) diagnostics at 912. - At
process 912, power spectral density for the current real time data is calculated (as explained above in connection withFIG. 8 ). The current power spectral density is compared to the historical power spectral density at 914, and if there is a difference large enough to indicate a problem with the primary element, then a PE Warning is generated as shown at 916. If the differences in the power spectral densities are small, then no PE warning is generated as shown at 918. Program flow continues on at 920 to repeat the IL and PE diagnostics, or the flow meter can be shut down if there is a PE or IL warning until maintenance is performed. - Any of the methods can be stored on a computer-readable medium as a plurality of sequences of instructions, the plurality of sequences of instructions including sequences that, when executed by a diagnostic application in a flow diagnostic system, cause the flow diagnostic system to perform a diagnostic method relative to a primary element and impulse lines coupled to the transmitter.
- The flow diagnostics system can also be used with a transmitter (not illustrated) which includes remote seals connected by flexible capillary tubes that are filled with a controlled quantity of isolation fluid such as silicone oil. The isolator arrangement permits the transmitter electronics to be spaced away from extremely hot process fluids which contact the remote seals. The flow diagnostics system can also be used to detect leaking and pinching off of capillary tubes using the diagnostic techniques described above to provide diagnostic data.
- The flow diagnostics system can also be used with a transmitter (not illustrated) which connects to taps near the bottom and top of a tank. The transmitter provides an output that represents a time integral of flow in and out of the tank. The transmitter includes circuitry, or alternatively software, that measures the differential pressure between the taps and computes the integrated flow as a function of the sensed differential pressure and a formula stored in the transmitter relating the sensed pressure to the quantity of fluid in the tank. This formula is typically called a strapping function and the quantity of fluid which has flowed into or out of the tank can be integrated as either volumetric or mass flow, depending on the strapping function stored in transmitter. The transmitter can be located either near the bottom or the top of tank, with a tube going to the other end of the tank, often called a "leg." This leg can be either a wet leg filled with the fluid in the tank, or a dry leg filled with gas. Remote seals can also be used with such a transmitter.
- In one embodiment, the flow diagnostic system includes a signal preprocessor algorithm that isolates signal components in the pressure data such as frequencies, amplitudes or signal characteristics which are related to a plugged impulse line or degraded primary element. The signal preprocessor provides an output to a signal evaluator in the difference algorithm. The signal preprocessor isolates a portion of the signal by filtering, performing a wavelet transform, performing a Fourier transform, use of a neural network, statistical analysis, or other signal evaluation techniques. Such preprocessing is preferably implemented in the difference algorithm or in a specialized digital signal processor.
- The signal components are isolated through signal processing techniques in which only desired frequencies or other signal characteristics such as amplitude are identified and an indication of their identification is provided. Depending upon the strength signals to be detected and their frequency, signal preprocessor can comprise a filter, for example a band pass filter, to generate the isolated signal output. For more sensitive isolation, advanced signal processing techniques are utilized such as a Fast Fourier transform (FFT) to obtain the spectrum of the sensor signal. In one preferred embodiment, the signal preprocessor comprises a wavelet processor which performs a wavelet analysis on the sensor signal as shown in
FIGS. 10 ,11 and12 using a discrete wavelet transform. Wavelet analysis is well suited for analyzing signals which have transients or other non-stationary characteristics in the time domain. In contrast to Fourier transforms, wavelet analysis retains information in the time domain, i.e., when the event occurred. - Wavelet analysis is a technique for transforming a time domain signal into the frequency domain which, like a Fourier transformation, allows the frequency components to be identified. However, unlike a Fourier transformation, in a wavelet transformation the output includes information related to time. This may be expressed in the form of a three dimensional graph with time shown on one axis, frequency on a second axis and signal amplitude on a third axis. A discussion of wavelet analysis is given in On-Line Tool Condition Monitoring System With Wavelet Fuzzy Neural Network, by L. Xiaoli et al., 8 JOURNAL OF INTELLIGENT MANUFACTURING pgs. 271-276 (1997). In performing a continuous wavelet transformation, a portion of the sensor signal is windowed and convolved with a wavelet function. This convolution is performed by superimposing the wavelet function at the beginning of a sample, multiplying the wavelet function with the signal and then integrating the result over the sample period. The result of the integration is scaled and provides the first value for continuous wavelet transform at time equals zero. This point may be then mapped onto a three dimensional plane. The wavelet function is then shifted right (forward in time) and the multiplication and integration steps are repeated to obtain another set of data points which are mapped onto the 3-D space. This process is repeated and the wavelet is moved (convolved) through the entire signal. The wavelet function is then scaled, which changes the frequency resolution of the transformation, and the above steps are repeated.
-
FIG. 10 is a graph of amplitude versus frequency versus time of a process variable signal such as the pressure data reading from a pressure transmitter. Data from a wavelet transformation of digital pressure data is shown inFIG. 10 . The data is graphed in three dimensions and forms asurface 170. As shown in the graph ofFIG. 10 , the digital pressure data includes asmall signal peak 172 at about 1 kHz at time t1 and anotherpeak 174 at about 100 Hz at time t2. Through subsequent processing by the signal evaluator,surface 170 or portions ofsurface 170 are evaluated to determine impulse piping or primary element degradation. - The continuous wavelet transformation described above requires extensive computations. Therefore, in one embodiment, a discrete wavelet transform (DWT) which is well suited for real time implementation in a control system or personal computer is performed. One efficient discrete wavelet transform uses the Mallat algorithm which is a two channel sub-band coder. The Mallet algorithm provides a series of separated or decomposed signals which are representative of individual frequency components of the original signal.
-
FIG. 11 is a block diagram of a discrete wavelet transformation.FIG. 11 illustrates an example in which an original set of digital pressure data or signal S is decomposed using a sub-band coder of a Mallet algorithm. The signal S has a frequency range from 0 to a maximum of fMAX. The signal is passed simultaneously through a firsthigh pass filter 250 having a frequency range from 1/2 fMAX to fMAX, and alow pass filter 252 having a frequency range from 0 to 1/2 fMAX. This process is called decomposition. The output from the high pass filter provides "level 1" discretewavelet transform coefficients 254. Thelevel 1coefficients 254 represent the amplitude as a function of time of that portion of the input signal which is between 1/2 fmax and fmax*. The output from the 0 - 1/2 fmaxlow pass filter 252 is passed through subsequent high pass (1/4 fmax - 1/2 fmax)filter 256 and low pass (0 - 1/4 fmax)filter 258, as desired, to provide additional levels (beyond "level 1") of discrete wavelet transform coefficients. The outputs from each low pass filter can be subjected to further decompositions offering additional levels of discrete wavelet transformation coefficients as desired. This process continues until the desired resolution is achieved or the number of remaining data samples after a decomposition yields no additional information. The resolution of the wavelet transform is chosen to be approximately the same as the sensor or the same as the minimum signal resolution required to monitor the signal. Each level of DWT coefficients is representative of signal amplitude as a function of time for a given frequency range. Coefficients for each frequency range are concatenated to form a graph such as that shown inFIG. 10 . - In some embodiments, padding is added to the signal by adding data to the sensor signal near the borders of windows used in the wavelet analysis. This padding reduces distortions in the frequency domain output. This technique can be used with a continuous wavelet transform or a discrete wavelet transform. "Padding" is defined as appending extra data on either side of the current active data window, for example, extra data points are added which extend 25% of the current window beyond either window edge. In one embodiment, the padding is generated by repeating a portion of the data in the current window so that the added data "pads" the existing signal on either side. The entire data set is then fit to a quadratic equation which is used to extrapolate the signal 25% beyond the active data window.
-
FIG. 12 is a graph showing signals output from a discrete wavelet transformation (DWT) such as that shown inFIG. 11 .FIG. 12 illustrates an example showing a signal S generated by a pressure transmitter and the resultant approximation signals yielded in seven decomposition levels labeledlevel 1 throughlevel 7. In this example,signal level 7 is representative of the lowest frequency DWT coefficient which can be generated. Any further decomposition yields noise. All levels, or only those levels which relate impulse piping or primary element degradation are provided. - The algorithm evaluates the isolated signal received from the signal preprocessing and in one embodiment, monitors an amplitude of a certain frequency or range of frequencies identified and provides a diagnostic output if a threshold is exceeded. Signal evaluator can also comprise more advanced decision making algorithms such as fuzzy logic, neural networks, expert systems, rule based systems, etc. Commonly assigned
U.S. Patent Application No. 08/623,569 describes various decision making systems which can be implemented in a signal evaluator. - The diagnostic application performs diagnostics related to the impulse piping or primary element using information derived from a differential pressure sensor. The following describes a number of embodiments for realizing a diagnostic application. The diagnostic application can provide a residual lifetime estimate, an indication of a failure, an indication of an impending failure or a calibration output which is used to correct for errors in the sensed process variable.
- In one embodiment of the present invention empirical models or polynomial curve-fitting are used to detect line plugging or primary element degradation. A polynomial-like equation which has a combination of input signals such as various statistical parameters can be used to detect primary element degradation or impulse line plugging. Constants for the equations can be stored in a memory or received over the network.
- The signal can be analyzed using a neural network. One such neural network is a multi-layer neural network. Although a number of training algorithms can be used to develop a neural network model for different goals. One embodiment includes the known Backpropagation Network (BPN) to develop neural network modules which will capture the nonlinear relationship among a set of input and output(s).
-
FIG. 13 is a diagram showing a simplified neural network.FIG. 13 illustrates a typical topology of a three-layer neural network architecture that can be implemented in the diagnostic application. Thefirst layer 270, usually referred to as the input buffer, receives the information, and feeds them into the inner layers. The second layer, in a three-layer network, commonly known as ahidden layer 272, receives the information from the input layer, modified by the weights on theconnections 274 and propagates this information forward. This is illustrated in the hiddenlayer 272 which is used to characterize the nonlinear properties of the system analyzed. The last layer is theoutput layer 276 where the calculated outputs (estimations) are presented to the environment. -
FIG. 14 is a diagram showing aneural network 280 used to provide a residual lifetime estimate.FIG. 14 illustrates a schematic of a neural network which provides aresidual life estimate 282 for a primary element or impulse pipe based upon a sensor (transmitter)signal 284. The sensor signal can be either a raw sensor signal or a sensor signal which has been processed through signal processing techniques. -
FIG. 15 is agraph 290 ofresidual life 292 versustime 294.FIG. 15 illustrates a graph of residual life versus time and shows that analarm level 296 can be set prior to an estimatedfailure time 298. This allows the system to provide an alarm output prior to actual failure of the device. - This embodiment uses a set of if-then rules to reach a conclusion on the status of the impulse piping or primary element. This embodiment may be implemented easily in analog or digital circuitry. For example, with a simple rule, if the signal drops a certain amount below a historical mean, an output can be provided which indicates that an impulse line is plugged or is in the process of becoming plugged. Of course, more complex rules can be used which use multiple statistical parameters or signal components of the sensor signal to provide more accurate or different information.
- With this embodiment, one or more of the decomposition signal(s) in a wavelet analysis directly relate to line plugging and are used to diagnose the transmitter.
-
FIG. 16 illustrates a diagnostic fluid flow meter that has a pitot tube for a primary element. The primary element can comprise a simple pitot tube or an averaging pitot tube as illustrated. Thepitot tube 190 can be inserted through atap 192 on apipe 194. Aninstrument manifold 196 can couple between the pressure generator (including pitot inlets and impulse pipes internal to the pitot tube 190) and apressure transmitter 198. -
FIG. 17 illustrates acomputer platform 1 that connects via aninterface 2 to one of severalHart interchange Devices 4.Interface 2 can be an RS232-RS485 converter; an ethernet connection, an intranet or internet connection, or other suitable interface that communicates information to thecomputer platform 1. Thecomputer platform 1 is typically a personal computer located in a maintenance shop area that includes application software such as an Asset Management Solutions (AMS) software application from Rosemount Inc. EachHart interchange devices 4 couples to one ormore pressure transmitters 6 via atermination panel 8. TheHart interchange devices 4 are coupled via a DIN rail orbus 10 to acontrol system 12. Adiagnostic application 14 as described above in connection withFIGS. 1-16 also resides oncomputer platform 1.Computer platform 1 provides a diagnostic report as explained above. The arrangement illustrated inFIG. 17 allows substantially all of the diagnostic software to run on computer platform 1 (which is a small control system) rather than place additional overhead oncontrol system 12. The term "control system" as used in this application includes control systems such ascontrol system 112 inFIG. 1 which provide electrical feedback to a fluid processing plant as well as computers that perform a monitoring function such ascomputer platform 1, where the feedback to the fluid processing plant comprises human intervention based on a diagnostic report generated by thecomputer platform 1. - Although the present invention has been described with reference to preferred embodiments, workers skilled in the art will recognize that changes can be made in form and detail without departing from the scope of the invention as defined by the appended claims. For example, various function blocks of the invention have been described in terms of algorithms, however, many function blocks may be implemented in other forms such as digital and analog circuits, software and their hybrids. When implemented in software, a processor performs the functions and the signals comprise digital values on which the software operates. A general purpose processor programmed with instructions that cause the processor to perform the desired process elements, application specific hardware components that contain circuit wired to perform the desired elements and any combination of programming a general purpose processor and hardware components can be used. Deterministic or fuzzy logic techniques can be used as needed to make decisions in the circuitry or software. Because of the nature of complex digital circuitry, circuit elements may not be partitioned into separate blocks as shown, but components used for various functional blocks can be intermingled and shared. Likewise with software, some instructions can be shared as part of several functions and be intermingled with unrelated instructions.
Claims (10)
- A flow diagnostic system (100) adapted to couple to a primary flow sensing element (106; 202; 302) via impulse lines (104; 201; 301), the flow diagnostic system (100) comprising:a pressure transmitter (102; 200; 300) coupled to the impulse lines (104; 201; 301), generating digital pressure data representing pressure providing real time clock readings associated with the digital pressure data, and comprising a relatively low powered processor;a control system (112; 206; 306) receiving the pressure data and real time clock readings, and providing the pressure data and real time clock readings to a diagnostic application (130, 132, 134; 432) stored in the flow diagnostic system (100), the diagnostic application including:a first algorithm (440; 540; 640) calculating a difference between the pressure data and a moving average of the pressure data,a second algorithm (444; 552; 652) receiving the difference and calculating a trained data set of historical pressure data during a training mode and calculating a current pressure data set during a monitoring mode and generating diagnostic data as a function of the current pressure data set relative to the historical pressure data indicating changes in the condition of flow sensing, anda third algorithm (448; 556) generating a report (450) indicating the diagnostic data;and wherein the flow diagnostic system is arranged such that the diagnostic application runs on a processor not provided by the pressure transmitter that is high powered relative to the low powered processor provided by the pressure transmitter.
- The flow diagnostic system of Claim 1 wherein the diagnostic application is stored in the control system (112; 206; 306).
- The flow diagnostic system of Claim 1 or 2 wherein the trained data set comprises statistical data or wherein the trained data set of historical data comprises power spectral density of the difference.
- The flow diagnostic system of any of Claims 1 to 3 wherein the diagnostic data indicates a real time condition of a pressure generator including a primary element (106; 202; 302) and impulse lines (104; 201; 301).
- The flow diagnostic system of any of Claims 1 to 4 further comprising a signal preprocessor algorithm that provides an output to a signal evaluator in the first difference algorithm.
- A method of using a flow diagnostic system (100) coupled to a primary flow sensing element (106; 202; 302) via impulse lines (104; 201; 301), the method comprising:using a pressure transmitter (102; 200; 300) of the flow diagnostic system (100), that is coupled to the impulse lines (104; 201; 301) and includes a relatively low powered processor, to generate digital pressure data representing pressure and to provide real time clock readings associated with the digital pressure data;using a control system (112; 206; 306) of the flow diagnostic system (100) to receive the pressure data and real time clock readings, and to provide the pressure data and real time clock readings to a diagnostic application (130, 132, 134; 432) stored in the flow diagnostic system (100),using a first algorithm (440; 540; 640) of the diagnostic application to calculate a difference between the pressure data and a moving average of the pressure data,using a second algorithm (444; 552; 652) of the diagnostic application to receive the difference and to calculate a trained data set of historical pressure data during a training mode and to calculate a current pressure data set during a monitoring mode and to generate diagnostic data as a function of the current pressure data set relative to the historical pressure data indicating changes in the condition of flow sensing, andusing a third algorithm (448; 556) of the diagnostic application to generate a report (450) indicating the diagnostic data; andwherein the flow diagnostic system is arranged such that the diagnostic application runs on a processor not provided by the pressure transmitter that is high powered relative to the low powered processor provided by the pressure transmitter.
- The method of Claim 6 comprising using the diagnostic application that is stored in the control system (112; 206; 306).
- The method of Claim 6 or 7 comprising either using the trained data set that comprises statistical data or using the trained data set of historical data that comprises power spectral density of the difference.
- The method of any of Claims 6 to 8 comprising generating the diagnostic data to indicate a real time condition of a pressure generator including a primary element (106; 202; 302) and impulse lines (104; 201; 301).
- The method of any of Claims 6 to 9 comprising using a signal preprocessor algorithm to provide an output to a signal evaluator in the first difference algorithm.
Applications Claiming Priority (3)
| Application Number | Priority Date | Filing Date | Title |
|---|---|---|---|
| US09/852,102 US6907383B2 (en) | 1996-03-28 | 2001-05-09 | Flow diagnostic system |
| US852102 | 2001-05-09 | ||
| PCT/US2002/014934 WO2002090894A1 (en) | 2001-05-09 | 2002-05-08 | Flow diagnostic system |
Publications (2)
| Publication Number | Publication Date |
|---|---|
| EP1407233A1 EP1407233A1 (en) | 2004-04-14 |
| EP1407233B1 true EP1407233B1 (en) | 2012-07-11 |
Family
ID=25312498
Family Applications (1)
| Application Number | Title | Priority Date | Filing Date |
|---|---|---|---|
| EP02725990A Expired - Fee Related EP1407233B1 (en) | 2001-05-09 | 2002-05-08 | Flow diagnostic system |
Country Status (5)
| Country | Link |
|---|---|
| US (1) | US6907383B2 (en) |
| EP (1) | EP1407233B1 (en) |
| JP (1) | JP4422412B2 (en) |
| CN (1) | CN100507465C (en) |
| WO (1) | WO2002090894A1 (en) |
Cited By (1)
| Publication number | Priority date | Publication date | Assignee | Title |
|---|---|---|---|---|
| WO2015131307A1 (en) * | 2014-03-03 | 2015-09-11 | Honeywell International Inc. | Technique for robust detection of plugged impulse lines |
Families Citing this family (128)
| Publication number | Priority date | Publication date | Assignee | Title |
|---|---|---|---|---|
| US7949495B2 (en) * | 1996-03-28 | 2011-05-24 | Rosemount, Inc. | Process variable transmitter with diagnostics |
| US7254518B2 (en) * | 1996-03-28 | 2007-08-07 | Rosemount Inc. | Pressure transmitter with diagnostics |
| US8290721B2 (en) | 1996-03-28 | 2012-10-16 | Rosemount Inc. | Flow measurement diagnostics |
| US7206646B2 (en) * | 1999-02-22 | 2007-04-17 | Fisher-Rosemount Systems, Inc. | Method and apparatus for performing a function in a plant using process performance monitoring with process equipment monitoring and control |
| US8044793B2 (en) * | 2001-03-01 | 2011-10-25 | Fisher-Rosemount Systems, Inc. | Integrated device alerts in a process control system |
| US8073967B2 (en) | 2002-04-15 | 2011-12-06 | Fisher-Rosemount Systems, Inc. | Web services-based communications for use with process control systems |
| EP1364263B1 (en) * | 2001-03-01 | 2005-10-26 | Fisher-Rosemount Systems, Inc. | Data sharing in a process plant |
| US7720727B2 (en) * | 2001-03-01 | 2010-05-18 | Fisher-Rosemount Systems, Inc. | Economic calculations in process control system |
| US6795799B2 (en) * | 2001-03-07 | 2004-09-21 | Qualtech Systems, Inc. | Remote diagnosis server |
| US20020191102A1 (en) * | 2001-05-31 | 2002-12-19 | Casio Computer Co., Ltd. | Light emitting device, camera with light emitting device, and image pickup method |
| US7085675B2 (en) * | 2002-02-06 | 2006-08-01 | The University Of Chicago | Subband domain signal validation |
| DE10231266A1 (en) * | 2002-07-10 | 2004-01-22 | Fagerdala Deutschland Gmbh | Monitoring procedures for production machines |
| DE10254053B4 (en) * | 2002-11-19 | 2016-12-22 | Endress + Hauser Flowtec Ag | Method and device for determining and / or monitoring a volume and / or mass flow |
| US20040111237A1 (en) * | 2002-12-04 | 2004-06-10 | Abb Inc. | Method for estimating residual life of industrial equipment |
| DE10305102A1 (en) * | 2003-02-07 | 2004-08-26 | Siemens Ag | Microfluidic device |
| US6843139B2 (en) * | 2003-03-12 | 2005-01-18 | Rosemount Inc. | Flow instrument with multisensors |
| US6813588B1 (en) * | 2003-03-31 | 2004-11-02 | Honeywell International Inc. | Control system and method for detecting plugging in differential pressure cells |
| US7526802B2 (en) * | 2003-05-16 | 2009-04-28 | Fisher-Rosemount Systems, Inc. | Memory authentication for intrinsically safe field maintenance tools |
| US8021303B2 (en) * | 2003-06-12 | 2011-09-20 | Bracco Research Sa | System for extracting morphological information through a perfusion assessment process |
| KR101025490B1 (en) * | 2003-06-12 | 2011-04-04 | 브라코 인터내셔날 비.브이. | Blood flow estimates through replenishment curve fitting in untrasound contrast imaging |
| WO2005003693A2 (en) | 2003-06-24 | 2005-01-13 | Cidra Corporation | System of distributed configurable flowmeters |
| US7231305B2 (en) * | 2003-08-07 | 2007-06-12 | Schlumberger Technology Corporation | Flow rate determination |
| CN1879117A (en) * | 2003-09-11 | 2006-12-13 | 法格电子公司 | Identification card manufacturing system supply ordering and diagnostic report |
| DE10344088B4 (en) * | 2003-09-23 | 2012-08-02 | Samson Aktiengesellschaft | Function testing device for a field device and method for functional testing of a field device and field device |
| WO2005078237A1 (en) * | 2004-02-05 | 2005-08-25 | Rosemount Inc. | Annulus plugging detection using a pressure transmitter in gas-lift oil production |
| US7234084B2 (en) | 2004-02-18 | 2007-06-19 | Emerson Process Management | System and method for associating a DLPDU received by an interface chip with a data measurement made by an external circuit |
| US7058089B2 (en) * | 2004-02-18 | 2006-06-06 | Rosemount, Inc. | System and method for maintaining a common sense of time on a network segment |
| WO2005083539A1 (en) * | 2004-02-28 | 2005-09-09 | Abb Research Ltd. | Process control system and method for operating a system of this type |
| CN1954138B (en) * | 2004-03-02 | 2011-02-16 | 罗斯蒙德公司 | Process device with improved power generation |
| US7451003B2 (en) * | 2004-03-04 | 2008-11-11 | Falconeer Technologies Llc | Method and system of monitoring, sensor validation and predictive fault analysis |
| US8538560B2 (en) * | 2004-04-29 | 2013-09-17 | Rosemount Inc. | Wireless power and communication unit for process field devices |
| US8145180B2 (en) | 2004-05-21 | 2012-03-27 | Rosemount Inc. | Power generation for process devices |
| US7536274B2 (en) * | 2004-05-28 | 2009-05-19 | Fisher-Rosemount Systems, Inc. | System and method for detecting an abnormal situation associated with a heater |
| US20050267709A1 (en) * | 2004-05-28 | 2005-12-01 | Fisher-Rosemount Systems, Inc. | System and method for detecting an abnormal situation associated with a heater |
| US8160535B2 (en) * | 2004-06-28 | 2012-04-17 | Rosemount Inc. | RF adapter for field device |
| US7262693B2 (en) | 2004-06-28 | 2007-08-28 | Rosemount Inc. | Process field device with radio frequency communication |
| US20060074598A1 (en) * | 2004-09-10 | 2006-04-06 | Emigholz Kenneth F | Application of abnormal event detection technology to hydrocracking units |
| US7349746B2 (en) * | 2004-09-10 | 2008-03-25 | Exxonmobil Research And Engineering Company | System and method for abnormal event detection in the operation of continuous industrial processes |
| US7424395B2 (en) * | 2004-09-10 | 2008-09-09 | Exxonmobil Research And Engineering Company | Application of abnormal event detection technology to olefins recovery trains |
| US7567887B2 (en) * | 2004-09-10 | 2009-07-28 | Exxonmobil Research And Engineering Company | Application of abnormal event detection technology to fluidized catalytic cracking unit |
| US7173539B2 (en) * | 2004-09-30 | 2007-02-06 | Florida Power And Light Company | Condition assessment system and method |
| EP1833373B1 (en) * | 2004-12-23 | 2015-12-16 | Bracco Suisse SA | A perfusion assessment method and system based on bolus administration |
| US7680460B2 (en) * | 2005-01-03 | 2010-03-16 | Rosemount Inc. | Wireless process field device diagnostics |
| ATE441140T1 (en) * | 2005-02-15 | 2009-09-15 | Abb Research Ltd | DIAGNOSTIC DEVICE FOR A PROCESS CONTROL SYSTEM |
| US9184364B2 (en) * | 2005-03-02 | 2015-11-10 | Rosemount Inc. | Pipeline thermoelectric generator assembly |
| US7222049B2 (en) * | 2005-03-11 | 2007-05-22 | Rosemount, Inc. | User-viewable relative diagnostic output |
| US7577543B2 (en) * | 2005-03-11 | 2009-08-18 | Honeywell International Inc. | Plugged impulse line detection |
| EP1872184B1 (en) * | 2005-04-04 | 2011-05-25 | Fisher-Rosemount Systems, Inc. | Statistical processing method for detection of abnormal situations |
| US9201420B2 (en) | 2005-04-08 | 2015-12-01 | Rosemount, Inc. | Method and apparatus for performing a function in a process plant using monitoring data with criticality evaluation data |
| US8005647B2 (en) | 2005-04-08 | 2011-08-23 | Rosemount, Inc. | Method and apparatus for monitoring and performing corrective measures in a process plant using monitoring data with corrective measures data |
| DE102005024385A1 (en) * | 2005-05-27 | 2006-11-30 | Siemens Ag | Method for monitoring an automated industrial plant |
| US8112565B2 (en) | 2005-06-08 | 2012-02-07 | Fisher-Rosemount Systems, Inc. | Multi-protocol field device interface with automatic bus detection |
| WO2006136036A1 (en) * | 2005-06-21 | 2006-12-28 | Abb Research Ltd | Diagnostic device for use in process control system |
| US8452255B2 (en) * | 2005-06-27 | 2013-05-28 | Rosemount Inc. | Field device with dynamically adjustable power consumption radio frequency communication |
| US7835295B2 (en) * | 2005-07-19 | 2010-11-16 | Rosemount Inc. | Interface module with power over Ethernet function |
| US7289863B2 (en) * | 2005-08-18 | 2007-10-30 | Brooks Automation, Inc. | System and method for electronic diagnostics of a process vacuum environment |
| US20070068225A1 (en) | 2005-09-29 | 2007-03-29 | Brown Gregory C | Leak detector for process valve |
| DE102005062422A1 (en) * | 2005-12-27 | 2007-07-05 | Vega Grieshaber Kg | Circuit arrangement for field device, has short-circuit current limiting unit that is arranged outside of useful signal path, where circuit arrangement is designed to transmit useful signal from input to output along useful signal path |
| DE102006004582B4 (en) * | 2006-02-01 | 2010-08-19 | Siemens Ag | Procedure for diagnosing clogging of a pulse line in a pressure transmitter and pressure transmitter |
| US7761172B2 (en) * | 2006-03-21 | 2010-07-20 | Exxonmobil Research And Engineering Company | Application of abnormal event detection (AED) technology to polymers |
| JP4970820B2 (en) * | 2006-03-27 | 2012-07-11 | 横河電機株式会社 | Pressure guiding tube clogging detection apparatus and pressure guiding tube clogging detection method |
| US8870742B2 (en) | 2006-04-06 | 2014-10-28 | Ethicon Endo-Surgery, Inc. | GUI for an implantable restriction device and a data logger |
| US7720641B2 (en) * | 2006-04-21 | 2010-05-18 | Exxonmobil Research And Engineering Company | Application of abnormal event detection technology to delayed coking unit |
| US8032234B2 (en) * | 2006-05-16 | 2011-10-04 | Rosemount Inc. | Diagnostics in process control and monitoring systems |
| US7913566B2 (en) * | 2006-05-23 | 2011-03-29 | Rosemount Inc. | Industrial process device utilizing magnetic induction |
| EP2044406B1 (en) * | 2006-07-20 | 2011-11-30 | Siemens Aktiengesellschaft | Method for the diagnosis of a blockage of an impulse line in a pressure measurement transducer, and pressure measurement transducer |
| US7953501B2 (en) | 2006-09-25 | 2011-05-31 | Fisher-Rosemount Systems, Inc. | Industrial process control loop monitor |
| US8788070B2 (en) | 2006-09-26 | 2014-07-22 | Rosemount Inc. | Automatic field device service adviser |
| US8188359B2 (en) * | 2006-09-28 | 2012-05-29 | Rosemount Inc. | Thermoelectric generator assembly for field process devices |
| US20080120060A1 (en) * | 2006-09-29 | 2008-05-22 | Fisher-Rosemount Systems, Inc. | Detection of catalyst losses in a fluid catalytic cracker for use in abnormal situation prevention |
| JP2010505121A (en) | 2006-09-29 | 2010-02-18 | ローズマウント インコーポレイテッド | Magnetic flow meter with verification |
| US7480577B1 (en) | 2007-02-21 | 2009-01-20 | Murray F Feller | Multiple sensor flow meter |
| EP2162809A2 (en) * | 2007-06-13 | 2010-03-17 | Fisher-Rosemount Systems, Inc. | Improved functionality for handheld field maintenance tools |
| EP2179422B1 (en) * | 2007-07-20 | 2019-04-17 | Rosemount Inc. | Pressure diagnostic for rotary equipment |
| US7770459B2 (en) * | 2007-07-20 | 2010-08-10 | Rosemount Inc. | Differential pressure diagnostic for process fluid pulsations |
| US8898036B2 (en) | 2007-08-06 | 2014-11-25 | Rosemount Inc. | Process variable transmitter with acceleration sensor |
| US8648860B2 (en) * | 2007-08-06 | 2014-02-11 | Csi Technology, Inc. | Graphics tools for interactive analysis of three-dimensional machine data |
| US8301676B2 (en) | 2007-08-23 | 2012-10-30 | Fisher-Rosemount Systems, Inc. | Field device with capability of calculating digital filter coefficients |
| US7702401B2 (en) | 2007-09-05 | 2010-04-20 | Fisher-Rosemount Systems, Inc. | System for preserving and displaying process control data associated with an abnormal situation |
| US8055479B2 (en) * | 2007-10-10 | 2011-11-08 | Fisher-Rosemount Systems, Inc. | Simplified algorithm for abnormal situation prevention in load following applications including plugged line diagnostics in a dynamic process |
| WO2009154748A2 (en) | 2008-06-17 | 2009-12-23 | Rosemount Inc. | Rf adapter for field device with low voltage intrinsic safety clamping |
| US8250924B2 (en) | 2008-04-22 | 2012-08-28 | Rosemount Inc. | Industrial process device utilizing piezoelectric transducer |
| US7756678B2 (en) * | 2008-05-29 | 2010-07-13 | General Electric Company | System and method for advanced condition monitoring of an asset system |
| JP5255698B2 (en) | 2008-06-17 | 2013-08-07 | ローズマウント インコーポレイテッド | Wireless adapter for field devices with variable voltage drop |
| CN102084626B (en) | 2008-06-17 | 2013-09-18 | 罗斯蒙德公司 | RF adapter for field device with loop current bypass |
| US8929948B2 (en) | 2008-06-17 | 2015-01-06 | Rosemount Inc. | Wireless communication adapter for field devices |
| US8694060B2 (en) | 2008-06-17 | 2014-04-08 | Rosemount Inc. | Form factor and electromagnetic interference protection for process device wireless adapters |
| US7977924B2 (en) * | 2008-11-03 | 2011-07-12 | Rosemount Inc. | Industrial process power scavenging device and method of deriving process device power from an industrial process |
| US8942929B2 (en) | 2008-12-19 | 2015-01-27 | Mccrometer, Inc. | Method for field-measuring fluid flow meters |
| US7921734B2 (en) | 2009-05-12 | 2011-04-12 | Rosemount Inc. | System to detect poor process ground connections |
| US20100318007A1 (en) * | 2009-06-10 | 2010-12-16 | O'brien Donald J | Electromechanical tactile stimulation devices and methods |
| US9674976B2 (en) | 2009-06-16 | 2017-06-06 | Rosemount Inc. | Wireless process communication adapter with improved encapsulation |
| US8626087B2 (en) | 2009-06-16 | 2014-01-07 | Rosemount Inc. | Wire harness for field devices used in a hazardous locations |
| DE102009045372A1 (en) | 2009-10-06 | 2011-04-07 | Endress + Hauser Gmbh + Co. Kg | Flow measuring arrangement and method for their function monitoring |
| US9606531B2 (en) * | 2009-12-01 | 2017-03-28 | Emerson Process Management Power & Water Solutions, Inc. | Decentralized industrial process simulation system |
| US8862250B2 (en) | 2010-05-07 | 2014-10-14 | Exxonmobil Research And Engineering Company | Integrated expert system for identifying abnormal events in an industrial plant |
| US8645306B2 (en) * | 2010-07-02 | 2014-02-04 | Idexx Laboratories, Inc. | Automated calibration method and system for a diagnostic analyzer |
| DE102010038573B4 (en) * | 2010-07-28 | 2023-08-31 | Endress+Hauser SE+Co. KG | Measurement method for a measurand dependent on auxiliary measurands |
| US10761524B2 (en) | 2010-08-12 | 2020-09-01 | Rosemount Inc. | Wireless adapter with process diagnostics |
| US9207670B2 (en) | 2011-03-21 | 2015-12-08 | Rosemount Inc. | Degrading sensor detection implemented within a transmitter |
| EP2691901B1 (en) * | 2011-03-28 | 2016-08-10 | AVL Test Systems, Inc. | Deconvolution method for emissions measurement |
| US9927788B2 (en) | 2011-05-19 | 2018-03-27 | Fisher-Rosemount Systems, Inc. | Software lockout coordination between a process control system and an asset management system |
| CN102330886A (en) * | 2011-07-26 | 2012-01-25 | 广东联塑科技实业有限公司 | System capable of automatically informing user of pipeline fault |
| US9310794B2 (en) | 2011-10-27 | 2016-04-12 | Rosemount Inc. | Power supply for industrial process field device |
| US9052703B2 (en) * | 2012-02-02 | 2015-06-09 | Emerson Process Management Power & Water Solutions, Inc. | Enhanced sequential method for solving pressure/flow network parameters in a real-time distributed industrial process simulation system |
| US9052240B2 (en) | 2012-06-29 | 2015-06-09 | Rosemount Inc. | Industrial process temperature transmitter with sensor stress diagnostics |
| US9602122B2 (en) | 2012-09-28 | 2017-03-21 | Rosemount Inc. | Process variable measurement noise diagnostic |
| JP6434419B2 (en) | 2012-11-30 | 2018-12-05 | インペリアル イノベ−ションズ リミテッド | Apparatus, method and system for monitoring a fluid delivery conduit network |
| US9506785B2 (en) | 2013-03-15 | 2016-11-29 | Rain Bird Corporation | Remote flow rate measuring |
| DE102014000276A1 (en) * | 2014-01-09 | 2015-07-09 | Fresenius Medical Care Deutschland Gmbh | Monitoring system and method for fluid-carrying production system |
| EP2963405B1 (en) * | 2014-07-03 | 2019-12-11 | Kamstrup A/S | Pressure sensor device for utility network |
| US10288548B2 (en) * | 2015-04-17 | 2019-05-14 | Hamilton Sundstrand Corporation | Wavelet-based analysis for fouling diagnosis of an aircraft heat exchanger |
| US9860676B2 (en) * | 2015-04-21 | 2018-01-02 | Rosemount Inc. | Process instrumentation with wireless configuration |
| BR122023003434B1 (en) * | 2016-02-23 | 2024-01-30 | John Crane Uk Ltd | MECHANICAL SEAL SYSTEM CONFIGURED TO AUTONOMOUSLY DETECT A LOSS OF LUBRICATION WITHIN A SLIDING SEAL INTERFACE OF A MECHANICAL SEAL, MECHANICAL SEAL SYSTEM THAT HAS A CUSTOMIZABLE PREDICTIVE DIAGNOSTIC SUBSYSTEM CONFIGURED TO BE ADAPTED TO SUIT YOUR NEEDS INDIVIDUAL CUSTOMER AGES, CONDITIONS PARTICULAR ENVIRONMENTAL AND/OR APPLICATION SPECIFIC, AND MECHANICAL SEALING SYSTEM CONFIGURED TO DETECT OPERATING CONDITIONS AND PROVIDE REAL-TIME INTEGRITY ASSESSMENTS TO A USER DURING OPERATION |
| CN105590538B (en) * | 2016-02-27 | 2017-07-14 | 山东大学(威海) | A kind of gas flow measurement experimental provision |
| WO2018013857A1 (en) | 2016-07-13 | 2018-01-18 | Rain Bird Corporation | Flow sensor |
| DE102016114846A1 (en) * | 2016-08-10 | 2018-02-15 | Endress+Hauser Gmbh+Co. Kg | Differential pressure measuring arrangement and method for detecting clogged differential pressure lines |
| US10031004B2 (en) * | 2016-12-15 | 2018-07-24 | Mks Instruments, Inc. | Methods and apparatus for wide range mass flow verification |
| CN106679741B (en) * | 2016-12-20 | 2019-06-04 | 重庆川仪自动化股份有限公司 | Processing method and system based on vortex-shedding meter anti-jamming signal |
| EP3242035B1 (en) * | 2016-12-28 | 2021-08-18 | Grundfos Holding A/S | Method for operating at least one pump unit of a plurality of pump units |
| US10473494B2 (en) | 2017-10-24 | 2019-11-12 | Rain Bird Corporation | Flow sensor |
| ES2930200T3 (en) * | 2018-06-08 | 2022-12-07 | Panasonic Ip Man Co Ltd | gas safety device |
| US11156584B2 (en) | 2018-09-21 | 2021-10-26 | Rosemount Inc. | Predictive lifespan of analytical sensors |
| US11662242B2 (en) | 2018-12-31 | 2023-05-30 | Rain Bird Corporation | Flow sensor gauge |
| WO2021061612A1 (en) * | 2019-09-27 | 2021-04-01 | ElectroSea, LLC | System and method for performing diagnostics of a water system on-board a watercraft |
| CN110487364A (en) * | 2019-09-29 | 2019-11-22 | 中国特种设备检测研究院 | A kind of multi-functional flowmeter integrated correction platform |
| US20220308602A1 (en) * | 2021-03-25 | 2022-09-29 | Romet Limited | Fluid pressure monitoring system using flow data |
| US20230332976A1 (en) * | 2022-04-14 | 2023-10-19 | Professional Flexible Technologies Inc. | Systems and methods for improved pipeline leak detection |
Citations (2)
| Publication number | Priority date | Publication date | Assignee | Title |
|---|---|---|---|---|
| US5469749A (en) * | 1991-09-20 | 1995-11-28 | Hitachi, Ltd. | Multiple-function fluid measuring and transmitting apparatus |
| WO2000050851A1 (en) * | 1999-02-25 | 2000-08-31 | Rosemount Inc. | Flow measurement with diagnostics |
Family Cites Families (126)
| Publication number | Priority date | Publication date | Assignee | Title |
|---|---|---|---|---|
| US3096434A (en) | 1961-11-28 | 1963-07-02 | Daniel Orifice Fitting Company | Multiple integration flow computer |
| US3404264A (en) | 1965-07-19 | 1968-10-01 | American Meter Co | Telemetering system for determining rate of flow |
| US3468164A (en) | 1966-08-26 | 1969-09-23 | Westinghouse Electric Corp | Open thermocouple detection apparatus |
| GB1224904A (en) | 1968-08-09 | 1971-03-10 | John Stewart Simpson Stewart | Improvements in and relating to electromedical apparatus |
| US3590370A (en) | 1969-04-09 | 1971-06-29 | Leeds & Northrup Co | Method and apparatus for detecting the open-circuit condition of a thermocouple by sending a pulse through the thermocouple and a reactive element in series |
| US3701280A (en) | 1970-03-18 | 1972-10-31 | Daniel Ind Inc | Method and apparatus for determining the supercompressibility factor of natural gas |
| US3691842A (en) | 1970-09-08 | 1972-09-19 | Beckman Instruments Inc | Differential pressure transducer |
| US3688190A (en) | 1970-09-25 | 1972-08-29 | Beckman Instruments Inc | Differential capacitance circuitry for differential pressure measuring instruments |
| US3849637A (en) | 1973-05-22 | 1974-11-19 | Combustion Eng | Reactor megawatt demand setter |
| US3855858A (en) | 1973-08-01 | 1974-12-24 | V Cushing | Self synchronous noise rejection circuit for fluid velocity meter |
| USRE29383E (en) | 1974-01-10 | 1977-09-06 | Process Systems, Inc. | Digital fluid flow rate measurement or control system |
| US3952759A (en) | 1974-08-14 | 1976-04-27 | M & J Valve Company | Liquid line break control system and method |
| US3973184A (en) | 1975-01-27 | 1976-08-03 | Leeds & Northrup Company | Thermocouple circuit detector for simultaneous analog trend recording and analog to digital conversion |
| US4058975A (en) | 1975-12-08 | 1977-11-22 | General Electric Company | Gas turbine temperature sensor validation apparatus and method |
| US4099413A (en) | 1976-06-25 | 1978-07-11 | Yokogawa Electric Works, Ltd. | Thermal noise thermometer |
| US4102199A (en) | 1976-08-26 | 1978-07-25 | Megasystems, Inc. | RTD measurement system |
| US4122719A (en) | 1977-07-08 | 1978-10-31 | Environmental Systems Corporation | System for accurate measurement of temperature |
| JPS54111050A (en) | 1978-02-21 | 1979-08-31 | Toyota Motor Corp | Automatic speed changer |
| US4250490A (en) | 1979-01-19 | 1981-02-10 | Rosemount Inc. | Two wire transmitter for converting a varying signal from a remote reactance sensor to a DC current signal |
| US4249164A (en) | 1979-05-14 | 1981-02-03 | Tivy Vincent V | Flow meter |
| US4279013A (en) | 1979-10-31 | 1981-07-14 | The Valeron Corporation | Machine process controller |
| US4337516A (en) | 1980-06-26 | 1982-06-29 | United Technologies Corporation | Sensor fault detection by activity monitoring |
| US4417312A (en) | 1981-06-08 | 1983-11-22 | Worcester Controls Corporation | Electronic controller for valve actuators |
| US4399824A (en) | 1981-10-05 | 1983-08-23 | Air-Shields, Inc. | Apparatus for detecting probe dislodgement |
| US4571689A (en) | 1982-10-20 | 1986-02-18 | The United States Of America As Represented By The Secretary Of The Air Force | Multiple thermocouple testing device |
| US4668473A (en) | 1983-04-25 | 1987-05-26 | The Babcock & Wilcox Company | Control system for ethylene polymerization reactor |
| US4530234A (en) | 1983-06-30 | 1985-07-23 | Mobil Oil Corporation | Method and system for measuring properties of fluids |
| JPH0619666B2 (en) | 1983-06-30 | 1994-03-16 | 富士通株式会社 | Failure diagnosis processing method |
| US4707796A (en) | 1983-10-19 | 1987-11-17 | Calabro Salvatore R | Reliability and maintainability indicator |
| US4686638A (en) * | 1983-11-04 | 1987-08-11 | Kabushiki Kaisha Kosumo Keiki | Leakage inspection method with object type compensation |
| DE3583057D1 (en) | 1984-03-31 | 1991-07-11 | Barmag Barmer Maschf | METHOD FOR CENTRALLY DETECTING MEASURED VALUES FROM A VARIETY OF MEASURING POINTS. |
| US4649515A (en) | 1984-04-30 | 1987-03-10 | Westinghouse Electric Corp. | Methods and apparatus for system fault diagnosis and control |
| US4517468A (en) | 1984-04-30 | 1985-05-14 | Westinghouse Electric Corp. | Diagnostic system and method |
| US4642782A (en) | 1984-07-31 | 1987-02-10 | Westinghouse Electric Corp. | Rule based diagnostic system with dynamic alteration capability |
| US4644479A (en) | 1984-07-31 | 1987-02-17 | Westinghouse Electric Corp. | Diagnostic apparatus |
| JPH0734162B2 (en) | 1985-02-06 | 1995-04-12 | 株式会社日立製作所 | Analogical control method |
| US5179540A (en) | 1985-11-08 | 1993-01-12 | Harris Corporation | Programmable chip enable logic function |
| US4807151A (en) | 1986-04-11 | 1989-02-21 | Purdue Research Foundation | Electrical technique for correcting bridge type mass air flow rate sensor errors resulting from ambient temperature variations |
| GB8611360D0 (en) | 1986-05-09 | 1986-06-18 | Eaton Williams Raymond H | Air condition monitor unit |
| US4736367A (en) | 1986-12-22 | 1988-04-05 | Chrysler Motors Corporation | Smart control and sensor devices single wire bus multiplex system |
| US5005142A (en) | 1987-01-30 | 1991-04-02 | Westinghouse Electric Corp. | Smart sensor system for diagnostic monitoring |
| US4736763A (en) * | 1987-02-26 | 1988-04-12 | Britton George L | Automatic device for the detection and shutoff of unwanted liquid flow in pipes |
| EP0308455B1 (en) | 1987-04-02 | 1993-01-27 | Eftag Entstaubungs- Und Fördertechnik Ag | Circuit arrangement for evaluating a signal produced by a semiconductor sensor |
| US4988990A (en) | 1989-05-09 | 1991-01-29 | Rosemount Inc. | Dual master implied token communication system |
| US5122794A (en) | 1987-08-11 | 1992-06-16 | Rosemount Inc. | Dual master implied token communication system |
| US4873655A (en) | 1987-08-21 | 1989-10-10 | Board Of Regents, The University Of Texas System | Sensor conditioning method and apparatus |
| US4907167A (en) | 1987-09-30 | 1990-03-06 | E. I. Du Pont De Nemours And Company | Process control system with action logging |
| US4831564A (en) | 1987-10-22 | 1989-05-16 | Suga Test Instruments Co., Ltd. | Apparatus for estimating and displaying remainder of lifetime of xenon lamps |
| US4818994A (en) | 1987-10-22 | 1989-04-04 | Rosemount Inc. | Transmitter with internal serial bus |
| US5274572A (en) | 1987-12-02 | 1993-12-28 | Schlumberger Technology Corporation | Method and apparatus for knowledge-based signal monitoring and analysis |
| US5193143A (en) | 1988-01-12 | 1993-03-09 | Honeywell Inc. | Problem state monitoring |
| US4841286A (en) | 1988-02-08 | 1989-06-20 | Honeywell Inc. | Apparatus and method for detection of an open thermocouple in a process control network |
| US4924418A (en) | 1988-02-10 | 1990-05-08 | Dickey-John Corporation | Universal monitor |
| JPH0774961B2 (en) | 1988-04-07 | 1995-08-09 | 株式会社日立製作所 | Auto tuning PID controller |
| US4926364A (en) * | 1988-07-25 | 1990-05-15 | Westinghouse Electric Corp. | Method and apparatus for determining weighted average of process variable |
| US4964125A (en) | 1988-08-19 | 1990-10-16 | Hughes Aircraft Company | Method and apparatus for diagnosing faults |
| US5197328A (en) | 1988-08-25 | 1993-03-30 | Fisher Controls International, Inc. | Diagnostic apparatus and method for fluid control valves |
| US5067099A (en) | 1988-11-03 | 1991-11-19 | Allied-Signal Inc. | Methods and apparatus for monitoring system performance |
| US5099436A (en) | 1988-11-03 | 1992-03-24 | Allied-Signal Inc. | Methods and apparatus for performing system fault diagnosis |
| EP0369489A3 (en) | 1988-11-18 | 1991-11-27 | Omron Corporation | Sensor controller system |
| JP2714091B2 (en) | 1989-01-09 | 1998-02-16 | 株式会社日立製作所 | Field instrument |
| US5098197A (en) | 1989-01-30 | 1992-03-24 | The United States Of America As Represented By The United States Department Of Energy | Optical Johnson noise thermometry |
| US5089979A (en) | 1989-02-08 | 1992-02-18 | Basic Measuring Instruments | Apparatus for digital calibration of detachable transducers |
| US5081598A (en) | 1989-02-21 | 1992-01-14 | Westinghouse Electric Corp. | Method for associating text in automatic diagnostic system to produce recommended actions automatically |
| US4939753A (en) | 1989-02-24 | 1990-07-03 | Rosemount Inc. | Time synchronization of control networks |
| JPH0692914B2 (en) | 1989-04-14 | 1994-11-16 | 株式会社日立製作所 | Equipment / facility condition diagnosis system |
| US5089984A (en) | 1989-05-15 | 1992-02-18 | Allen-Bradley Company, Inc. | Adaptive alarm controller changes multiple inputs to industrial controller in order for state word to conform with stored state word |
| US4934196A (en) | 1989-06-02 | 1990-06-19 | Micro Motion, Inc. | Coriolis mass flow rate meter having a substantially increased noise immunity |
| US5269311A (en) | 1989-08-29 | 1993-12-14 | Abbott Laboratories | Method for compensating errors in a pressure transducer |
| US5293585A (en) | 1989-08-31 | 1994-03-08 | Kabushiki Kaisha Toshiba | Industrial expert system |
| JP2656637B2 (en) | 1989-11-22 | 1997-09-24 | 株式会社日立製作所 | Process control system and power plant process control system |
| JPH03166601A (en) | 1989-11-27 | 1991-07-18 | Hitachi Ltd | Symbolizing device and process controller and control supporting device using the symbolizing device |
| US5019760A (en) | 1989-12-07 | 1991-05-28 | Electric Power Research Institute | Thermal life indicator |
| CA2031765C (en) | 1989-12-08 | 1996-02-20 | Masahide Nomura | Method and system for performing control conforming with characteristics of controlled system |
| US5111531A (en) | 1990-01-08 | 1992-05-05 | Automation Technology, Inc. | Process control using neural network |
| US5235527A (en) | 1990-02-09 | 1993-08-10 | Toyota Jidosha Kabushiki Kaisha | Method for diagnosing abnormality of sensor |
| US5134574A (en) | 1990-02-27 | 1992-07-28 | The Foxboro Company | Performance control apparatus and method in a processing plant |
| US5122976A (en) | 1990-03-12 | 1992-06-16 | Westinghouse Electric Corp. | Method and apparatus for remotely controlling sensor processing algorithms to expert sensor diagnoses |
| US5053815A (en) | 1990-04-09 | 1991-10-01 | Eastman Kodak Company | Reproduction apparatus having real time statistical process control |
| US5212765A (en) | 1990-08-03 | 1993-05-18 | E. I. Du Pont De Nemours & Co., Inc. | On-line training neural network system for process control |
| US5197114A (en) | 1990-08-03 | 1993-03-23 | E. I. Du Pont De Nemours & Co., Inc. | Computer neural network regulatory process control system and method |
| US5282261A (en) | 1990-08-03 | 1994-01-25 | E. I. Du Pont De Nemours And Co., Inc. | Neural network process measurement and control |
| US5142612A (en) | 1990-08-03 | 1992-08-25 | E. I. Du Pont De Nemours & Co. (Inc.) | Computer neural network supervisory process control system and method |
| US5224203A (en) | 1990-08-03 | 1993-06-29 | E. I. Du Pont De Nemours & Co., Inc. | On-line process control neural network using data pointers |
| US5167009A (en) | 1990-08-03 | 1992-11-24 | E. I. Du Pont De Nemours & Co. (Inc.) | On-line process control neural network using data pointers |
| US5121467A (en) | 1990-08-03 | 1992-06-09 | E.I. Du Pont De Nemours & Co., Inc. | Neural network/expert system process control system and method |
| US5175678A (en) | 1990-08-15 | 1992-12-29 | Elsag International B.V. | Method and procedure for neural control of dynamic processes |
| US5340271A (en) * | 1990-08-18 | 1994-08-23 | Rolls-Royce Plc | Flow control method and means |
| US5130936A (en) | 1990-09-14 | 1992-07-14 | Arinc Research Corporation | Method and apparatus for diagnostic testing including a neural network for determining testing sufficiency |
| US5367612A (en) | 1990-10-30 | 1994-11-22 | Science Applications International Corporation | Neurocontrolled adaptive process control system |
| US5265031A (en) | 1990-11-26 | 1993-11-23 | Praxair Technology, Inc. | Diagnostic gas monitoring process utilizing an expert system |
| US5214582C1 (en) | 1991-01-30 | 2001-06-26 | Edge Diagnostic Systems | Interactive diagnostic system for an automobile vehicle and method |
| US5143452A (en) | 1991-02-04 | 1992-09-01 | Rockwell International Corporation | System for interfacing a single sensor unit with multiple data processing modules |
| US5137370A (en) | 1991-03-25 | 1992-08-11 | Delta M Corporation | Thermoresistive sensor system |
| US5357449A (en) | 1991-04-26 | 1994-10-18 | Texas Instruments Incorporated | Combining estimates using fuzzy sets |
| US5317520A (en) | 1991-07-01 | 1994-05-31 | Moore Industries International Inc. | Computerized remote resistance measurement system with fault detection |
| US5365787A (en) | 1991-10-02 | 1994-11-22 | Monitoring Technology Corp. | Noninvasive method and apparatus for determining resonance information for rotating machinery components and for anticipating component failure from changes therein |
| US5327357A (en) | 1991-12-03 | 1994-07-05 | Praxair Technology, Inc. | Method of decarburizing molten metal in the refining of steel using neural networks |
| US5365423A (en) | 1992-01-08 | 1994-11-15 | Rockwell International Corporation | Control system for distributed sensors and actuators |
| US5282131A (en) | 1992-01-21 | 1994-01-25 | Brown And Root Industrial Services, Inc. | Control system for controlling a pulp washing system using a neural network controller |
| US5349541A (en) | 1992-01-23 | 1994-09-20 | Electric Power Research Institute, Inc. | Method and apparatus utilizing neural networks to predict a specified signal value within a multi-element system |
| US5347843A (en) * | 1992-09-23 | 1994-09-20 | Korr Medical Technologies Inc. | Differential pressure flowmeter with enhanced signal processing for respiratory flow measurement |
| US5228780A (en) | 1992-10-30 | 1993-07-20 | Martin Marietta Energy Systems, Inc. | Dual-mode self-validating resistance/Johnson noise thermometer system |
| US5790413A (en) * | 1993-03-22 | 1998-08-04 | Exxon Chemical Patents Inc. | Plant parameter detection by monitoring of power spectral densities |
| US5410495A (en) * | 1993-07-20 | 1995-04-25 | Texas Instruments Incorporated | Apparatus, systems, and methods for diagnosing anomalous mass flow controller operation |
| US5361628A (en) | 1993-08-02 | 1994-11-08 | Ford Motor Company | System and method for processing test measurements collected from an internal combustion engine for diagnostic purposes |
| SG44494A1 (en) * | 1993-09-07 | 1997-12-19 | R0Semount Inc | Multivariable transmitter |
| US5764539A (en) * | 1994-01-21 | 1998-06-09 | Novartis Nutrition Ag | Non-invasive system and method for a fluid flow monitoring system |
| JP3139597B2 (en) * | 1994-04-27 | 2001-03-05 | 横河電機株式会社 | Diagnosis device for blockage of pressure guide tube in pressure measuring device |
| FR2720498B1 (en) * | 1994-05-27 | 1996-08-09 | Schlumberger Services Petrol | Multiphase flowmeter. |
| US5608650A (en) * | 1994-08-19 | 1997-03-04 | Spectrel Partners, L.L.C. | Systems and methods for testing pump flow rates |
| JPH08114638A (en) * | 1994-10-14 | 1996-05-07 | Meidensha Corp | Machinery abnormality diagnosing apparatus |
| US5817950A (en) * | 1996-01-04 | 1998-10-06 | Rosemount Inc. | Flow measurement compensation technique for use with an averaging pitot tube type primary element |
| IE76714B1 (en) * | 1996-04-19 | 1997-10-22 | Auro Environmental Ltd | Apparatus for measuring the velocity of a fluid flowing in a conduit |
| US5710370A (en) * | 1996-05-17 | 1998-01-20 | Dieterich Technology Holding Corp. | Method for calibrating a differential pressure fluid flow measuring system |
| US5708211A (en) * | 1996-05-28 | 1998-01-13 | Ohio University | Flow regime determination and flow measurement in multiphase flow pipelines |
| US5680109A (en) * | 1996-06-21 | 1997-10-21 | The Foxboro Company | Impulse line blockage detector systems and methods |
| US5828567A (en) * | 1996-11-07 | 1998-10-27 | Rosemount Inc. | Diagnostics for resistance based transmitter |
| IT1286007B1 (en) * | 1996-11-28 | 1998-06-26 | Sgs Thomson Microelectronics | FLOW METER OF A FLUID |
| JPH10198657A (en) * | 1997-01-08 | 1998-07-31 | Toshiba Corp | Signal processor |
| DE19724167C2 (en) * | 1997-06-07 | 1999-07-15 | Deutsch Zentr Luft & Raumfahrt | Method and device for determining a measured value of a target measured variable of a multi-phase flow |
| JPH11118657A (en) * | 1997-10-21 | 1999-04-30 | Cosmo Keiki:Kk | Drift correction value calculator and leakage detector equipped with calculator |
| US6327914B1 (en) * | 1998-09-30 | 2001-12-11 | Micro Motion, Inc. | Correction of coriolis flowmeter measurements due to multiphase flows |
| GB9821972D0 (en) * | 1998-10-08 | 1998-12-02 | Abb Kent Taylor Ltd | Flowmeter logging |
| US6480793B1 (en) * | 2000-10-27 | 2002-11-12 | Westinghouse Electric Company Lcl | Flow condition monitor |
| US6819292B2 (en) * | 2001-03-09 | 2004-11-16 | Arad Measuring Technologies Ltd | Meter register |
-
2001
- 2001-05-09 US US09/852,102 patent/US6907383B2/en not_active Expired - Lifetime
-
2002
- 2002-05-08 EP EP02725990A patent/EP1407233B1/en not_active Expired - Fee Related
- 2002-05-08 WO PCT/US2002/014934 patent/WO2002090894A1/en active Application Filing
- 2002-05-08 JP JP2002588106A patent/JP4422412B2/en not_active Expired - Lifetime
- 2002-05-08 CN CNB028095820A patent/CN100507465C/en not_active Expired - Fee Related
Patent Citations (2)
| Publication number | Priority date | Publication date | Assignee | Title |
|---|---|---|---|---|
| US5469749A (en) * | 1991-09-20 | 1995-11-28 | Hitachi, Ltd. | Multiple-function fluid measuring and transmitting apparatus |
| WO2000050851A1 (en) * | 1999-02-25 | 2000-08-31 | Rosemount Inc. | Flow measurement with diagnostics |
Cited By (1)
| Publication number | Priority date | Publication date | Assignee | Title |
|---|---|---|---|---|
| WO2015131307A1 (en) * | 2014-03-03 | 2015-09-11 | Honeywell International Inc. | Technique for robust detection of plugged impulse lines |
Also Published As
| Publication number | Publication date |
|---|---|
| CN1514928A (en) | 2004-07-21 |
| WO2002090894A1 (en) | 2002-11-14 |
| EP1407233A1 (en) | 2004-04-14 |
| JP4422412B2 (en) | 2010-02-24 |
| CN100507465C (en) | 2009-07-01 |
| JP2004529433A (en) | 2004-09-24 |
| US20020029130A1 (en) | 2002-03-07 |
| US6907383B2 (en) | 2005-06-14 |
Similar Documents
| Publication | Publication Date | Title |
|---|---|---|
| EP1407233B1 (en) | Flow diagnostic system | |
| US6654697B1 (en) | Flow measurement with diagnostics | |
| US7254518B2 (en) | Pressure transmitter with diagnostics | |
| EP1915660B1 (en) | Process variable transmitter with diagnostics | |
| EP1155289B1 (en) | Flow measurement with diagnostics | |
| US7010459B2 (en) | Process device diagnostics using process variable sensor signal | |
| US5956663A (en) | Signal processing technique which separates signal components in a sensor for sensor diagnostics | |
| WO2001016571A9 (en) | Prediction of error magnitude in a pressure transmitter | |
| EP2681516B1 (en) | Differential pressure based flow measurement | |
| WO2006136036A1 (en) | Diagnostic device for use in process control system |
Legal Events
| Date | Code | Title | Description |
|---|---|---|---|
| PUAI | Public reference made under article 153(3) epc to a published international application that has entered the european phase |
Free format text: ORIGINAL CODE: 0009012 |
|
| 17P | Request for examination filed |
Effective date: 20031027 |
|
| AK | Designated contracting states |
Kind code of ref document: A1 Designated state(s): AT BE CH CY DE DK ES FI FR GB GR IE IT LI LU MC NL PT SE TR |
|
| AX | Request for extension of the european patent |
Extension state: AL LT LV MK RO SI |
|
| 17Q | First examination report despatched |
Effective date: 20080623 |
|
| GRAP | Despatch of communication of intention to grant a patent |
Free format text: ORIGINAL CODE: EPIDOSNIGR1 |
|
| GRAS | Grant fee paid |
Free format text: ORIGINAL CODE: EPIDOSNIGR3 |
|
| GRAA | (expected) grant |
Free format text: ORIGINAL CODE: 0009210 |
|
| AK | Designated contracting states |
Kind code of ref document: B1 Designated state(s): DE GB |
|
| REG | Reference to a national code |
Ref country code: GB Ref legal event code: FG4D |
|
| REG | Reference to a national code |
Ref country code: DE Ref legal event code: R096 Ref document number: 60243292 Country of ref document: DE Effective date: 20120906 |
|
| PLBE | No opposition filed within time limit |
Free format text: ORIGINAL CODE: 0009261 |
|
| STAA | Information on the status of an ep patent application or granted ep patent |
Free format text: STATUS: NO OPPOSITION FILED WITHIN TIME LIMIT |
|
| 26N | No opposition filed |
Effective date: 20130412 |
|
| REG | Reference to a national code |
Ref country code: DE Ref legal event code: R097 Ref document number: 60243292 Country of ref document: DE Effective date: 20130412 |
|
| PGFP | Annual fee paid to national office [announced via postgrant information from national office to epo] |
Ref country code: GB Payment date: 20170530 Year of fee payment: 16 |
|
| PGFP | Annual fee paid to national office [announced via postgrant information from national office to epo] |
Ref country code: DE Payment date: 20180529 Year of fee payment: 17 |
|
| GBPC | Gb: european patent ceased through non-payment of renewal fee |
Effective date: 20180508 |
|
| PG25 | Lapsed in a contracting state [announced via postgrant information from national office to epo] |
Ref country code: GB Free format text: LAPSE BECAUSE OF NON-PAYMENT OF DUE FEES Effective date: 20180508 |
|
| REG | Reference to a national code |
Ref country code: DE Ref legal event code: R119 Ref document number: 60243292 Country of ref document: DE |
|
| PG25 | Lapsed in a contracting state [announced via postgrant information from national office to epo] |
Ref country code: DE Free format text: LAPSE BECAUSE OF NON-PAYMENT OF DUE FEES Effective date: 20191203 |