EP1355246A1 - Method for simulating project task risk impact - Google Patents

Method for simulating project task risk impact Download PDF

Info

Publication number
EP1355246A1
EP1355246A1 EP02405302A EP02405302A EP1355246A1 EP 1355246 A1 EP1355246 A1 EP 1355246A1 EP 02405302 A EP02405302 A EP 02405302A EP 02405302 A EP02405302 A EP 02405302A EP 1355246 A1 EP1355246 A1 EP 1355246A1
Authority
EP
European Patent Office
Prior art keywords
project
task
total
risk factor
attributes
Prior art date
Legal status (The legal status is an assumption and is not a legal conclusion. Google has not performed a legal analysis and makes no representation as to the accuracy of the status listed.)
Withdrawn
Application number
EP02405302A
Other languages
German (de)
French (fr)
Inventor
Andreas Poncet
Michal Orkisz
Current Assignee (The listed assignees may be inaccurate. Google has not performed a legal analysis and makes no representation or warranty as to the accuracy of the list.)
ABB Research Ltd Switzerland
ABB Research Ltd Sweden
Original Assignee
ABB Research Ltd Switzerland
ABB Research Ltd Sweden
Priority date (The priority date is an assumption and is not a legal conclusion. Google has not performed a legal analysis and makes no representation as to the accuracy of the date listed.)
Filing date
Publication date
Application filed by ABB Research Ltd Switzerland, ABB Research Ltd Sweden filed Critical ABB Research Ltd Switzerland
Priority to EP02405302A priority Critical patent/EP1355246A1/en
Publication of EP1355246A1 publication Critical patent/EP1355246A1/en
Withdrawn legal-status Critical Current

Links

Images

Classifications

    • GPHYSICS
    • G06COMPUTING; CALCULATING OR COUNTING
    • G06QINFORMATION AND COMMUNICATION TECHNOLOGY [ICT] SPECIALLY ADAPTED FOR ADMINISTRATIVE, COMMERCIAL, FINANCIAL, MANAGERIAL OR SUPERVISORY PURPOSES; SYSTEMS OR METHODS SPECIALLY ADAPTED FOR ADMINISTRATIVE, COMMERCIAL, FINANCIAL, MANAGERIAL OR SUPERVISORY PURPOSES, NOT OTHERWISE PROVIDED FOR
    • G06Q10/00Administration; Management
    • G06Q10/06Resources, workflows, human or project management; Enterprise or organisation planning; Enterprise or organisation modelling

Definitions

  • the invention relates to the field of project management. It relates to a method for simulating in a data processing system individual impacts of at least one first project task risk factor on at least one total project attribute.
  • Risk factors may be, e.g., product quality, technical hurdles, qualitative and quantitative fluctuation of human resources, and occurrence of external events.
  • Project management software such as Microsoft's Corporations MS Project, typically allow a fine representation of the project execution phase by decomposition into tasks or sub-tasks. These tasks are connected according to their sequential interdependency. An estimated fixed duration is assigned to each task.
  • State-of-the-art systems measure “sensitivities” with respect to risk factors by frequency of the critical path, or by correlation coefficients (e.g., of task duration with overall cost), which are the basis for mono-dimensional graphical representation (such as a Tornado diagram).
  • JP 6 124 285 describes a system which allows training of a project manager by simulation of events that affect project activities.
  • the inventive method comprises the steps of:
  • the inventive computer program is preferably recorded on a computer readable medium, and executes, when run on the computer, the method according to the invention.
  • Fig. 1 shows the structure of the inventive project task impact decomposition system, consisting of the following three modules:
  • the inventive system is an enhancement of the project duration and cost simulation engine described hereafter, which outputs total project variable risk profiles, e.g. overall duration or cost risk profile (global view).
  • the inventive system aims at zooming into a project, i.e. at assessing and discerning the impacts caused by individual task-related or general risk factors on project attributes such as project duration or project cost.
  • the system displays the impact, i.e. the criticality, of each of the projects risk-factors (local view).
  • the project duration and cost simulation engine is used to describe a project as a set of interdependent tasks whose durations are uncertain within some assumed limits, and whose completion before or after a specified deadline may carry a prescribed task bonus or penalty. It performs the following actions:
  • the number of parameters is reduced by fixing the lower and upper percentiles (e.g., to 0.05 and 0.95 respectively).
  • the latter parameters must fulfill the condition 0 ⁇ ⁇ 1 ⁇ 1 2 ⁇ ⁇ u ⁇ 1.
  • optical e.g., 5%-quantile x 1
  • realistic mode x MP
  • pessimistic e.g., 95%-quantile x u
  • the uncertain variable of interest x represents duration or cost, hence small values are associated with "good” and large values with "bad”.
  • any given probability distribution is in general described by a different set of specific parameters. They allow to compute the distribution easily though are difficult to specify by the user. Therefore these specific parameters must be fitted (either analytically or numerically) so that the resulting probability density function is consistent with the specified parameters.
  • the three user parameters (optimistic, realistic, and pessimistic) x 1 , x MP , x u - besides the lower and upper percentiles ⁇ 1 , ⁇ u - constrain the distribution parameters as follows:
  • Each project task can have an associated penalty/ bonus function. This function specifies penalty or bonus for completing a task before or after a specific deadline or depending on the task's duration.
  • the horizontal axis represents the task duration (in days), while the vertical axis represents the cost (in USD).
  • a bonus is awarded or penalty is imposed.
  • Completing the task 50 days after project start carries no bonus or penalty.
  • a bonus slope 0.5 USD/day
  • the bonus rises the sooner the task is completed.
  • a duration of more than 50 days results in a penalty.
  • the penalty rises depending on the delay.
  • the penalty rises with two different gradients.
  • a constant penalty of 40 $ is defined for a duration of 80 to 100 days.
  • a maximum penalty (cap) of 50 $ is imposed.
  • the horizontal axis represents the task completion date, while the vertical axis represents the cost (in USD).
  • a bonus is awarded or penalty is imposed.
  • This is particularly interesting in the case of multiple task dependencies, i.e. the start of a second task being dependent on the completion of a first task.
  • Completion of the task prior to April 30 results in a bonus, e.g. 5 $ for a completion by March 31.
  • the bonus rises the sooner the task is completed.
  • a completion after April 30 results in a penalty.
  • the penalty rises the later the task is completed. In the shown example the penalty rises linear up to a maximum penalty of 25 $ for task completion after July 20.
  • Such penalty/ bonus functions are expressed as piecewise linear functions (sets of corner points marked as circles). When a task's duration is computed, its penalty/ bonus (if specified) is evaluated by interpolating between the corner points. The penalties/ bonuses of individual tasks are combined to form the overall project's penalty/ bonus.
  • Task-related costs are thus explicitly modeled as a function of task completion or duration. This is unlike the existing commercial solutions, which either model costs as resource-dependent or simulate them as random variables correlated with tasks.
  • the function parameters (such as bonus rates) specify the contract in terms of liquidated damages.
  • the project modeled can contain a number of discrete risk factors, whose occurrence implies certain penalties. For example, an unexpected transformer failure leads to a penalty of 50 kUSD.
  • the quality risks are represented in the model as tasks with zero completion, so they don't impact the overall project duration.
  • Their probability distribution is well defined (e.g., a uniform distribution on the interval 0-1), and a penalty function maps this distribution to the specified penalty with given probability. For example, a penalty function with penalty 50 kUSD between 0 and 0.1 and penalty 0 between 0.1 and 1 combined with the mentioned uniform distribution would model a 10% chance of 50 kUSD penalty.
  • a project is represented by a collection of interdependent tasks, for each of which a duration probability distribution and possibly a specified penalty is introduced.
  • the task dependence structure is originally modeled using the underlying scheduling system (e.g., Microsoft Project).
  • underlying scheduling system e.g., Microsoft Project
  • a successor task can depend on its predecessor in four ways:
  • these conditions are converted to mathematical functions specifying how the successor task's start and finish times can be computed based on the start and finish times of the predecessors.
  • Fig. 4 With five tasks and one quality risk factor.
  • the project starts with task 1.
  • Tasks 2 and 3 start as soon as task 1 is ended.
  • Task 4 can be started only after both tasks 2 and 3 are finished, whereas task 5 can start as soon as task 2 or task 3 is finished.
  • the project is completed after all tasks are finished.
  • task 4 cannot start until tasks 2 and 3 finish is represented mathematically as follows: the start day of task 4 is set equal to the maximum of the finish day of task 2 and finish day of task 3.
  • the finish day of task 4 is described as the start day of task 4 plus the duration of task 4, as the finish does not depend on the other tasks.
  • Task 6 is introduced artificially to represent a quality risk factor, as explained above.
  • Liquidated damages are calculated as described above.
  • f k ( ⁇ ; ⁇ k ) be the penalty/bonus function parameterized by ⁇ k
  • y k be the corresponding liquidated damage.
  • y k ⁇ k ( t k ; ⁇ k )
  • y k ⁇ k ( d k ; ⁇ k ).
  • the disclosed system calculates a large number of scenarios by repeatedly sampling values from the probability distributions for the uncertain variables. This can be done using Monte Carlo simulation, which randomly generates values for uncertain variables over and over to simulate a given model.
  • the resulting evolution of the project is simulated by drawing each task's duration d k from that task's probability distribution p ( d k ) or, more generally, from the joint distribution p ( d 1 , d 2 ,...) if conditional dependencies between durations need to be introduced.
  • the total project duration is evaluated using the task interdependence rules as explained above. Penalties are calculated for each task and summed up to give the overall project bonus/ penalty.
  • total project duration t ( i ) max( t 1 , t 2 , t 3 , t 4 , t 5 , t 6 ), and total project penalty
  • This module allows to determine how the uncertainty of a particular task affects the completion time and the cost of the whole project. In other words, it shows how critically the project depends on the unknown outcome of that task. In this sense, the more critical the task, the more impact it will have on the final project completion. "Criticality" is quantified by the project completion's standard deviation which is exclusively due to the specific task. Loosely speaking, criticality measures the final uncertainty (in time and cost) caused by the task uncertainty itself - and thus is expressed in time and currency units, respectively.
  • Criticality of a task with respect to the total project duration or project cost is evaluated by computing the corresponding distributions conditioned on the task duration (or, more generally, the value of the risk factor considered).
  • the procedure can be described as follows.
  • Y be the final variable of interest for the project (typically: total cost, or total duration).
  • X i be the i-th (uncertain) risk factor (typically: duration of the i-th task) and p Xi ( ⁇ ) be its given probability distribution.
  • the criticality or impact of X i on the project result Y is computed in four steps.
  • the inverse cumulative distribution can be readily obtained from most of the available calculation software.
  • Step 3 Using the obtained values ( q (1) / i ,..., q ( n ) / i ) and ( ⁇ (1) / i ,..., ⁇ ( n ) / i ), compute the quantity where and ⁇ Y is the standard deviation of the project result Y (previously computed from the overall project risk analysis). Because the quantity ⁇ i is the normalized standard deviation of ⁇ ( k ) / i , it corresponds to the project result's standard deviation which is exclusively due to uncertainty of task i. Hence ⁇ i quantifies the impact (or criticality) of the i-th risk factor on the overall result Y.
  • the quantity ⁇ i can take values only inside the interval 0 ⁇ ⁇ i ⁇ 1 up to the residual statistical errors due to Monte Carlo sampling.
  • the limit case ⁇ i 0 means that the i -th risk factor X i has no impact on Y .
  • Step 4 Repeat Steps 1 to 3 for each risk factor X i .
  • the individual time criticalities can be obtained, i.e., the tasks' risk impact on the total project duration.
  • the individual cost criticalities can be obtained, i.e., the tasks' risk impact on the total project cost.
  • the display module Besides visualizing the overall effect of uncertainties through the time and cost risk profiles (Fig. 5 and Fig. 6), the display module provides a project impact "zooming" instrument called criticality map , shown in Fig. 7.
  • the criticality map is an instrument to visualize the tasks' risk impact on the overall project result, as obtained in the previous Section. It is represented as a two-dimensional map.
  • Time criticality and cost criticality are two distinct characteristics. The one does not necessarily imply the other. In the example represented, Task 5 does not affect penalties but only project completion time. Therefore on the map it appears on the time criticality axis. Task 1 is more cost critical than Task 4, but here the reverse holds for time criticality. Duration of Task 3 is modelled here as fixed, i.e., 100%- certain - hence there is actually no risk associated with it. The outcome of Task 3 is not critical (to project duration / cost) at all, because it is certain, and thus appears at the origin (0,0) of Fig. 7.
  • Ranking tasks according to their criticality is crucial for prioritizing, e.g., allocation of additional resources.
  • the two-dimensional map emphasizes that time and cost requirements implied by different tasks are typically in mutual conflict.
  • the "criticality" ranking of the tasks may be different.
  • the project manager in practice may want to weigh time criticality vs. cost criticality when ranking tasks. For instance on Fig. 7, he may (subjectively) view a 4 days delay as "equally bad” as an additional cost of 11000 (for reasons not related to the bonuses / penalties already contained in the model). Since the line which connects these two points on the map is the locus of points of same "criticality", the "overall criticality" axis is defined by its perpendicular through the origin. This new axis finally allows the project manager to rank the tasks consistently with his policy. In the case of Fig. 7, the ranking in order of decreasing criticality / impact would be: Task 2 > Task 4 > Task 1 > Task 5 > Task 3.

Abstract

The inventive method for simulating impacts of project task risk factor on total project attributes comprises the steps of determining a number of mathematical expectations of said total project attributes for a set of different values of said first task risk factor, said total project attribute depending on aggregated project task attributes and project task interdependencies, said expectations being determined by performing a large number of different realizations of possible scenarios with stochastic risk factors according to a given risk factor probability distribution of at least one second project task, while keeping said first task risk factor constant; determining the standard deviation of said expectations, said standard deviation quantifying the impact of said first task risk factor on said total project attribute.

Description

    Background of the Invention
  • The invention relates to the field of project management. It relates to a method for simulating in a data processing system individual impacts of at least one first project task risk factor on at least one total project attribute.
  • Background Art
  • One major practical challenge of project management consists in keeping an overview of the different tasks, the task risk factors, and their possible impact on total project attributes, such as completion time and project costs. Risk factors may be, e.g., product quality, technical hurdles, qualitative and quantitative fluctuation of human resources, and occurrence of external events.
  • There is risk because these factors, all of which influence the project outcome, are uncertain to a certain extent at the beginning of a project. The role of a system for project risk assessment is to capture and display the overall effect of uncertainties on completion time and cost.
  • But in addition it is crucial for a project manager to be able to discern which tasks are at most "sensitive", i.e., "responsible" for the uncertainty in the total project cost. Discerning between the different impacts is indeed a necessary preliminary step before deciding on preventive actions or risk mitigation measures focused at the most "problematic" tasks.
  • Project management software, such as Microsoft's Corporations MS Project, typically allow a fine representation of the project execution phase by decomposition into tasks or sub-tasks. These tasks are connected according to their sequential interdependency. An estimated fixed duration is assigned to each task.
  • State-of-the-art systems measure "sensitivities" with respect to risk factors by frequency of the critical path, or by correlation coefficients (e.g., of task duration with overall cost), which are the basis for mono-dimensional graphical representation (such as a Tornado diagram).
  • Unfortunately, the "sensitivity" measures used by these methods are heuristic: Two tasks that appear equally frequently on the critical path do not necessarily have equal impact on the final project duration or cost. Moreover, because tasks of a project typically are not just sequential but are coupled in a complicated way, the dependence of the total duration (or cost) is not a linear function of the individual task durations-therefore correlation coefficient is a very crude measure of impact.
  • In consequence, the state-of-the-art systems mentioned above do not allow the project manager to quantify the real impact of each individual risk factor on the overall project in a precise way.
  • JP 6 124 285 describes a system which allows training of a project manager by simulation of events that affect project activities.
  • Summary of the Invention
  • It is an object of the present invention to provide a method for simulating and measuring impacts of project-task risk factors on the entire project in a data processing system.
  • It is a further object of the present invention to provide a computer program loadable into an internal memory of a digital computer, comprising computer program code means to make, when said program is loaded in the computer, the computer execute the inventive method.
  • This object is achieved by the inventive method for simulating in a data processing system individual impacts of at least one first project task risk factor on at least one total project attribute according to Claim 1.
  • The inventive method comprises the steps of:
  • determining a number of mathematical expectations of said total project attribute for a set of different values of said first task risk factor, said total project attribute depending on aggregated project task attributes and project task interdependencies,
  • said expectations being determined by performing a large number of different realizations of possible scenarios with stochastic risk factors according to a given risk factor probability distribution of at least one second project task, while keeping said first task risk factor constant; and
  • determining the standard deviation of said expectations, said standard deviation quantifying the impact of said first task risk factor on said total project attribute.
  • The inventive computer program is preferably recorded on a computer readable medium, and executes, when run on the computer, the method according to the invention.
  • Brief Description of the Drawings
  • The present invention will be explained in detail hereafter by reference to the drawings, wherein:
  • Fig. 1
    shows the three-module structure of the inventive project task impact decomposition system,
    Figs. 2 and 3
    show exemplary penalty/ bonus functions,
    Fig. 4
    shows an exemplary task dependence structure,
    Figs. 5 and 6
    show smoothed histograms with cumulated risk profiles, and
    Fig. 7
    shows a criticality map of individual project tasks.
    Description of the Preferred Embodiments
  • Fig. 1 shows the structure of the inventive project task impact decomposition system, consisting of the following three modules:
    • Project Simulation Module, for determining total project variable risk profiles, e.g. project duration risk profile;
    • Impact Decomposition Module, for determining impact of a single project task riskfactor on total project variable, e.g. cost impact; and
    • Display Module, multidimensional display of impact of all project tasks' risk-factors
  • The inventive system is an enhancement of the project duration and cost simulation engine described hereafter, which outputs total project variable risk profiles, e.g. overall duration or cost risk profile (global view). The inventive system aims at zooming into a project, i.e. at assessing and discerning the impacts caused by individual task-related or general risk factors on project attributes such as project duration or project cost. The system displays the impact, i.e. the criticality, of each of the projects risk-factors (local view).
  • Project Simulation Module
  • The project duration and cost simulation engine is used to describe a project as a set of interdependent tasks whose durations are uncertain within some assumed limits, and whose completion before or after a specified deadline may carry a prescribed task bonus or penalty. It performs the following actions:
  • 1. Fitting of duration distributions to given mode, lower and upper quantiles (or defaults)
  • For statistical modeling, all probability density functions used are expressed in terms of five parameters:
  • lower and upper percentiles α1 and αu,
  • lower and upper quantiles x 1 and x u, and
  • the mode x MP.
  • Often the number of parameters is reduced by fixing the lower and upper percentiles (e.g., to 0.05 and 0.95 respectively). The latter parameters must fulfill the condition 0 < α1 < 12 < αu <1.
  • The three remaining parameters are called "optimistic" (e.g., 5%-quantile x 1), "realistic" (mode x MP), and "pessimistic" values (e.g., 95%-quantile x u).
  • They must fulfill x 1 < x MP < x u.
  • The uncertain variable of interest x represents duration or cost, hence small values are associated with "good" and large values with "bad".
  • Any given probability distribution is in general described by a different set of specific parameters. They allow to compute the distribution easily though are difficult to specify by the user. Therefore these specific parameters must be fitted (either analytically or numerically) so that the resulting probability density function is consistent with the specified parameters.
  • As an example, consider the Weibull distribution, which can be given an asymmetric shape. The standard distribution is defined by
    Figure 00050001
    which is characterized by two parameters a and b. In order to let the uncertain variable take arbitrary lower bound (not necessarily zero), we include a third parameter c (for location):
    Figure 00050002
  • The three user parameters (optimistic, realistic, and pessimistic) x 1,x MP,x u - besides the lower and upper percentiles α1u - constrain the distribution parameters as follows:
    Figure 00050003
  • Solving now this system of three implicit equations leads to a = x u-x MP γd u-(1-d) d b = 1 d c = x MP - a(1-d) d , where d is the root of (1-ρ)(1-d) d + ργ d u - γ d 1 = 0 subject to max {1- γu,0} < d < 1- γ1 and ρ,γ1u are the constants ρ= x i-x MP x u-x MP γ1 = -log(1-α1) γu = -log(1-αu).
  • 2. Representation of task duration costs by penalty/ bonus functions, i.e., (nonlinear) functions of task durations or completion dates
  • Each project task can have an associated penalty/ bonus function. This function specifies penalty or bonus for completing a task before or after a specific deadline or depending on the task's duration.
  • Two examples will illustrate sample penalty/ bonus functions.
  • In the example of Fig. 2 the horizontal axis represents the task duration (in days), while the vertical axis represents the cost (in USD). Depending on the duration of the task either a bonus is awarded or penalty is imposed. Completing the task 50 days after project start carries no bonus or penalty. For early finish there is a bonus specified by the bonus slope (0.5 USD/day), e.g. 5 $ for a duration of 40 days. The bonus rises the sooner the task is completed. A duration of more than 50 days results in a penalty. The penalty rises depending on the delay. In the shown example the penalty rises with two different gradients. A first gradient of 1 $/ day for a duration up to 70 days and a second gradient of 2 $/day for a duration up to 80 days. In the shown example a constant penalty of 40 $ is defined for a duration of 80 to 100 days. For a duration of more than 95 days a maximum penalty (cap) of 50 $ is imposed.
  • In the example of Fig. 3 the horizontal axis represents the task completion date, while the vertical axis represents the cost (in USD). Depending on the completion date of the task either a bonus is awarded or penalty is imposed. This is particularly interesting in the case of multiple task dependencies, i.e. the start of a second task being dependent on the completion of a first task. Completion of the task prior to April 30 results in a bonus, e.g. 5 $ for a completion by March 31. The bonus rises the sooner the task is completed. A completion after April 30 results in a penalty. The penalty rises the later the task is completed. In the shown example the penalty rises linear up to a maximum penalty of 25 $ for task completion after July 20.
  • Such penalty/ bonus functions are expressed as piecewise linear functions (sets of corner points marked as circles). When a task's duration is computed, its penalty/ bonus (if specified) is evaluated by interpolating between the corner points. The penalties/ bonuses of individual tasks are combined to form the overall project's penalty/ bonus.
  • Task-related costs are thus explicitly modeled as a function of task completion or duration. This is unlike the existing commercial solutions, which either model costs as resource-dependent or simulate them as random variables correlated with tasks. In the inventive system, the function parameters (such as bonus rates) specify the contract in terms of liquidated damages.
  • 3. Representation of discrete-type risk factors (e.g., quality) by a synthetical task (the duration of which typically does not influence project completion time)
  • The project modeled can contain a number of discrete risk factors, whose occurrence implies certain penalties. For example, an unexpected transformer failure leads to a penalty of 50 kUSD. The quality risks are represented in the model as tasks with zero completion, so they don't impact the overall project duration. Their probability distribution is well defined (e.g., a uniform distribution on the interval 0-1), and a penalty function maps this distribution to the specified penalty with given probability. For example, a penalty function with penalty 50 kUSD between 0 and 0.1 and penalty 0 between 0.1 and 1 combined with the mentioned uniform distribution would model a 10% chance of 50 kUSD penalty. (Of course, the risk factor can be given more than two possible stages, for instance: no failure/ between 1 and n failures/ more than n failures.) This solution has the advantage that the same mechanism can be used for duration-dependent penalties/ bonuses and discrete risk factors.
  • 4. Specification of task dependence structure
  • A project is represented by a collection of interdependent tasks, for each of which a duration probability distribution and possibly a specified penalty is introduced.
  • The task dependence structure is originally modeled using the underlying scheduling system (e.g., Microsoft Project).
  • A successor task can depend on its predecessor in four ways:
    • successor cannot start until the predecessor starts
    • successor cannot start until the predecessor finishes
    • successor cannot finish until the predecessor starts
    • successor cannot finish until the predecessor finishes
  • For the purpose of computing project duration, these conditions are converted to mathematical functions specifying how the successor task's start and finish times can be computed based on the start and finish times of the predecessors.
  • As an illustration, consider the example represented in Fig. 4 with five tasks and one quality risk factor. In this case, the project starts with task 1. Tasks 2 and 3 start as soon as task 1 is ended. Task 4 can be started only after both tasks 2 and 3 are finished, whereas task 5 can start as soon as task 2 or task 3 is finished. Finally, the project is completed after all tasks are finished.
  • In order to formulate the task dependencies mathematically, the following notation is introduced
  • sk = and start date of task k
  • dk = and duration of task k
  • tk = and finish date of task k.
  • The fact that task 4 cannot start until tasks 2 and 3 finish is represented mathematically as follows: the start day of task 4 is set equal to the maximum of the finish day of task 2 and finish day of task 3. The finish day of task 4 is described as the start day of task 4 plus the duration of task 4, as the finish does not depend on the other tasks.
  • The predecessor (task i)/ successor (task k) dependencies listed above are expressed by
  • i.   sk = max(si ,r)
  • ii.   sk =max(ti ,r)
  • iii.   tk =max(sk + dk,si,r)
  • iv.   tk =max(sk + dk,ti,r),
  • where r corresponds to the remaining conditions, e.g., r = min(ti ,tj ) means 'as soon as task i or task j is finished'.
  • In the example of Fig. 4 (with t = 0 as project start date) s 1 = 0   t 1 = s 1 + d 1 = d 1 s 2 = t 1   t 2 = s 2 + d 2 s 3 = t 1   t 3 = s 3 + d 3 s 4 = max(t 2,t 3)   t 4 = s 4 + d 4 s 5 = min(t 2,t 3)   t 5 = s 5 + d 5 s 6 = 0   t 6 = 0   (quality risk factor) t = max(t 1,t 2,t 3,t 4,t 5,t 6)   (total project duration).
  • Task 6 is introduced artificially to represent a quality risk factor, as explained above.
  • Since t 6 is set to zero, task 6 does not influence the project completion time t, although it does so for the project cost y.
  • Liquidated damages are calculated as described above.
  • For task k, let fk (·;k ) be the penalty/bonus function parameterized by k , and yk be the corresponding liquidated damage. In the case of a completion-related penalty, yk = ƒk (tk ;k ) whereas in the case of a duration-related (or quality-related) penalty, yk = ƒk (dk ;k ).
  • Of course, if no penalty/ bonus is attached to task k, then ƒk (·;k )≡0.
  • The overall liquidated damages are obtained by
    Figure 00100001
  • In the example of Fig. 4, if task 2 is completed before a certain time ta 2, a pre-defined bonus is received; whereas if it is completed later than another given time tb 2, a penalty is charged. A similar clause applies to task 3 and 4, although bonus and penalty are proportional to delay (up to some cap).
  • Finally, the bonuses/ penalties are aggregated to determine the net liquidated damages.
  • 5. Simulation of random variables
  • The disclosed system calculates a large number of scenarios by repeatedly sampling values from the probability distributions for the uncertain variables. This can be done using Monte Carlo simulation, which randomly generates values for uncertain variables over and over to simulate a given model.
  • For each scenario the resulting evolution of the project is simulated by drawing each task's duration dk from that task's probability distribution p(dk ) or, more generally, from the joint distribution p(d 1,d 2,...) if conditional dependencies between durations need to be introduced. The total project duration is evaluated using the task interdependence rules as explained above. Penalties are calculated for each task and summed up to give the overall project bonus/ penalty. Thus for each realization i there are two results: total project duration t ( i ) = max(t 1,t 2,t 3,t 4,t 5,t 6), and total project penalty
    Figure 00100002
  • Impact decomposition module
  • This module allows to determine how the uncertainty of a particular task affects the completion time and the cost of the whole project. In other words, it shows how critically the project depends on the unknown outcome of that task. In this sense, the more critical the task, the more impact it will have on the final project completion. "Criticality" is quantified by the project completion's standard deviation which is exclusively due to the specific task. Loosely speaking, criticality measures the final uncertainty (in time and cost) caused by the task uncertainty itself - and thus is expressed in time and currency units, respectively.
  • Criticality of a task with respect to the total project duration or project cost is evaluated by computing the corresponding distributions conditioned on the task duration (or, more generally, the value of the risk factor considered). Mathematically, the procedure can be described as follows.
  • Let Y be the final variable of interest for the project (typically: total cost, or total duration). Let Xi be the i-th (uncertain) risk factor (typically: duration of the i-th task) and pXi (·) be its given probability distribution. The criticality or impact of Xi on the project result Y is computed in four steps.
  • Step 1: For a number n of preferably equidistant percentiles α( i ), e.g., (1)(2),...,α( n ))=(5%, 10%,...,95%), the corresponding quantiles are computed x (k) i =F -1 Xi (a( k ))   k=1,...,n, where F -1 / Xiis the inverse cumulative distribution of Xi , i.e., such that
    Figure 00110001
  • The inverse cumulative distribution can be readily obtained from most of the available calculation software.
  • Compute the sample density values q (k) i = pX i (x (k) i )   k=1,...,n.
  • Step 2: For each k = 1,...,n, use the project simulation module to compute the mathematical expectation of Y while keeping Xi equal to the particular value x (k) / i, i.e., µ(k) i = E(Y|Xi = x (k) i )   k=1,...,n.
  • In order to evaluate the expectation, the simulation engine performs a (large) number of independent Monte Carlo simulations, in which, however, the i-th risk factor is kept constant at Xi = x (k) / i.
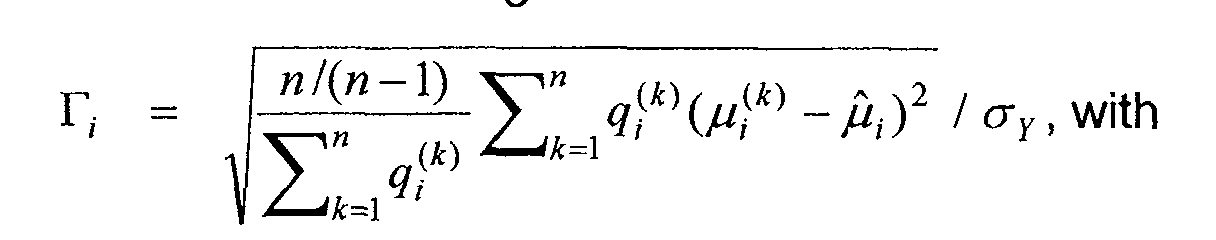
  • Step 3: Using the obtained values (q (1) / i,...,q (n) / i) and (µ (1) / i,...,µ (n) / i), compute the quantity
    Figure 00120001
    where
    Figure 00120002
    and σ Y is the standard deviation of the project result Y (previously computed from the overall project risk analysis). Because the quantity Γ i is the normalized standard deviation of µ (k) / i, it corresponds to the project result's standard deviation which is exclusively due to uncertainty of task i. Hence Γ i quantifies the impact (or criticality) of the i-th risk factor on the overall result Y.
  • Due to the normalization by the overall standard deviation, the quantity Γ i can take values only inside the interval 0 ≤ Γ i ≤ 1 up to the residual statistical errors due to Monte Carlo sampling. The limit case Γ i = 0 means that the i-th risk factor Xi has no impact on Y. On the other hand, Γ i = 1 means that the uncertainty of Y is entirely due to Xi .
  • Step 4: Repeat Steps 1 to 3 for each risk factor Xi .
  • By using the above procedure for the project duration as the variable Y, the individual time criticalities can be obtained, i.e., the tasks' risk impact on the total project duration. Then, by using the same procedure for the project cost as the variable Y, the individual cost criticalities can be obtained, i.e., the tasks' risk impact on the total project cost.
  • Display module
  • Besides visualizing the overall effect of uncertainties through the time and cost risk profiles (Fig. 5 and Fig. 6), the display module provides a project impact "zooming" instrument called criticality map, shown in Fig. 7. The criticality map is an instrument to visualize the tasks' risk impact on the overall project result, as obtained in the previous Section. It is represented as a two-dimensional map.
  • The two axes are: Duration (time) criticality and cost criticality. Time criticality and cost criticality are two distinct characteristics. The one does not necessarily imply the other. In the example represented, Task 5 does not affect penalties but only project completion time. Therefore on the map it appears on the time criticality axis. Task 1 is more cost critical than Task 4, but here the reverse holds for time criticality. Duration of Task 3 is modelled here as fixed, i.e., 100%-certain - hence there is actually no risk associated with it. The outcome of Task 3 is not critical (to project duration / cost) at all, because it is certain, and thus appears at the origin (0,0) of Fig. 7.
  • Because time and cost dependencies are typically nonlinear, "criticality" numbers of several tasks cannot be summed up. They can be compared, however. Due to a "chain reaction" effect, tasks at the beginning of a project tend to be more time and cost "critical" than final tasks, although this does not necessarily have to be the case.
  • Ranking tasks according to their criticality is crucial for prioritizing, e.g., allocation of additional resources. The two-dimensional map emphasizes that time and cost requirements implied by different tasks are typically in mutual conflict. Depending on the viewpoint (e.g., focus on time or focus on cost), the "criticality" ranking of the tasks may be different.
  • Because several factors may not be captured by the project model (e.g., if completion time is strategically important due to a competitor or due to the company's reputation), the project manager in practice may want to weigh time criticality vs. cost criticality when ranking tasks. For instance on Fig. 7, he may (subjectively) view a 4 days delay as "equally bad" as an additional cost of 11000 (for reasons not related to the bonuses / penalties already contained in the model). Since the line which connects these two points on the map is the locus of points of same "criticality", the "overall criticality" axis is defined by its perpendicular through the origin. This new axis finally allows the project manager to rank the tasks consistently with his policy. In the case of Fig. 7, the ranking in order of decreasing criticality / impact would be:
    Task 2 > Task 4 > Task 1 > Task 5 > Task 3.

Claims (7)

  1. Method for simulating in a data processing system individual impacts of at least one first project task risk factor on at least one total project attribute; said method comprising the steps of:
    determining a number of mathematical expectations of said total project attribute for a set of different values of said first task risk factor, said total project attribute depending on aggregated project task attributes and project task interdependencies,
    said expectations being determined by performing a large number of different realizations of possible scenarios with stochastic risk factors according to a given risk factor probability distribution of at least one second project task, while keeping said first task risk factor constant; and
    determining the standard deviation of said expectations, said standard deviation quantifying the impact of said first task risk factor on said total project attribute.
  2. Method of Claim 1, wherein said steps are repeated for each of several total project attributes.
  3. Method of Claim 2, wherein said different total project attributes are depening on different project task attributes.
  4. Method of any of the preceding Claims, wherein said steps are repeated for each of several first project task risk factors.
  5. Method of any of the preceding Claims, wherein said impacts of said first project task risk factors on said total project attributes are displayed in a one-, two- or three-dimensional map, the total project attributes being assigned to the axes of said map.
  6. Method of any of the preceding Claims, said standard deviation (Γ i ) being determined according to
    Figure 00160001
    Figure 00160002
    µ(k) i = E(Y|Xi = x (k) i )   k=1,...,n being the mathematical expectations of the total project attribute Y with the first task risk factor being kept konstant at Xi = x (k) / i,
    said total project attribute Y being dependent on aggregated project task attributes and project task interdependencies; q (k) i = pXi(x (k) i )   k=1,...,n, pXi (·) being the probability distribution of the first task risk factor (Xi), and x (k) i = F -1 Xi ( k ))   k=1,...,n being the quantiles to a number (k=1,...,n) of preferably equidistant percentiles (α(1)(2),...,α(n))
    with F -1 / Xibeing the inverse cumulative distribution of Xi , such that
    Figure 00160003
    σ Y being the standard deviation of the total project attribute Y determined in an overall project risk analysis.
  7. A computer program loadable into an internal memory of a digital computer, comprising computer program code means to make, when said program is loaded in the computer, the computer execute the method of any of the preceding Claims.
EP02405302A 2002-04-15 2002-04-15 Method for simulating project task risk impact Withdrawn EP1355246A1 (en)

Priority Applications (1)

Application Number Priority Date Filing Date Title
EP02405302A EP1355246A1 (en) 2002-04-15 2002-04-15 Method for simulating project task risk impact

Applications Claiming Priority (1)

Application Number Priority Date Filing Date Title
EP02405302A EP1355246A1 (en) 2002-04-15 2002-04-15 Method for simulating project task risk impact

Publications (1)

Publication Number Publication Date
EP1355246A1 true EP1355246A1 (en) 2003-10-22

Family

ID=28459615

Family Applications (1)

Application Number Title Priority Date Filing Date
EP02405302A Withdrawn EP1355246A1 (en) 2002-04-15 2002-04-15 Method for simulating project task risk impact

Country Status (1)

Country Link
EP (1) EP1355246A1 (en)

Cited By (5)

* Cited by examiner, † Cited by third party
Publication number Priority date Publication date Assignee Title
US7904324B2 (en) 2006-09-28 2011-03-08 International Business Machines Corporation Method and system for assessing schedule performance issues of a project
US8005705B2 (en) 2006-09-07 2011-08-23 International Business Machines Corporation Validating a baseline of a project
US8010396B2 (en) 2006-08-10 2011-08-30 International Business Machines Corporation Method and system for validating tasks
US20150088571A1 (en) * 2013-09-25 2015-03-26 Sap Ag System and method for task assignment in workflows
US10095999B2 (en) 2014-11-18 2018-10-09 Oracle International Corporation Managing multiple tasks of a project plan via a task management tool

Non-Patent Citations (1)

* Cited by examiner, † Cited by third party
Title
No Search *

Cited By (6)

* Cited by examiner, † Cited by third party
Publication number Priority date Publication date Assignee Title
US8010396B2 (en) 2006-08-10 2011-08-30 International Business Machines Corporation Method and system for validating tasks
US8005705B2 (en) 2006-09-07 2011-08-23 International Business Machines Corporation Validating a baseline of a project
US7904324B2 (en) 2006-09-28 2011-03-08 International Business Machines Corporation Method and system for assessing schedule performance issues of a project
US20150088571A1 (en) * 2013-09-25 2015-03-26 Sap Ag System and method for task assignment in workflows
US9779374B2 (en) * 2013-09-25 2017-10-03 Sap Se System and method for task assignment in workflows
US10095999B2 (en) 2014-11-18 2018-10-09 Oracle International Corporation Managing multiple tasks of a project plan via a task management tool

Similar Documents

Publication Publication Date Title
EP2383689A1 (en) System and method to estimate the effects of risks on the time progression of projects
US20070124186A1 (en) Method of managing project uncertainties using event chains
US8631384B2 (en) Creating a test progression plan
Musa et al. Software reliability
US20110302090A1 (en) Determining a Critical Path in Statistical Project Management
Damnjanovic et al. Data analytics for engineering and construction project risk management
CN101561904B (en) A kind of software project cost assay method of Kernel-based methods data and system
Nkiwane et al. The use of Earned Value Management for initiating directive project control decisions: A case study
Andersson et al. A spiral process model for case studies on software quality monitoring—method and metrics
Acebes et al. On the project risk baseline: Integrating aleatory uncertainty into project scheduling
Honda et al. Predicting time range of development based on generalized software reliability model
EP1355246A1 (en) Method for simulating project task risk impact
EP1355245A1 (en) Method for simulating project duration and costs
Logue et al. Handling uncertainty in agile requirement prioritization and scheduling using statistical simulation
US20120116987A1 (en) Dynamic Process Modeling Assembly and Method of Use
Iannino et al. Software reliability
CN108564237A (en) A kind of Capacity Evaluation Model method for building up, capacity evaluating method and device
Lisse Applying system dynamics for outsourcing services in design-build projects
Dain et al. Stochastic shipyard simulation with SIMYARD
Cook Estimating required contingency funds for construction projects using multiple linear regression
Pena Quantifying the impact of requirements volatility on systems engineering effort
Virine et al. Event chain methodology in details
Houston A generalized duration forecasting model of test‐and‐fix cycles
Ligade et al. Use of Optimization Techniques for Construction Projects: Study & Application
Daly A Comparison of Software Schedule Estimators

Legal Events

Date Code Title Description
PUAI Public reference made under article 153(3) epc to a published international application that has entered the european phase

Free format text: ORIGINAL CODE: 0009012

AK Designated contracting states

Kind code of ref document: A1

Designated state(s): AT BE CH CY DE DK ES FI FR GB GR IE IT LI LU MC NL PT SE TR

AX Request for extension of the european patent

Extension state: AL LT LV MK RO SI

AKX Designation fees paid
REG Reference to a national code

Ref country code: DE

Ref legal event code: 8566

STAA Information on the status of an ep patent application or granted ep patent

Free format text: STATUS: THE APPLICATION IS DEEMED TO BE WITHDRAWN

18D Application deemed to be withdrawn

Effective date: 20040423