This invention relates to a degree-of-stain-on-printed-matter
examining apparatus for examining the
degree of stain on the surface of printed matter, such
as securities.
A conventional degree-of-stain-on-printed-matter
examining apparatus examines the degree of stain on
printed matter as follows. The apparatus causes image
input means, such as a television camera or a line
sensor, to pick up the surface image or transmitted
image on one side or both sides of printed matter and
input the image data, senses the leading edge of the
printed matter from the inputted image data, takes in
the image data from the whole surface of the printed
matter, starting from the sensed leading edge, and
compares the taken-in image data with the preset
reference data, thereby determining the degree of
stain on the printed matter.
One known method of calculating the degree
of stain in such a degree-of-stain-on-printed-matter
examining apparatus is to examine the degree
of stain only in a specific area, such as
an unprintable area, on the whole surface of
the printed matter.
There has been no degree-of-stain-on-printed-matter
examining apparatus for examining the degree of
stain on the areas other than the unprintable area,
that is, the degree of stain on the printed area.
Accordingly, the conventional degree-of-stain-on-printed-matter
examining apparatus has the problem of
failing to examine the degree of stain which persons
feel from the whole surface of printed matter.
The object of the present invention is to provide
a degree-of-stain-on-printed-matter examining apparatus
capable of examining the degree of stain on printed
matter with as high accuracy as that of human senses.
In order to achieve the above object, according to
one aspect of the present invention, there is provided
an apparatus for examining the degree of stain on
printed matter, comprising: image input means for
inputting images including the image of printed matter
to be examined and supplying image data on the printed
matter; area information storage means for storing
positional information on at least two target areas
on a standard image corresponding to the image of
the printed matter, the area of each of the target
areas, their standard average densities, and the degree
of dispersion in their density distribution; average
density computing means for calculating the average
density for each target area in the image data supplied
from the image input means by using the positional
information on each target area and the area of each
target area supplied from the area information storage
means; density difference measuring means for measuring
the density difference between the average density for
each target area calculated by the average density
computing means and the standard average density for
each target area supplied from the area information
storage means; density difference normalizing means for
normalizing the density difference for each target area
by using the density difference for each target area
measured at the density difference measuring means and
the degree of dispersion in the density distribution
for each target area supplied from the area information
storage means; and summing means for summing the
normalized density difference for each of the target
areas supplied from the density difference normalizing
means and thereby judging the degree of stain on the
printed matter to be examined.
The apparatus of the invention further comprises:
visual characteristic coefficient computing means for
calculating a coefficient agreeing with human visual
characteristics for the standard average density for
each target area supplied from the area information
storage means; and weighting means for calculating
a degree-of-stain decision value for each target area
by multiplying the normalized density difference for
each target area supplied from the density difference
normalizing means by the area of each target area
supplied from the area information storage means,
and further by the visual characteristic normalized
coefficient supplied from the visual characteristic
coefficient computing means, wherein the summing means
includes addition means for adding the degree-of-stain
decision value for each of the target areas supplied
from the weighting means and judging means for judging
the degree of stain on the printed matter by comparing
the degree-of-stain decision value added by the
addition means with a specific threshold value for
the degree of stain.
The visual characteristic coefficient computing
means determines the reflectivity corresponding to
the standard average density for each target area
supplied from the area information storage means
and calculates the visual characteristic normalized
coefficient on the basis of the ratio of the individual
reflectivities.
The apparatus of the invention further comprises
learning means which includes: storage means for
receiving images of the printed matter as an object
of learning from the image input means and storing
the images of the printed matter; average image
creating means for creating an average density value
image on the basis of the images stored in the storage
means; labeling means for putting the same label on
the pixels included in the same density range on
the average density value image supplied from the
average image creating means; area extracting means
for combining areas in the same density range where
more than a specific number of pixels are consecutive
on the images subjected to the labeling process by
the labeling means, thereby extracting a target area
on the printed matter, and supplying the number of
the target areas and their positional information;
area computing means for computing the area of each
target area calculated by the area extracting means;
and statistical value computing means for creating
a density histogram for the average value image
supplied from the average image creating means and
calculating the average density and standard deviation
for each target area, wherein the area information
storage section stores the number of target areas
and positional information supplied from the area
extracting means, the area of each target area supplied
from the area-by-area area computing means, and the
average density and average standard deviation for
each target area supplied from the statistical value
computing means.
With the present invention, the degree of stain
on the whole surface of printed matter (the degree
of dirtiness persons feel from the whole surface of
the printed matter) is judged by using the degree
of stain on at least two target areas on the printed
matter, the area of each target area, and a coefficient
expressing how conspicuous stains are to human senses
at the average density of each target area on the
printed matter. At a result, the degree of stain on
printed matter can be examined with as high accuracy as
human senses.
Furthermore, pieces of printed matter can be
arranged in the order of human senses, for example, in
the order in which the cleanest one comes first and the
dirtiest one comes last. Moreover, the degree of stain
on one side and that on the other side can be evaluated
and, on the basis of the evaluation, stains clustered
only on one side can be examined.
This summary of the invention does not necessarily
describe all necessary features so that the invention
may also be a sub-combination of these described
features.
The invention can be more fully understood from
the following detailed description when taken in
conjunction with the accompanying drawings, in which:
Hereinafter, referring to the accompanying
drawings, embodiments of the present invention will be
explained.
Explanation of a first embodiment of the present
invention will be given.
FIG. 1 schematically shows the configuration of an
apparatus for examining the degree of stain on printed
matter according to a first embodiment of the present
invention. An image input section 101 includes a
photoelectric conversion section, such as a television
camera or a line sensor, that reads image data on the
whole surface by optically scanning the whole surface
of one side of printed matter P to be examined and
photoelectrically converting the sensed signal and
supplies the output in the form of a digital signal.
The image data on the printed matter P supplied
from the image input section 101 is sent to an aligning
section 102. The aligning section 102 aligns the
position of the image data by moving (converting) the
position of the printed-matter image in the image data
to a specific position and sends the aligned image data
and the positional information (pixel address) to each
of an average density computing section 104 and an area
information storage section 103.
Using the image data aligned by the aligning
section 102 and the area numbers and areas of at least
two target areas on the printed matter P obtained
from an area information storage section 103, the
average density computing section 104 calculates
the average density of each target area and sends
the calculation results to a density difference
measuring section 105. A target area is a specific
area on the printed matter P whose degree-of-stain
is to be measured. For example, it is an area in which
a characteristic image has been printed.
Using the average density of each target area
calculated at the average density computing section 104
and the standard average density of each target area
obtained from the area information storage area 103,
the density difference measuring section 105 calculates
the density difference between average densities for
each target area and sends the calculation results to
a density difference normalizing section 106.
Using the density difference calculated at the
density difference measuring section 105 and the
average standard deviation of each target area obtained
from the area information storage section 103, the
density difference normalizing section 106 normalizes
the density difference for each target area and sends
the normalized density difference values to a summing
section 107.
The summing section 107 sums up the normalized
density difference values of the individual target
areas obtained from the density difference normalizing
section 106, judges the degree of stain on the printed
matter P, and outputs the result of the judgment as the
result of the examination.
Hereinafter, the operation of the first embodiment
will be explained in detail.
The image input section 101 picks up the whole
surface image of the printed matter P in the form of
an analog signal and converts it into a digital signal.
Explanation will be given, taking a case where the
image data is read while the printed matter P is being
transferred. The image data may be read by fixing
the printed matter P and causing the photoelectric
conversion section in the image input section 101 to
move over and scan the image data.
FIGS. 2 and 3 show examples of the configuration
of the image input section 101. Specifically, the
printed matter P, which is pinched by two transfer
belt 21, 22, is transferred in the direction of the
arrow. Below the transfer belts 21, 22, a reference
plate 23 is secured. The printed matter P is
transferred over almost the center of the reference
plate 23.
Above the transfer belts 21, 22 facing the
reference plate 23, a light source 24 that illuminates
the reference plate 23 and the printed matter P
transferred, and a photoelectric conversion section 25
that receives the reflected light from the reference
plate 23 and the printed matter P transferred and
converts it into an electric signal are provided.
The reference plate 23 may be made of transparent glass
and the light source 24 and photoelectric conversion
section 25 be provided below the reference plate 23.
In that case, the photoelectric conversion section 25
receives the transmitted reflected light, which
prevents the image of the printed matter P from being
obstructed by the belts 21, 22.
The reflected light (or the transmitted light)
from the printed matter P strikes the light-receiving
surface of the photoelectric conversion section 25
vertically. In this case, the light source 24 is
provided so as to prevent the angle from a perpendicular
line L extending between the printed matter P
and the photoelectric conversion section 25 from being
nearly 0° or 90° as shown in FIG. 3. For example, it
is so provided that the angle lies in the range of
30° to 60°. While in FIG. 3, the printed matter P is
illuminated from the front in the transfer direction,
it may be illuminated from the back.
A suitable reference plate 23 will be explained
concretely using the printed matter P in FIG. 4 as
an example. It is assumed that the printed matter P of
FIG. 4 is a white sheet of paper on which the letter A
is printed in its center with an ink of a specific
color other than white and that the area of the printed
matter P is the shaded area shown in FIG. 5 (where the
belts 21, 22 are omitted).
A high-reflectivity material is used as a
substrate 23a (see FIG. 2) corresponding to the
background of the printed matter P including a
target area from which the amount of feature is to
be extracted. The high-reflectivity material has
to be less liable to become dirty in order that,
when printed matter P on whose front and back some
letters have been printed is transferred, the ink is
prevented from adhering to the reference plate 23
and the reflectivity is kept from decreasing. Namely,
a high-reflectivity material less liable to become
dirty is provided at the back of the printed patter P
transferred. Examples of such material include opal
and ceramic.
The background areas 27, 28 (see FIG. 2) at
both ends of the printed matter P in the direction
perpendicular to the transfer direction of the printed
matter P are given a color having a high contrast with
the sheet of the printed material P. For example, when
a white sheet of paper is used as the printed matter P
as shown in FIG. 4, the background areas 27, 28 are
made black. The reason is that use of black makes it
easy to determine the position of the printed matter P
in analyzing the image data.
The aligning section 102 extracts, for example,
the top left end position of the printed matter P from
the image data on the whole surface of the printed
matter P inputted from the image input section 101.
Hereinafter, a method of extracting the position will
be explained in detail.
The aligning section 102 first extracts the area
of the printed matter P in the read-out image data.
Since the printed matter P is being transferred, the
position may not be extracted correctly under the
influence of uneven transfer.
In the first embodiment, the printed matter P
is extracted on the basis of the density information.
It is clear that setting the threshold in density
values facilitates the extraction of the boundary
between the printed matter and the background because
the reference plate 23 has been set so that the
contrast between the color of the sheet of the printed
matter P and the background color may be sufficiently
high.
As shown in FIG. 6, the aligning section 102 takes
in the density data on each pixel from the top left end
V of the image data to the right and calculates the
position S at which the density changes. At this time,
when there is some dust (noise) N on the background
of the printed matter P, or the reference plate 23 as
shown in FIG. 7A, there is a possibility that the dust
N will be extracted, being mistaken for the top left
end of the printed matter P. Thus, a noise removing
process is carried out. When the printed matter P has
tilted as show in FIG. 7B, the process (rotational
process) of computing and correcting the inclination is
also carried out.
As shown in FIG. 8, the calculated position S
(x, y) is converted into a specific position S'
(x', y') on the whole image data. Namely, the image
data on the printed matter P is moved parallel to the
specific position on the whole image data. When the
printed matter P has tilted as shown in FIG. 7B, the
inclination is corrected and then the image of the
printed matter is moved parallel.
In the area information storage section 103,
pieces of information including the area, standard
density value, and average standard deviation of
each of at least two target areas on a standard image
(or a typical image) of the printed matter P have been
stored.
FIG. 10 shows the configuration of the average
density computing section 104, density difference
measuring section 105, density difference normalizing
section 106, and summing section 107.
The average
density computing section 104 receives
the image data from the aligning
section 102 and the
address ADR and area S of a target area from the area
information storage section and calculates the average
density value for each target area on the printed
matter P. In the average
density computing section 104,
adders 41, 42, ..., 43 and
dividers 44, 45, ..., 46 are
provided in such a manner that they correspond to the
individual target areas, one adder and one divider for
one target area. Specifically, using the image data on
the printed matter P aligned by the aligning
section
102, the
adders 41, 42, ..., 43 add the density values
for each target area on the basis of the relative
address of each target area on the printed matter P
obtained from the area
information storage section 103.
For example, it is assumed that the pixel corresponding
to the coordinates (x, y) of point t in the image data
is a pixel in the target area
a
. The density
integral value for each target area on the printed
matter P is calculated by determining the density
values of the pixels with the coordinates in the target
area
a
and adding up the density values.
Next, the dividers 44, 45, ..., 46 divide the
calculated density integral values by the area S of
each target area obtained from the area information
storage area 103. This enables the average density
value for each target area on the printed matter P to
be calculated.
Using the average density for each target area
on the printed matter P calculated at the average
density computing section 104 and the standard average
density DS for each target area obtained from the
area information storage section 103, subtracters 51,
52, ..., 53 in the density difference computing section
105 do subtraction for each target area on the printed
matter to find the density difference. Specifically,
the subtracters 51, 52, ..., 53 subtract the average
density DAV from the standard average density DS.
Then, absolute value circuits 54, 55, ..., 56 calculate
the absolute value DD of the density difference as
follows:
DD = |DS - DAV|
Using the absolute value DD of the density
difference for each target area on the printed matter P
calculated at the density difference computing section
105 and the average standard deviation σ of each
target area obtained from the area information storage
section 103, the density difference normalizing section
106 causes dividers 61, 62, ..., 63 to do division.
Specifically, the density difference normalizing
section 106 normalizes the density difference for each
target area by dividing the absolute value DD of the
density difference by the average deviation σ and
produces the normalized density difference (the degree
of stain) H as follows:
H = |DS-DAV|σ
The summing section 107 causes an adder 71 to add
up the normalized density difference (the degree of
stain) H for each target area on the printed matter P
determined by the density difference normalizing
section 106 and thereby sums up the degree of stain
for each target area on the printed matter P.
Furthermore, the summing section 107 causes
a threshold value storage section 72 and a judging
section 73 to determine the degree of stain on the
printed matter P on the basis of the degree of stain
calculated. Specifically, suppose the calculated
degree of stain is J and the judgment threshold value
in examination is Jp (previously stored in the
threshold value storage section 72). Under this
supposition, the judging section 73 makes a judgment
as follows:
If J ≧ Jp, then it judges that the printed matter
P is dirty.
If J < Jp, then it judges that the printed matter
P is clean.
In this case, the judgment threshold value Jp can
be set variously. Consequently, the result of the
examination, for example, the rate of stain, can be set
variously.
Hereinafter, a second embodiment of the present
invention will be explained.
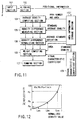
FIG. 11 schematically shows the configuration
of an apparatus for examining the degree of stain on
printed matter according to a second embodiment of the
present invention. The second embodiment has the same
configuration as that of the first embodiment except
that a visual characteristic coefficient section 108
and a weight computing section 109 are added to the
first embodiment. The same parts as those in the first
embodiment are indicated by the same reference symbols.
Explanation of some of the component parts will be
omitted or simplified. What differs from the first
embodiment will be explained in detail.
The visual characteristic coefficient section 108
calculates a coefficient agreeing with a human visual
characteristic for the standard average density of
each target area on the printed matter P obtained
from the area information storage section 103. Before
explanation of a method of computing the coefficient,
the human visual characteristic will be explained.
Even when stains with the same density are present,
the degree of stain persons feel differs, depending on
the place where the stains are present, for example,
depending on whether the stains are on a light-colored
print area or on a dark-colored print area. This is
known as the human visual characteristic. It is the
visual characteristic coefficient section 108 that
calculates a coefficient (visual characteristic
coefficient) corresponding to the visual characteristic.
A coefficient for each target area is calculated
by causing the density average value for each target
area on the printed matter P to correspond to the human
visual characteristic. For example, if the density
average value of label
a
(target area 1) is
La
,
the density average value of label
b
is
Lb
, and
the density average value of label
c
is
Lc
in
FIG. 16, the coefficients are calculated using the
human visual characteristic shown in FIG. 12. FIG. 12
is a characteristic diagram showing that even when
stains have the same density, how conspicuous the
stains are differs, depending on the density of the
background image.
In FIG. 12, Las to Lcs are the values obtained
by normalizing the density average values La to Lc on
the basis of a dynamic range (0 to 255). (That is,
Las to Lcs are the values obtained by dividing La to Lc
by 255). The normalized density value is not linearly
proportional to the reflectivity. Even when stains
have the same density, a stain on an area (La) with
a large normalized density value is more conspicuous
than that on an area (Lc) with a small normalized
density value.
Reflectivities Pa to Pc for the individual labels
are found. Then, the ratio of the reflectivities is
calculated to determine a visual characteristic
normalized coefficient (1, m, n) as follows:
Pa:Pb:Pc = 1:m:n
The weight computing section 109 performs weight
calculations using the normalized density difference
(degree of deviation) H for each target area on the
printed matter P calculated at the density difference
normalizing section 106, the visual characteristic
normalized coefficient K for each target area
calculated at the visual characteristic coefficient
section 108, and the area S of each target area
supplied from the area information storage section 103.
Specifically, the weight computing section 109
calculates the degree-of-stain decision value D for
each target area by multiplying the degree of deviation
H for each target area expressed by equation (2), the
area S of each target area, and the visual characteristic
normalized coefficient K (for example, 1, m, n).
For example, if the degree of deviation of a
target area e is He, its area is Se, and its visual
characteristic normalized coefficient is Ke, the
degree-of-stain decision value De is expressed as
follows:
De = He × Se × Ke
The summing section 107 adds all the degree-of-stain
decision values for the individual target areas
on the printed matter P calculated at the weight
computing section 109 and sums up the degree of stain
for all the target areas on the printed matter P as
follows:
J = Σ De
where e is in the range of 1 to n (n is the number
of target areas).
Furthermore, the summing section 107 determines
the degree of stain on the printed matter P on the
basis of the calculated degree of stain. Specifically,
suppose the calculated degree of stain is J and the
judgment threshold value in examination is Jp. Under
this supposition, the summing section 107 makes a
judgment as follows:
If J ≧ Jp, then it judges that the printed matter
P is dirty.
If J < Jp, then it judges that the printed matter
P is clean.
In this case, the judgment threshold value Jp can
be set variously. Consequently, the result of the
examination, for example, the rate of stain, can be set
variously.
Hereinafter, a third embodiment of the present
invention will be explained.
FIG. 13 schematically shows the configuration of
an apparatus for examining the degree of stain on
printed matter according to a third embodiment of the
present invention. The third embodiment is obtained by
adding learning means for creating storage information
in the area information storage section 103 by learning
to the second embodiment. The remaining degree-of-stain
examining part has the same configuration as that
of the second embodiment in FIG. 11. The same parts
as those in the second embodiment are indicated by
the same reference symbols. Explanation of some of
the component parts will be omitted or simplified.
What differs from the second embodiment will be
explained in detail.
In learning, N sheets of the printed matter P are
used. The image input section 101 reads the image data
on the whole surface on one side of each sheet of the
printed matter P and sends the read-out data to the
aligning section 102. The aligning section 102 aligns
the position of the image data inputted from the image
input section 101 as described earlier. An SW 1 is
connected to contact a in the learning mode in the
third embodiment and to contact b in the normal degree-of-stain
examining mode. The image data aligned by the
aligning section 102 is stored in an image memory
section 110.
An average image creating section 111 creates
an average density value image (explained later) on
the basis of the N image data items stored in the
image memory section 110 and sends the created average
density value image to a labeling section 112.
The labeling section 112 carries out a labeling
process of putting the same label on the pixels
included in the same density range and sends the image
data items subjected to the labeling process to an area
extracting section 113.
Using the image subjected to the labeling process,
the area extracting section 113 judges a target area
on the printed matter P by combining the same density
ranges where more than a specific number of pixels
are consecutive, and sends the judged target area to
an area-by-area area-computing section 114.
The area-by-area area-computing section 114
calculates the area of each target area computed at
the area extracting section 113 and sends the result of
the computation to an area-by-area statistical value
computing section 115. The area-by-area statistical
value computing section 115 calculates the density
distribution (histogram) of the average value images
in each target area and calculates the average density
and dispersion in the distribution, for example, the
standard deviation.
The area information storage section 103 stores
the number of target areas and the area, average
density, and average standard deviation of each target
area.
Hereinafter, the operation of the third embodiment
will be explained in detail.
The image memory section 110 stores the image
data on the printed matter P aligned at the aligning
section 102. The image memory section 110 repeats the
operation, for example, N times for N sheets of the
printed matter P. As a result, the image memory
section 110 stores the image data for the N sheets of
the printed matter P aligned.
The average image creating section 111 creates N
average density value images from the image data for
the N sheets of the printed matter stored in the image
memory section 110. A method of creating the images
is to add the density values of N pixels existing
in the corresponding positions on the individual N
images, divide the addition result by N, and thereby
determining the pixel density at the position. This
operation is carried out for all the pixels to create
the average density value image for the N images
(hereinafter, referred to as the N-sheet average image).
On the basis of the N-sheet average image created
by the average image creating section 111, the labeling
section 112 puts the same label on the pixels included
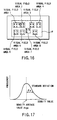
in the same density range. Specifically, a density
histogram is calculated from the N average images
of the printed matter P. In the calculated density
histogram, for example, when plural mountains a to C
are present as shown in FIG. 14, the density average
value and standard deviation of each of mountains a to
c are calculated. For example, if the density average
value of mountain a in FIG. 14 is Avga and its standard
deviation is σa, a pixel with a density lying in the
range La is defined as a pixel belonging to label a,
wherein La is expressed as:
Avga - h × σa ≦ La ≦ Avga + h × σa where h is
an integer.
Similarly, concerning mountain b and mountain c in
FIG. 14, labels are determined as follows:
Avgb - h × σb ≦ Lb ≦ Avgb + h × σb. Avgc - h × σc ≦ Lc ≦ Avgc + h × σc.
Consequently, three labels are used.
Then, the labeling section 12 scans the image data
on the printed matter P as shown in FIG. 15 and judges
which one of the calculated labels La to Lc the pixel
density value exists in. The labeling section 12
carries out the labeling process by putting the same
label on the pixels contained in the same density range
in such a manner that, for example, it puts label
a
on the pixels contained in the density range
La
,
label
b
on the pixels contained in the density range
Lb
, and label
c
on the pixels contained in the
density range
Lc
.
The pixels belonging to the density ranges
excluding the density ranges La, Lb, and Lc are not
subjected to the labeling process and are ignored in
the subsequent processes.
The
area extracting section 113 combines the same
labels where more than a specific number of pixels are
consecutive, in the labeling images obtained from the
labeling section 112. For example, suppose N average
images of the printed matter P are labeled as shown in
FIG. 16. The
area extracting section 113 judges that
the same label where more than a specific number of
pixels are consecutive is one combined area and sets it
as one target area. Consequently, the number of labels
does not necessarily coincide with the number of set
target areas. In FIG. 16, although the number of
labels
a
,
b
,
c
is three, the number of set
target areas is eight.
The area-by-area area-computing section 114
calculates the area of each target area on the printed
matter P extracted by the area extracting section 113.
The area is easily calculated by adding the number of
pixels in each target area.
The area-by-area statistical value computing
section 115 calculates the density distribution in
the N average images for each target area and computes
the density average value and dispersion in the
distribution, for example, the standard deviation.
A method of calculating the values is to compute
a histogram for the N average images for each target
area. For example, suppose the histogram of target
area 1 for the N average images shown in FIG. 16 is
calculated as shown in FIG. 17. Using the histogram,
the area-by-area statistical value computing section
115 calculates the density average value and further
the standard deviation.
The area information storage section 103 stores
the positional information on each target area obtained
at the labeling section 112, the area of each target
area determined at the area-by-area area computing
section 114, and the density average value for each
target area and standard deviation of density value
for each target area calculated at the area-by-area
statistical value computing section 115.
While calculations have been made using N average
images for each target area on the printed matter P,
the density integral value of each corresponding pixel
of the N images may be calculated, a histogram for
the density integral values be made, and the average
value and standard deviation be calculated using the
histogram.
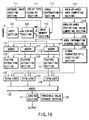
FIG. 18 shows the configuration of the degree-of-stain
examining section (103 to 109) in the third
embodiment (see FIG. 13).
In the third embodiment, the SW1 is connected
to contact b. Using the image data on the printed
matter P aligned by the aligning section 102 and the
positional information on each target area on the
printed matter P obtained from the area information
storage section 103, adders 116, 117, ..., 118 add the
pixel density values for each target area.
Using the area of each target area, the density
average value, and dispersion in the density distribution
(standard deviation) obtained from the area
information storage section 103, feature extracting
sections 119, 120, ..., 121 calculate the amount of
feature in the degree of stain (e.g., the deviation
of density average value) for each target area.
Using the amount of feature in the degree of
stain for each target area extracted by the feature
extracting sections 119, 120, ..., 121, the area of
each target area obtained from the area information
storage section 103, and the visual characteristic
normalized coefficient for each target area calculated
by the visual characteristic coefficient section 108,
totalizers 122, 123, ..., 124 calculate a degree-of-stain
decision value for each target area.
An adder 125 calculates a degree-of-stain decision
value for the printed matter P by adding the degree-of-stain
decision values for the individual target areas
calculated by the totalizers 122, 123, ..., 124. Using
the degree-of-stain decision value calculated at the
adder 125 and the judgment threshold value obtained
from the threshold storage section 126, a judging
section 127 judges the degree of stain on the printed
matter P.
Hereinafter, the operation of the third embodiment
will be explained in detail.
The image input section 101 supplies the digital
image data on the printed matter P. The aligning
section 102 subjects the image data to the aligning
process and tells the area information storage section
103 information on each target area on the printed
matter P, for example, a relative address for each
target area.
Using the image data on the printed matter P
aligned by the aligning
section 102, the
adders 116,
117, ..., 118 add the density values for each target
value on the basis of information on the position of
each target area on the printed matter P obtained from
the area
information storage section 103. For example,
if the pixel corresponding to the coordinates (x, y) of
point t in the image data is included in the target
area
a
as shown in FIG. 9, the
adder 116 adds the
density values of such a pixel. Namely, the
adders 116,
117, ..., 118 calculate the density integral value for
each target area on the printed matter P.
The feature extracting section 119, 120, ..., 121
extract the amount of feature in the degree of stain
necessary for examining the degree of stain on each
target area on the printed matter P. FIG. 19 shows
a detailed configuration of the feature extracting
section 119. Because the feature extracting sections
120 and 121 have the same configuration as that of the
feature extracting section 119, explanation of them
will be omitted.
In FIG. 19, a divider 128 calculates a density
average value by doing division using the density
integral value for each target area on the printed
matter P added at the adder 116 and the area of each
target area obtained from the area information storage
section 103.
Next, a subtracter 129 calculates the density
difference between density average values by doing
subtraction using the density average value for
each target area on the printed matter P calculated
by the divider 128 and the standard density average
value for each target area on the printed matter P
obtained from the area information storage section 103
(see equation 1). Next, the absolute value circuit 130
performs absolute value operation on the result of
calculation from the subtracter 129.
Next, a divider 131 divides the density difference
for each target area on the printed matter P subjected
to the absolute value operation at the absolute value
circuit 130 by the average standard deviation σ of
the N average images for each target area obtained
from the area information storage section 103. In the
division, the divider 131 calculates the density
average value for each target area on the printed
matter P and the deviation H of N average images
(see equation 2).
Instead of using the deviation H as it is, the
output value H may be made "1" or "0", depending on
whether the degree of stain is high or low as follows:
While the feature extracting sections 119,
120, ..., 121 basically perform the same process, the
feature extracting section 119, 120 and the feature
extracting section 121 may perform different processes.
The totalizers 122, 123, ..., 124 calculate the
degree-of-stain decision value De for each target area
(see equation 4) using the deviation H for each target
area on printed matter P, the area S of each target
area on the printed matter P obtained from the area
information storage section 103, and the visual
characteristic normalized coefficient K determined at
the visual characteristic coefficient section 108.
The adder 125 adds the degree-of-stain decision
value De for each target area on the printed matter P
calculated at the totalizers 122, 123, ..., 124 and
thereby calculates the degree of stain J on the whole
surface of the printed matter P:
J = ΣDe
where e is in the range of 1 to n (n is the number
of target areas).
Using the degree of stain J calculated at the
adder 125 and the judgment threshold value Jp in
examination stored in the threshold
value storage
section 126, the judging
section 127 outputs the result
of examination as follow:
In this case, the judgment threshold value Jp can
be set variously. Consequently, the result of the
examination, for example, the rate of stain, can be set
variously.
Of the degree-of-stain decision values De for
the individual target areas on the printed matter P
calculated by the totalizers 122, 123, ..., 124, when
the degree-of-stain decision value for at least one
target area is extremely large, the judging section 127
may judge that the degree of stain is high.
Furthermore, of the amount of feature in the
degree of stain for the individual target areas on the
printed matter P obtained at the feature extracting
sections 119, 120, ..., 121, the amount of feature in
the degree of stain for at least one target area is
extremely large, the judging section may judge that
the degree of stain is high.
Hereinafter, a fourth embodiment of the present
invention will be explained.
FIG. 20 schematically shows the configuration
of an apparatus for examining the degree of stain
on printed matter according to a fourth embodiment
of the present invention. The fourth embodiment is
obtained by eliminating the average density computing
section 104 from the second embodiment.
In the fourth embodiment, making the area of each
target area on the printed matter P equal eliminates
the need for information on the area of each target
area stored in the area information storage section 103.
Consequently, the fourth embodiment is effective in
reducing the volume of information.
Specifically, a method of extracting a target area
on the printed matter P is to extract a target area at
intervals of a specific number of pixels (at regular
intervals), for example, in blocks of m pixels × n
pixels. In this case, the area of each target area on
the printed matter P is constant.
Thus, the degree-of-stain decision value De is
expressed as:
De (the degree-of-stain decision value) = He
(deviation) × Ke (coefficient).
Hereinafter, a fifth embodiment of the present
invention will be explained.
An evaluation may be made using the decision
value calculated on one side and that on the other side.
In this case, of the decision values on both sides,
the result of examination on the side whose decision
value is larger is used as the final result of the
examination, which enables higher-accuracy degree-of-stain
examination.
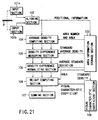
FIG. 21 schematically shows the configuration
of an apparatus for examining the degree of stain on
printed matter according to the fifth embodiment of the
present invention. In the fifth embodiment, two image
input sections 101a, 101b are provided to examine both
sides of the printed matter P. The fifth embodiment
is such that the second embodiment is applied to both
sides of the printed matter P.
Specifically, the individual sections 102 to 109
excluding the image input sections 101a, 101b perform
the specific processes on the image data items on
both sides of the printed matter P. Use of not only
the result of examination on one side of the printed
matter P but also that on the other side realizes
a higher-accuracy examining apparatus. For example,
when the normalized density difference added for
only one side of the printed matter P both sides of
which are printed is greater than a specific threshold
value of the degree of stain, the summing section 107
judges that the degree of stain on the printed matter
is high.
As described above, with the fifth embodiment,
degree-of-stain-on-printed-matter examination can be
made with as high accuracy as human senses by judging
the degree of stain on the whole surface of the printed
matter (the degree of dirtiness persons feel from
the whole surface of the printed matter) on the basis
of the degree of stain (deviation from a reference
value) for at least two target areas on the printed
matter, the area of each target area on the printed
matter, and the target area characteristic coefficient
corresponding to human senses for each target area on
the printed matter.
Furthermore, pieces of printed matter can be
arranged in the order of human senses, for example, in
the order in which the cleanest one comes first and the
dirtiest one comes last. Moreover, the degree of stain
on one side and that on the other side may be evaluated
and, on the basis of the evaluation, stains clustered
only on one side may be examined.
The present invention is not limited to the above
embodiments and may be practiced or embodied in still
other ways without departing from the spirit or
essential character thereof.