EP0919918B1 - Apparatus for randomly sampling instructions in a processor pipeline - Google Patents
Apparatus for randomly sampling instructions in a processor pipeline Download PDFInfo
- Publication number
- EP0919918B1 EP0919918B1 EP98309631A EP98309631A EP0919918B1 EP 0919918 B1 EP0919918 B1 EP 0919918B1 EP 98309631 A EP98309631 A EP 98309631A EP 98309631 A EP98309631 A EP 98309631A EP 0919918 B1 EP0919918 B1 EP 0919918B1
- Authority
- EP
- European Patent Office
- Prior art keywords
- instructions
- instruction
- pipeline
- sampling
- software
- Prior art date
- Legal status (The legal status is an assumption and is not a legal conclusion. Google has not performed a legal analysis and makes no representation as to the accuracy of the status listed.)
- Expired - Lifetime
Links
Images

Classifications
-
- G—PHYSICS
- G06—COMPUTING; CALCULATING OR COUNTING
- G06F—ELECTRIC DIGITAL DATA PROCESSING
- G06F11/00—Error detection; Error correction; Monitoring
- G06F11/30—Monitoring
- G06F11/34—Recording or statistical evaluation of computer activity, e.g. of down time, of input/output operation ; Recording or statistical evaluation of user activity, e.g. usability assessment
- G06F11/3466—Performance evaluation by tracing or monitoring
- G06F11/348—Circuit details, i.e. tracer hardware
-
- G—PHYSICS
- G06—COMPUTING; CALCULATING OR COUNTING
- G06F—ELECTRIC DIGITAL DATA PROCESSING
- G06F11/00—Error detection; Error correction; Monitoring
- G06F11/30—Monitoring
- G06F11/34—Recording or statistical evaluation of computer activity, e.g. of down time, of input/output operation ; Recording or statistical evaluation of user activity, e.g. usability assessment
- G06F11/3466—Performance evaluation by tracing or monitoring
Definitions
- the present invention relates generally to measuring the performance of a computer system, and more particularly to sampling executing instructions.
- a profile is a record of performance data. Frequently, the profile is presented graphically so that performance bottlenecks can readily be identified.
- Profiling can be done by instrumentation and simulation. With instrumentation, additional code is added to a program to monitor specific events during execution of a program. Simulation attempts to emulate the behavior of the entire program in an artificial environment rather than executing the program in the real system.
- Instrumentation perturbs the program's true behavior due to the added instructions and extra data references.
- Simulation avoids perturbation at the expense of a substantial performance overhead when compared to executing the program on a real system.
- instrumentation or simulation it is usually difficult to profile an entire large scale software system, i.e., application, operating system, and device driver code.
- Hardware implemented event sampling can also be used to provide profile information of processors.
- Hardware sampling has a number of advantages over simulation and instrumentation: it does not require modifying software programs to measure their performance. Sampling works on complete systems, with a relatively low overhead. Indeed, recently it has been shown that low-overhead sampling-based profiling can be used to acquire detailed instruction-level information about pipeline stalls and their causes. However, many hardware sampling techniques lack flexibility because they are designed to measure specific events.
- Most extant microprocessors such as the DIGITAL (RTM) Alpha AXP 21164, the Intel (RTM) Pentium Pro, and the MIPS (RTM) R10000 provide event counters that can count a variety of events, such as data cache (D-cache) misses, instruction cache (I-cache) misses, and branch mispredicts.
- the event counters generate an interrupt when the counters overflow so that the performance data in the counters can be sampled by higher levels of software.
- Event counters are useful for capturing aggregate information, such as the number of branch mispredicts that the system incurred while executing a particular program, or part thereof.
- known event counters are less useful for attributing state information to individual instructions, such as which branch instructions are frequently mispredicted. This may be due to the fact that the program counters (PC) of instructions that caused the events may no longer be available when the event counter overflows and interrupts.
- PC program counters
- An out-of-order processor fetches and retires instructions in order, but processes the instructions according to their data dependencies. Processing instructions can involve register mapping, instruction issuing and executing. An instruction is said to be "in-flight" from the time it is fetched until it retires or aborts.
- a first stage of the processor pipeline fetches a set of instructions from the instruction cache (I-cache).
- the set of instructions are decoded.
- the instruction decoder identifies which instructions in the fetched set are part of the instruction stream.
- the PC is usually predicted ahead of time by a branch or jump predictor.
- the processor will abort the mispredicted instructions which occupy a "bad" execution path, and will restart fetching instructions on the "good” path.
- registers specified in operands of instructions are dynamically renamed to prevent write-after-read and write-after-write conflicts. This renaming is accomplished by mapping architectural or "virtual" registers to physical registers. Thus, two instructions that write the same virtual register can safely execute out-of-order because they will write to different physical registers, and consumers of the virtual registers will get the proper values.
- a register mapped instruction resides in the issue queue until its operands have been computed and a functional "execution" unit of the appropriate type is available.
- the physical registers used by an instruction are read in the cycle that the instruction issues. After instructions have executed, they are marked as ready to retire and will be retired by the processor when all previous ready-to-retire instructions in program order have been retired, i.e., instructions retire in the correct program order. Upon retirement, the processor commits the changes made by the instruction to the architectural "state" of the system, and releases resources consumed by the instruction.
- Numerous events may delay the execution of an instruction.
- the fetch unit may stall due to an I-cache miss, or the fetch unit may fetch instructions along a bad path due to a misprediction.
- the mapper may stall due to lack of free physical registers, or lack of free slots in the issue queue. Instructions in the issue queue may wait for their register dependencies to be satisfied, or for the availability of functional execution units.
- Instructions may stall due to data cache misses. Instructions may trap because they were speculatively issued down a bad path, or because the processor took an interrupt. Many of these events are difficult to predict statically, e.g, by an examination of the code, and all of them degrade the performance of the system. Simple event counters are inadequate to attribute this type of information to individual instructions. In addition, it is difficult to exactly measure the lengths of the delays to determine which delays deserve special attention.
- An example program consists of a loop containing a random memory access instruction, for example a load instruction, followed by hundreds of null operation instructions (nop).
- the event samples are widely distributed over the next 25 instructions, illustrating not only skewing but significant smearing as well.
- the wide distribution of samples makes it nearly impossible to attribute a specific event to the particular instruction that caused the event. Similar behavior occurs when counting other hardware events.
- event counters only record the fact that an event occurred; they do not provide any additional state information about the event. For many kinds of events, additional information, such as the latency to service a cache miss event, would be extremely useful.
- a blind spot is any non-interruptible code, such as high-priority system routines and PAL code, because the event will not be recognized until its interrupt is honored. By that time, the processor state may have changed significantly, most likely giving false information.
- one instruction stalling in a pipeline stage prevents later instructions from passing through that pipeline stage. Therefore it is relatively easy to identify "bottleneck" instructions on an in-order processor, that is bottleneck instructions tend to stall somewhere in the pipeline.
- identify stalls by measuring the latency of an instruction as it passes through each pipeline stage, and comparing the measured latency to the ideal latency of that instruction in each pipeline stage. An instruction can be presumed to have stalled in a stage when it takes longer than the minimum latency to pass through that stage.
- stalls in one pipeline stage may not contribute to the overall execution time of a program when another pipeline stage is the bottleneck.
- the fetcher and mapper of the instruction pipeline may often stall because of "back-pressure" from an execution unit delayed by D-cache misses.
- CML cache miss look-aside
- Some processors such as the Intel Pentium, permit software to read the contents of the branch predictor's branch target buffer (BTB).
- BTB branch target buffer
- Conte et al. developed a very low overhead technique to estimate edge execution frequencies of a program, see “Using branch handling hardware to support profile-driven optimization,” Proceedings of the 27th Annual International Symposium on Microarchitecture, pp. 12-21, November 30, 1994.
- an apparatus for sampling instructions in a processor pipeline of a system comprising:
- an instruction to be profiled is randomly selected, and a profile record of what happens during the execution of the instruction is accumulated in a set of internal profile registers of the processor.
- a profile record of what happens during the execution of the instruction is accumulated in a set of internal profile registers of the processor.
- an interrupt is generated.
- software can poll a flag or register. The recorded information characterizing the details of how the instruction was processed in the pipeline can be sampled from the internal profile registers by software.
- the profile registers can record many useful facts about an instruction's execution.
- Example performance information can include: the number of cycles the selected instruction spent in each stage of an execution pipeline, i.e., stage latencies, whether the instruction suffered I-cache or D-cache misses, the effective addresses of its memory operands, or branch/jump targets, and whether the instruction was retired or aborted.
- Special-purpose hardware could count and record the number of instructions that issue while a profiled instruction is executing to measure the level of concurrent execution. However, this fails to account for instructions that issue but are aborted, and therefore fail to retire.
- Provided here is a measurement of the amount of useful concurrency.
- the useful concurrency being the average number of instructions that issue in parallel and successfully retire with a given instruction. Instructions that issue but subsequently abort are not useful. Then, instructions whose stalls are not masked by useful concurrency can be classified as bottlenecks. To state this another way, a key metric for pinpointing performance bottlenecks on an out-of-order processor is the number of issue slots that are wasted while a given instruction executes.
- N-wise sampling a technique called "N-wise sampling” is provided.
- the basic idea is to implement a nested form of sampling.
- a window of instructions that may execute concurrently with a first profiled instruction is dynamically defined.
- a second instruction is randomly selected for profiling from the window of instructions.
- the profiled and second instruction form a sample pair for which profile information can be collected.
- Pair-wise sampling facilitates the determination of the number of wasted issue slots attributable to each instruction, and pinpoints bottlenecks much more accurately than known techniques.
- pair-wise sampling is very flexible, forming the basis for analysis that can determine a wide variety of interesting concurrency and utilization metrics.
- Examples of information that can be captured include: the instruction's address (program counter or PC), whether the instruction suffered an instruction cache miss and the latency incurred to service the miss. If the instruction performs a memory operation, then determine whether the instruction suffered a data-cache miss and measure the latency for satisfying the memory request. Furthermore, the amount of time the instruction spends in each pipeline stage can be measured. The profile information can also indicate whether the instruction retired or aborted, and in the latter case what kind of trap caused execution of the instruction to be aborted.
- the information is collected in a set of profiling registers as the instruction progresses through the execution pipeline.
- an interrupt is delivered to higher level software.
- the software can then process the information present in the profiling registers in a variety of ways.
- the disclosed technique is an improvement over existing performance-monitoring hardware, and can be efficiently implemented at a relatively low hardware cost in modem microprocessors that can issue instructions out-of-order.
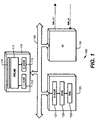
- FIG. 1 shows a computer system 100 which can use the sampling method and apparatus as described herein.
- the system 100 includes one or more processors 110, off-chip memories 1209, and input/output interfaces (I/O) 130 connected by bus lines 140.
- the processors 110 can be implemented on integrated semi-conductor chips as multiple execution pipelines 111 including functional execution units, on-chip data-caches (D-cache) 113 and instruction caches (I-cache) 112, for example, the Digital Equipment Corporation Alpha 21264 processor.
- the processor chip 110 also includes hardware 119 described in greater detail below for sampling processor states for selected instructions.
- the off-chip memories 120 can be arranged hierarchically, including general purpose caches (B-cache or SRAM) 121, volatile memories (DRAM) 122, and persistent memories (disk) 123.
- the I/O 130 can be used to input and output data to and from the system 100.
- instructions and data of software programs are stored in the memories 120.
- the instructions and data are generated conventionally using known compiler, linker, and loader techniques.
- the instructions and data are transferred to the execution pipeline 111 of one of the processors 110 via the caches 112-113.
- the instructions are decoded for execution. Some of the instructions operate on the data. Other instructions control the execution flow of the programs.
- Performance data can be related to memory operations and execution flows.
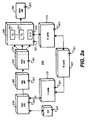
- Figure 2a shows an execution pipeline 200 of one of the processors 110 of Figure 1 having a plurality of stages serially arranged as, for example, fetch, map, issue, execute, and retire units, respectively 210, 220, 230, 240, and 250.
- the rate at which the pipeline 200 processes information (data and instructions) is controlled by system clock signals on lines 201, i.e., so called clock "cycles.”
- Each clock cycle defines a "slot" or interval of time when a stage of the pipeline 200 can do a discrete amount of processing.
- a processing slot usually carries forward instructions, and in the case of execution units, described below, data, generally “data items” hereinafter.
- data generally "data items" hereinafter.
- the clock continues to cycle, but no meaningful instructions are carried forward.
- the present apparatus and method can sample state information about processor slots that carry "garbage” or no useful data. These are known as “wasted” slots. Identifying and sampling wasted slots can be an important precursor to optimizing tasks, since wasted slots do no useful work, and therefore degrade system performance. Therefore, in general, what is being sampled here are not simply “events” or “instructions” as in the prior art, but state information related to pushing processor slots through the pipeline 200, whether they are associated with valid or invalid instructions.
- the B-cache 121 transfers data items to the I-cache 112 and D-cache 113, respectively.
- the fetch unit 210 using some type of a translation look-aside buffer (TLB) 205 to resolve virtual addresses to physical addresses, fetches next instructions to be executed from the I-cache 112.
- TLB translation look-aside buffer
- the items fetched from the I-cache 112 are generally executable instructions. However, these can also be invalid instructions, as in the case of I-cache misses "garbage" data, i.e., not an instruction.
- a set of "instructions" are fetched during a single processor cycle.
- the set can include, for example, four instructions.
- the pipeline 200 is four slots wide.
- Other types of processors may fetch fewer or more instructions during a single processor cycle. In general, this means that each cycle fills four processing slots from the cache. Some of the slots may be wasted when the I-cache 112 does not have the available data. Instead of pausing, holding up all processing, the slots are carried forward in any case to make them available for the purpose of sampling, although a garbage "instruction" in a slot may never issue for execution.
- selected instructions can be augmented with additional information to allow sampling or system profiling.
- An augmented instruction is described below with reference to Figure 4. It should be noted that in other implementations, the augmentation of the selected instructions can take place in any of the stages of the processor, including the issue unit 230.
- the operands of instructions are dynamically assigned or "mapped" to physical registers using the map unit 220 in the next stage of the pipeline 200.
- the map unit assigns physical registers to architectural or "virtual" registers. In other words, there may not be a one-to-one correspondence between virtual and physical registers.
- the issue unit 230 includes an issue queue having a head-of-the-queue entry 231 for the next instruction to be executed. It should be noted, that one or more instructions in the issue unit 230 may be stalled because resources or data needed by the instructions are not available. Therefore, other pending instructions may be issued out-of-order from the queue 230 "around" the stalled instructions. The correct execution order will be affirmed in the retire unit 250 described below.
- the instructions are issued to functional execution units (E0 ,..., E3) 241, and a load/store (Id/st) unit 242.
- Each of the execution units 241 may be designed to handle instructions with specific types of operator codes (opcodes), for example, integer and floating point arithmetic, branching and jump instructions, etc. While being processed by the execution units intermediate values may be produced.
- the Id/st unit 240 executes memory access instructions, for example, loads and stores data from and to the D-cache 113.
- the Id/st unit 242 is especially identified because it may experience long delays. Also note, memory access instructions with long latencies may "complete" long before the data are brought into the processor to improve throughput.
- the termination of execution of an instruction is handled by the retire unit 250.
- the retire unit 250 commits the processing state. It should be noted, that some instructions may abort or be trapped. For example, the execution flow may change after an instruction is fetched, or an instruction may suffer an exception trap. In these cases, the instruction and all subsequent instructions already in the pipeline are discarded and the speculative processing state is rolled back. As an advantage here, discarded or "aborted" instructions are also profiled, as are wasted processor slots. In other words, termination can mean retiring a completely executed valid instruction, post-processing a partially executed valid instruction, or discarding an invalid instruction or wasted slot.
- the basic idea which underlies the present technique follows the processing of "data items" in selected "slots," primarily instructions, as they progress through the stages of the pipeline 200.
- Profiling hardware dynamically gathers detailed state information.
- the state information can come from any of the pipeline stages, or elsewhere in the system 100, for example, first and second level caches, or other sub-systems.
- the state information can be directly attributed to specific events.
- the design strategy is to collect information that is difficult to determine statically in a profile record. This makes the profile record useful for performance tools, profile-directed optimization, or for making resource allocation policy decisions in operating system and application level software, including dynamic adjustments directly in response to the sampling and analysis. Recall, the present method and apparatus is designed to operate on real functional systems.
- the stages of the pipeline are fetch 210, map 220, issue 230, execute 240, and retire 250.
- any "in-flight" instruction 202 processed by the pipeline 200 can be selected for sampling by line 512.
- the selection is controlled by a value of a counter 510.
- the value of the counter can be initialized by line (init) 511.
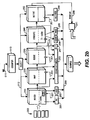
- State information such as instruction addresses (PC) 281, branch history bits (HIST) 282, stage latencies 283, branch taken indication (T) 287 data address (ADDR) 284, data miss (MISS) 285, and retired status 286 can be sampled on lines 288.
- Termination of the processing of the selected instructions can generate an interrupt signal on line 289.
- the interrupt signal 289 can cause software to sample the state information 281-286 via lines 299.
- software may poll line 289 via an internal processor register 541.
- An out-of-order execution processor fetches and retires instructions in order, but executes them according to their data dependencies.
- An instruction is said to be "in-flight” from the time it is fetched until it terminates, e.g., retires or aborts. Instructions, after mapping, are placed in the issue unit 230, and wait there until registers holding input operands are updated.
- the fetch unit 210 fetches and decodes a set of instructions from the instruction cache 112.
- the instruction decoder which may be part of the fetch unit 210, identifies which instructions in the fetched set are part of the instruction stream. Because it takes multiple cycles to resolve the program counter (PC) of a next instruction to fetch, the next PC is predicted by a branch or jump predictor, which may be part of fetch unit 210. If the prediction is incorrect, then the processor will abort the mispredicted instructions, i.e., the instruction fetched on a "bad" path, and will restart fetching instructions on the "good” path.
- PC program counter
- registers are dynamically renamed by the map unit 220 to prevent write-after-read and write-after-write conflicts. Two instructions that write the same virtual register can safely execute out-of-order because they will write different physical registers, and consumers of the virtual registers will get the proper values. Instructions are fetched, mapped, and retired in order, although they may execute out-of-order.
- the register map unit 220 assigns operands of fetched instructions to valid physical registers. That is, the virtual names of the register operands are renamed to the physical register space of the processor. Instructions then proceed to the instruction queue 230 where they wait for two events before executing. First, their register dependencies must be resolved. Second, the resources the instruction needs, e.g., execution units, registers, cache ports, memory queues, etc., must be available. This means that required resources cannot be reallocated for any currently mapped instructions.
- the instruction's operands are looked up in the physical register file.
- the content of the operand registers and some information about the instruction are then sent to the appropriate execution unit 240 and executed.
- the instruction is finished executing, and the instruction is the oldest "non-retired" instruction in the processor, the instruction retires. This frees the resources used by the instruction, such as physical registers and cache ports.
- the fetch unit 210 may stall due to an I-cache 112 miss, or the fetch unit 210 may fetch instructions of a mispredicted path.
- the map unit 220 may stall due to lack of free physical registers, or lack of free slots in the issue unit 230.
- Instructions in the issue unit 230 may wait for their register dependencies to be satisfied, or for the availability of execution units 240. Instructions may stall due to misses in the D-cache. Instructions may trap because they were speculatively issued down a bad path, or because the processor took an interrupt, such as an illegal operation or memory address. Many of these conditions are difficult to predict at compile-time, and all of them degrade the performance of the system 100. This makes it valuable to sample the information available on lines 288.
- a memory 300 for storing profile information for each instruction being sampled.
- the memory 300 can be in the form of a register file or buffer. In other words, a selected instruction that will be sampled is directly identified with the register file 300.
- the register file 300 can include a plurality of registers. Alternatively, the file 300 can be implemented as a single indexable register with multiple fields.
- the file 300 is coupled to the components of the pipeline 200 by lines 288 of Figure 2b so that performance information related to the selected instruction can be captured for each stage of the pipeline 200.
- the profile registers 300 are more than simple "event" counters as found in the prior art, here the registers collect performance information that is attributable to specific known instructions and events.
- the number of bits allocated for each register depends on the type of information stored therein, for example, instruction addresses (64 bits), latencies, i.e., cycle counts (8 or 10 bits), discrete events (1 bit per event) and so forth. These numbers are merely a guideline. Other implementations may use different numbers of bits for the various registers 300, this is a design choice.
- a profile PC register 310 stores the PC of the selected instruction. As described below, an instruction that is being profiled has a "profile" bit asserted.
- the PC register 310 can also include the opcode of the selected instruction.
- additional bits of the register 310 can store the identifier of the thread.
- Other fields of the register 310 can store the process identifier, the address space number, the CPU number, and the instruction number (inum) of the instruction being executed.
- register 310 can store hardware context and thread identifiers. By storing this information, the profile information can be directly attributed to a specific instruction.
- the sampled information can be filtered according to range of addresses, opcode, execution threads, address spaces, and the like.
- a profile effective address register 320 is loaded with an address associated with the selected instruction. If the instruction is a memory access instruction, then the physical address resulting from the translation of the virtual memory address can be captured in register 320. If the instruction is a jump or a branch then the physical address resulting from the translation of the virtual target PC can be captured in register 320.
- the present sampling technique it is possible to sample over all "instructions" processed by the pipeline 200, independent of the sampling rate.
- the instructions can be valid instructions, invalid instructions, non-interruptible instructions, or "garbage" instructions.
- the captured effective addresses are statistically representative of the overall behavior of the program. By capturing the effective addresses of sampled instructions, memory accesses and execution flows can precisely be correlated to actual dynamic executions.
- a profiled event register 330 is partitioned into, for example, one bit fields.
- the 1-bit fields record events for the selected instruction. When an instruction is first selected, the register is cleared. Events could include cache misses, branch mispredicts, resource conflicts, traps and exception conditions, retire/abort/invalid, TLB misses, taken/non-taken, data dependency stall, resource dependency stalls, and so forth. Note, this implementation allows multiple events to be attributed to a single instruction. It should be noted that event information is collected for both retired and aborted instructions. In order to reduce the size of the event register 330, some of the bit fields can be used to record different types of mutually exclusive events depending on the opcode of the instruction.
- a profiled path register 340 is used to capture recent branch taken/not-taken information from a branch history table.
- Branch history tables are well known in the art for other uses.
- Global branch taken history can be used to indicate the execution path which caused the selected instruction to be fetched. Note that the instruction does not have to be a branch instruction for this information to be useful. The use of the path information is described in greater detail below.
- Latency registers 350 store timing information taken at check points while a selected instruction is in flight, e.g. between the various stages of the pipeline 200.
- the checkpoints may differ from processor to processor depending on where an instruction might be stalled waiting for some event or resource.
- Each latency register 350 counts the number of cycles an instruction spent between two checkpoints.
- the corresponding latency register 350 is first cleared and then incremented once per cycle until the instruction passes the next checkpoint when the next latency register is initialized and begins counting.
- the number of latency registers 350 depends on the number of stages of the pipeline 200 in a particular implementation.
- a complete latency profile is stored in the latency registers 350 when the instruction aborts or retires.
- a list of potentially useful latencies to collect includes: fetch-to-map, map-to-data ready, data ready-to-execute, execute-to-retire ready, retire ready-to-retire delays.
- For memory instructions (loads and stores) latencies can be issue-to-completion. This last latency differs from other latencies in that some memory operations may retire before the data they operate on have actually been brought into the processor.
- These latencies could be directly counted in the registers 350, or the registers can collect raw cycle counts, in which case, profiling software computes differences between raw counts for successive stages to determine actual latencies.
- a circuit which counts example pipeline latency clock cycles is described below with reference to Figure 6.
- the updating of the information in the register(s) 300 does not have to happen immediately, a delay is acceptable. All that is required is that the interrupt signaling the fact that the selected instruction has completed (retired or aborted) is delayed until all information in the register file 300 have been updated, or the interrupt handler can stall until the profile file 300 has been updated.
- profile register file 300 can be replicated. If there are multiple copies of the profile register file, then multiple instructions can be selected for profiling, either serially, or concurrently. In this case, each selected instruction is explicitly identified with a specific register file as described below. Multiple register files can be sampled in response to a single interrupt signal to reduce the amount of overhead.
- each instruction 400 includes a sample field.
- the sample field can be a one bit tag called the "sample” bit (S) 401.
- S sample bit
- the instruction is selected for sampling. Asserting the bit 401 actives the sampling hardware which collects the profile information, and also causes the interrupt when the selected instruction completes (retired or aborted).
- each "instruction" fetched can be consecutively numbered with an "inum” value. In this case, instructions with specific inum values can be selected. The mechanism for selecting instructions is described below.
- the profile register file 300 can be read when the fields have been updated and the interrupt signal is generated.
- the interrupt signal can cause privileged profiling software (PSW) to process the contents of the profile registers 300.
- PSW privileged profiling software
- the augmented instruction 400 can include the following additional fields, up to three instruction operands (op1, op2, and op3) 411-413, the program counter (PC) 420, the operator code (opcode) 430.
- a valid field (V) 431 can indicate whether the "instruction" in the selected slot is valid or not by setting a one bit field to either true or false.
- Fields 440 and 450 can be reserved for indicating instruction related I-cache and TLB misses, respectively. Note, because a single instruction can include multiple operands, multiple misses are possible for that instruction.
- multiple instructions may concurrently be profiled.
- the instruction 400 is also augmented to include a sample register file identifier (ID) field 402. This allows profile information to be directly linked to one of the several register files 300. As noted above, here there is a direct association between selected instructions and profile registers. The profile information collected in the registers is therefore directly attributable to a specific instruction.
- ID sample register file identifier
- the overhead of the present profiling is reduced by restricting the number of instructions that can concurrently be profiled, e.g., bit 401 is set.
- instructions to be profiled are selected during a specific stage of the processor pipeline 200, e.g., during fetching, and the selected instructions are tagged by asserting the sample bit 401. If the sample bit 401 is asserted, then the components of the pipeline 200 forward profile information to the profile register file(s) 300.
- each decoded instruction state that passes through the processor pipeline 200 is augmented with additional information as described above.
- An instruction is considered to be in flight from the time it is fetched until it retires or aborts.
- the instruction is augmented with at least one sample bit 401.
- the sample bit 401 is part of the state of every in-flight instruction and cache/memory request. When the bit 401 is asserted, the bit indicates that profiling information is recorded for this instruction, otherwise not.
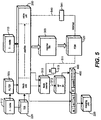
- a fetch counter 510 is initialized by, for example, privileged profiling software (PSW) 520 via line 511.
- PSW privileged profiling software
- the PSW 520 can initialize the counter 510 with a value randomly selected from an interval of values having a predetermined size.
- the size of the interval determines the average frequency of sampling.
- the size of the interval can be varied.
- Other randomizing techniques to initialize the value of counter 510, including hardware, may also be used.
- the counter 510 For each instruction 400 fetched, the counter 510 is incremented or alternatively, in a different implementation, decremented from its initial value by the fetch unit 210 of the pipeline 200.
- the counter 510 depending on the implementation, either over flows or under flows, the current fetched instruction has its sample bit 401 asserted, and the ID field 402 can also be initialized when multiple instructions are selected for sampling.
- the counter 510 is incremented every cycle, instead of for each instruction fetched, e.g., the counter 510 counts fetch opportunities and not actual instructions fetched. For example, if the fetch unit 210 can fetch four items from the I-cache 112 during each clock cycle, then there are four fetch opportunities. It may well be that one or more fetches from the I-cache will miss, or fetch a "bad" instruction. In the case of a miss, the slot available for the missed instruction will contain "garbage," and the instruction will need to be marked as invalid. A bad instruction is one that lies on a bad execution path, or will otherwise abort.
- Counting cycles instead of fetched instructions advantageously simplifies the design. Just counting valid fetched instructions can be quite complicated because control flow can branch into, or out of the group of fetched instructions, and it becomes necessary to decode all instructions to determine which are valid, no longer is it a simple matter of just incrementing the counter by four.
- anything that are fetched from the I-cache during a cycle can be selected for sampling so that the true performance of the I-cache 112 and pipeline 200 can be determined.
- there is no bias so the results will be a statistically correct estimate of the performance of the system.
- the sampled instruction information can be filtered by a filter 505. Filtering can be on the basis of instruction opcode, operands, or more complex filtering criteria such a first type of instruction followed by another type of instruction within some period of time. If there is filtering on the input to the pipeline 200, then the counter 510 can be reset. There a number of ways to do this. In one way, the current initial value of the counter 510 is stored in an init register 513. When an instruction is filtered, the counter 510 is reloaded with the value stored in the init register 513 to recall the initial randomized selection.
- the pipeline 200 After the instruction has been augmented, the pipeline 200 provides the profiling information 281-286 of Figure 2b to the register file(s) 300.
- the retire unit 250 in response to the instruction completing or aborting, completes the filing of profile information, and generates an interrupt signal on line 540 so that the PSW 520 can sample the profile information.
- PSW 520 may poll line 540 via an internal processor register or memory location (541).
- processor register or memory location 541.
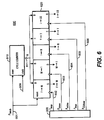
- Figure 6 shows a circuit 600 for counting exemplary latencies: fetch-to-map (F M), map-to-issue (M I), issue-to-retire (I R), fetch-to-trap (F T), and issue-to-ldst (I LS).
- the circuit 600 includes a cycle counter 610 coupled by line 611 to latches 620.
- the cycle counter 610 and latches 620 are initialized by signal Pfetch on line 601. This signal is generated when an instruction to be profiled is fetched, for example, a signal derived from the sample bit 401.
- the counter 610 is incremented by clock signals on line 609. Each clock signal corresponds to one processor cycle.
- stage transitions in the pipeline 200 trigger signals Pmap, Pissue, Pretire, Ptrap, and PLSdone respectively on lines 602-606.
- the corresponding latches 620 can be read on lines 612-616 for storing in the profile latency registers (or fields) 350 of Figure 3.
- the profiling hardware described above can be utilized in a variety of different ways. Because the present technique provides very detailed information about the execution of individual instructions, one application could profile a large number of instructions. The sample information can be stored in a memory buffer for later processing by profiling tools to produce detailed instruction-level information.
- the information can be used to develop, for example, histograms of load latencies for each load instruction, histograms of instruction execution times, and perhaps even a moderately comprehensive analysis of the pipeline state for each instruction. Because the amount of information provided by this approach is likely to be quite high, the overall memory overhead of the present technique is also likely to be quite high because a substantial amount of memory traffic is involved. For example, if a billion instructions are fetched per second, and sampling is performed every 10,000 fetched instructions, then the data rate for the profile information will be approximately 2.4 MB per second.
- the following section describes software-implemented methods for reducing bandwidth by aggregating profile information.
- the volume of sampled data can be reduced by ignoring some fields of the profile record, e.g., the data in the profile registers 300, except when they are explicitly requested.
- a user of the system 100 may desire different levels of profiling. In a lowest overhead mode, the profiling application software can generate a profile report for all or part of a program, using just the PC and retire-delay fields. Depending on the optimization to be performed, other per-PC values may be summarized by averaging or other statistical metrics, such as minimum, maximum, or computing standard deviation. Given more time to process data, the profiling application may produce histograms of various instruction latencies.
- the effective memory address, branch target address, and branch history samples will likely require more expensive processing than the other fields. These fields can probably be ignored except when gathering data to perform specific optimization tasks. Given the inter-instruction fetch distance between instructions in cycles, the profiling application can also gather information about levels of concurrency.
- Filtering of the profiling information can also be done by hardware means, for example, a mask register, or programmable logic. For example, only sample when there was a cache miss, or when the instruction retired, or other Boolean combinations of opcodes, operands, addresses, events and latencies.
- the present profiling technique can be used to get a precise understanding of the internal operation of an out-of-order issue processor, such as the Alpha 21264 processor.
- an out-of-order issue processor such as the Alpha 21264 processor.
- an instruction might stall in the issue unit 230, either because some of its operands are not data ready, because some of the resources required for the execution of the selected instruction are unavailable, or because other instructions were chosen to execute ahead of it.
- An instruction might stall in the map stage, which makes virtual to physical register mappings, either because the machine is out of physical registers, or because there are too many instructions in flight, or because the issue unit 230 is full; meaning there is no place to put the about-to-be executed instruction.
- an instruction might stall in the retire unit, because previously issued instructions, in program order, have not yet completed.
- a method 700 for profiling can include the following steps.
- the profiling state is initialized in step 710.
- registers are cleared and counters are assigned their initial values.
- an instruction is fetched and counted.
- the instruction is selected when the number of fetched instructions since initialization is equal to a predetermined random number.
- the selected instruction is augmented to indicate its selection.
- profile information is collected in step 740.
- the collected information is sampled in step 750. Sampled information can be buffered for subsequent processing. It is also possible to sample a particular profiling state to extract more detailed information.
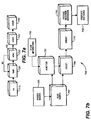
- a process 799 estimates statistics of properties of instructions processed by the pipeline 200.
- the process 799 can include the following steps.
- Step 751 reads the profile record 300 sampled as described above in step 750.
- the record is read when the selected instruction completes.
- step 760 the sample is selected or discarded depending on a function 755 which takes into consideration state information of the system.
- function 755 takes as input state information 756 such as addresses, process identifiers, address space numbers, hardware context identifiers, or thread identifiers of the selected instructions. Function 755 may also use state information such as path-identifying information, opcodes, operands, latencies, or events experienced by the selected instructions.
- the event information can be retire/abort/invalid status, cache hit/miss, branch mispredict, trap status, TLB hit/miss, and data resource dependency status, and so forth.
- Step 760 produces a subset of samples based on the function 755.
- statistics 790 are determined. These statistics can include averages, standard deviations, histograms (distribution), and error bounds of the properties of the sampled instructions. For example, average rates at which specified events occur, average latencies of instruction execution and memory accesses. Averages of execution rates of processes, threads, or hardware contexts can also be determined. The histograms can show the distribution of instruction execution, memory access rates, or latencies. The bound on the errors can be approximated by a reciprocal of a square root of the number of samples for the particular property being sampled.
Abstract
Description
- The present invention relates generally to measuring the performance of a computer system, and more particularly to sampling executing instructions.
- Computer processors are getting faster, yet software application performance is not keeping pace. For large commercial applications, average processor cycles-per-instruction (CPI) values may be as high as 2.5 or 3. With a four-way instruction issue processor, a CPI of three means that only one issue slot in every twelve is being put to good use. It is important to understand why software throughput is not keeping up with hardware improvements.
- It is common to blame such problems on memory latencies. In fact, many software applications spend many cycles waiting for data transfers to complete. However, other problems, such as branch mispredicts also waste processor cycles. Independent of the general causes, system architects, and hardware and software engineers need to know which instructions are stalling and why in order to improve the performance of modem computer systems incorporating complex processors.
- Typically, this is done by generating a "profile" of the behavior of a system while it is operating. A profile is a record of performance data. Frequently, the profile is presented graphically so that performance bottlenecks can readily be identified.
- Profiling can be done by instrumentation and simulation. With instrumentation, additional code is added to a program to monitor specific events during execution of a program. Simulation attempts to emulate the behavior of the entire program in an artificial environment rather than executing the program in the real system.
- Each of these two methods has its drawbacks. Instrumentation perturbs the program's true behavior due to the added instructions and extra data references. Simulation avoids perturbation at the expense of a substantial performance overhead when compared to executing the program on a real system. Furthermore, with either instrumentation or simulation, it is usually difficult to profile an entire large scale software system, i.e., application, operating system, and device driver code.
- Hardware implemented event sampling can also be used to provide profile information of processors. Hardware sampling has a number of advantages over simulation and instrumentation: it does not require modifying software programs to measure their performance. Sampling works on complete systems, with a relatively low overhead. Indeed, recently it has been shown that low-overhead sampling-based profiling can be used to acquire detailed instruction-level information about pipeline stalls and their causes. However, many hardware sampling techniques lack flexibility because they are designed to measure specific events.
- Most extant microprocessors, such as the DIGITAL (RTM) Alpha AXP 21164, the Intel (RTM) Pentium Pro, and the MIPS (RTM) R10000 provide event counters that can count a variety of events, such as data cache (D-cache) misses, instruction cache (I-cache) misses, and branch mispredicts. The event counters generate an interrupt when the counters overflow so that the performance data in the counters can be sampled by higher levels of software.
- Event counters are useful for capturing aggregate information, such as the number of branch mispredicts that the system incurred while executing a particular program, or part thereof. However, known event counters are less useful for attributing state information to individual instructions, such as which branch instructions are frequently mispredicted. This may be due to the fact that the program counters (PC) of instructions that caused the events may no longer be available when the event counter overflows and interrupts.
- It is a particular problem to deduce the dynamic operation of a processor that can issue instructions out-of-order. Indeed, the behavior of software programs executing in an out-of-order processor can be quite subtle and difficult to understand. Consider the flow of instructions in the out-of-order Alpha 21264 processor as a concrete example.
- An out-of-order processor fetches and retires instructions in order, but processes the instructions according to their data dependencies. Processing instructions can involve register mapping, instruction issuing and executing. An instruction is said to be "in-flight" from the time it is fetched until it retires or aborts.
- During each processor cycle, a first stage of the processor pipeline fetches a set of instructions from the instruction cache (I-cache). The set of instructions are decoded. The instruction decoder identifies which instructions in the fetched set are part of the instruction stream.
- Because it may take multiple cycles to resolve the PC of a next instruction to fetch, the PC is usually predicted ahead of time by a branch or jump predictor. When the prediction is incorrect, the processor will abort the mispredicted instructions which occupy a "bad" execution path, and will restart fetching instructions on the "good" path.
- To allow instructions to execute out-of-order, registers specified in operands of instructions are dynamically renamed to prevent write-after-read and write-after-write conflicts. This renaming is accomplished by mapping architectural or "virtual" registers to physical registers. Thus, two instructions that write the same virtual register can safely execute out-of-order because they will write to different physical registers, and consumers of the virtual registers will get the proper values.
- A register mapped instruction resides in the issue queue until its operands have been computed and a functional "execution" unit of the appropriate type is available. The physical registers used by an instruction are read in the cycle that the instruction issues. After instructions have executed, they are marked as ready to retire and will be retired by the processor when all previous ready-to-retire instructions in program order have been retired, i.e., instructions retire in the correct program order. Upon retirement, the processor commits the changes made by the instruction to the architectural "state" of the system, and releases resources consumed by the instruction.
- In some cases, such as when a branch is mispredicted, instructions must be trapped or discarded. When this occurs, the current speculative architectural state is rolled back to a point in the execution where the misprediction occurred, and fetching continues at the correct instruction.
- Numerous events may delay the execution of an instruction. At the front of the pipeline, the fetch unit may stall due to an I-cache miss, or the fetch unit may fetch instructions along a bad path due to a misprediction. The mapper may stall due to lack of free physical registers, or lack of free slots in the issue queue. Instructions in the issue queue may wait for their register dependencies to be satisfied, or for the availability of functional execution units.
- Instructions may stall due to data cache misses. Instructions may trap because they were speculatively issued down a bad path, or because the processor took an interrupt. Many of these events are difficult to predict statically, e.g, by an examination of the code, and all of them degrade the performance of the system. Simple event counters are inadequate to attribute this type of information to individual instructions. In addition, it is difficult to exactly measure the lengths of the delays to determine which delays deserve special attention.
- It is highly desirable to directly attribute events to specific instructions and machine states so that programmers, or optimization tools can improve the performance of software and hardware components of complex computer systems such as super-scalar and out-of-order processors, or for that matter processors of any architectural design.
- The main problem with known event counters is that the instruction that caused the event that overflowed the counter was usually fetched long before the sampled exception PC, i.e., the PC is not of the instruction that caused the overflow. The length of the delay between the fetch and interrupt is generally an unpredictable amount. This unpredictable distribution of events makes it difficult to properly attribute events to specific instructions. Out-of-order and speculative execution amplifies this problem, but it is present even on in-order machines such as the Alpha 21164 processor.
- For example, compare program counter values delivered to the performance counter interrupt handler while monitoring D-cache reference-event counts for the Alpha 21164 (in-order) processor vs. the Pentium Pro (out-of-order) processor. An example program consists of a loop containing a random memory access instruction, for example a load instruction, followed by hundreds of null operation instructions (nop).
- On the in-order Alpha processor, all performance counter events (for example, cache misses) are attributed to the instruction that is executing six cycles after the event to result in a large peak of samples on the seventh instruction after the load access. This skewed distribution of events is not ideal. However, because there exists a single large peak, static analysis can sometimes work backwards from this peak to identify the actual instruction that caused the event, but this is still only nothing more than a best guess, even for a simple program.
- For the identical program executing on the out-of-order Pentium Pro, the event samples are widely distributed over the next 25 instructions, illustrating not only skewing but significant smearing as well. The wide distribution of samples makes it nearly impossible to attribute a specific event to the particular instruction that caused the event. Similar behavior occurs when counting other hardware events.
- In addition to the skewed or smeared distribution of event samples, traditional event counters also suffer from additional problems. There usually are many more events of interest than there are event counters, making it difficult, if not impossible to concurrently monitor all interesting events. The increasing complexity of processors is likely to exacerbate this problem.
- In addition, event counters only record the fact that an event occurred; they do not provide any additional state information about the event. For many kinds of events, additional information, such as the latency to service a cache miss event, would be extremely useful.
- Furthermore, prior art counters generally are unable to attribute events to "blind spots" in the code. A blind spot is any non-interruptible code, such as high-priority system routines and PAL code, because the event will not be recognized until its interrupt is honored. By that time, the processor state may have changed significantly, most likely giving false information.
- On a pipelined, in-order processor, one instruction stalling in a pipeline stage prevents later instructions from passing through that pipeline stage. Therefore it is relatively easy to identify "bottleneck" instructions on an in-order processor, that is bottleneck instructions tend to stall somewhere in the pipeline. For an in-order processor, it is possible to identify stalls by measuring the latency of an instruction as it passes through each pipeline stage, and comparing the measured latency to the ideal latency of that instruction in each pipeline stage. An instruction can be presumed to have stalled in a stage when it takes longer than the minimum latency to pass through that stage.
- However, on an out-of-order processor, other instructions may pass through a pipeline stage around an instruction that is stalled in that pipeline stage. In fact, the additional latency of the stalled instruction may be completely masked by the processing of other instructions, and, in fact, stalled instructions may not delay the observed completion of the program.
- Even on in-order processors, stalls in one pipeline stage may not contribute to the overall execution time of a program when another pipeline stage is the bottleneck. For example, during the execution of a memory-intensive program, the fetcher and mapper of the instruction pipeline may often stall because of "back-pressure" from an execution unit delayed by D-cache misses.
- Ideally, one would like to classify the memory operations causing the cache misses as the primary bottlenecks. The fetcher and mapper stalls are actually symptomatic of the delays due to cache misses, that is, secondary bottlenecks.
- It would be desired to identify those instructions whose stalls are not masked by other instructions, and to identify them as true bottlenecks.
- Furthermore, in order to improve program behavior, there is a need to focus on the causal (primary) bottlenecks rather than the symptomatic (secondary) bottlenecks. This classification of pipeline stage bottlenecks as causal and symptomatic requires detailed knowledge of the state of the pipeline and the data and resource dependencies of the in-flight instructions which cannot be obtained from simple event counters as are known.
- U.S. Patent 5,151,981 "Instruction Sampling Instrumentation," issued to Wescott et al. on September 29, 1992 proposes a hardware mechanism for instruction-based sampling in an out-of-order execution machine. There are a number of drawbacks in the approach taken by Wescott et al. First, their approach can bias the stream of instruction samples, because only instructions that are assigned a certain internal instruction number can be selected for sampling.
- Second, their system only samples retired instructions, and not all instructions fetched, some of which may be aborted. Third, the information collected by the Wescott et al. mechanism focuses on individual event attributes, e.g., cache misses, but does not provide useful information for determining inter-instruction relationships.
- More recently, a hardware mechanism called "informing loads" has been proposed, please see, Horowitz et al, "Informing memory operations: Providing memory performance feedback in modern processors," Proceedings 23rd Annual International Symposium on Computer Architecture, pp. 260-270, May 22, 1996. There, a memory operation can be followed by a conditional branch operation that is taken if and only if the memory operation misses in the cache. Although not specifically designed for profiling, that mechanism could be used to specifically gather just D-cache missed event information.
- In other specialized hardware, called a cache miss look-aside (CML) buffer, virtual memory pages that suffer from a high level-2 cache miss rate are identified, see Bershad et al. "Avoiding conflict misses dynamically in large direct-mapped caches," Proceedings of the Sixth International Conference on Architectural Support for Programming Languages and Operating Systems, pp. 158-170, October 4, 1994, for a full description.
- Some processors, such as the Intel Pentium, permit software to read the contents of the branch predictor's branch target buffer (BTB). By periodically reading the BTB in software, Conte et al. developed a very low overhead technique to estimate edge execution frequencies of a program, see "Using branch handling hardware to support profile-driven optimization," Proceedings of the 27th Annual International Symposium on Microarchitecture, pp. 12-21, November 30, 1994.
- That approach yields information that is similar to that which could be obtained by keeping track of the branch direction information contained in a "profile record" storing related sampling information. More recently, Conte et al. proposed a piece of additional hardware called a profile buffer which counts the number of times a branch is taken and not-taken, see "Accurate and practical profile-driven compilation using the profile buffer," Proceedings of the 29th Annual International Symposium on Microarchitecture, pp. 36-45, December 2,1996.
- The article "Instruction Match Function for Processor Monitoring" in IBM Technical Disclosure Bulletin, vol. 39, no. 12, December 1996, p. 119- 121 discloses an apparatus for sampling instructions which are identified by a dispatcher prior to sampling.
- According to the present invention, there is provided an apparatus for sampling instructions in a processor pipeline of a system, the pipeline having a plurality of processing stages, comprising:
- means for fetching instructions into a first stage of the pipeline, the instructions being identified by additional fields indicating that they have been randomly selected for sampling, the additional fields including a sample bit on each instruction in the pipeline;
- means for identifying any of the fetched instructions as a selected instruction;
- means for sampling state information of the system while a particular selected instruction is in any stage of the pipeline;
- means for storing the state information; and
- means for informing software when the particular selected instruction leaves the pipeline so that the software can read any of the state information wherein the means for sampling and the means for informing software are activated, in use, by asserting the sample bit in the selected instruction.
-
- Periodically, during operation of a processor, an instruction to be profiled is randomly selected, and a profile record of what happens during the execution of the instruction is accumulated in a set of internal profile registers of the processor. After processing of the selected instruction terminates, e.g., the instruction retires, aborts, or traps, an interrupt is generated. Alternatively, software can poll a flag or register. The recorded information characterizing the details of how the instruction was processed in the pipeline can be sampled from the internal profile registers by software.
- The profile registers can record many useful facts about an instruction's execution. Example performance information can include: the number of cycles the selected instruction spent in each stage of an execution pipeline, i.e., stage latencies, whether the instruction suffered I-cache or D-cache misses, the effective addresses of its memory operands, or branch/jump targets, and whether the instruction was retired or aborted.
- On in-order executing processors, it is possible to estimate the total . number of stall cycles attributable to each instruction when one is given the fetch-to-retire latencies of sampled instructions.
- On an out-of-order processor, most stalls are likely to overlap and be masked by other instructions issued out-of-order around the stalled instructions. This makes the identification of stalled instructions difficult. In addition, it may be necessary to collect information about the average level of concurrency while each instruction was executing in order to identify bottlenecks.
- Special-purpose hardware could count and record the number of instructions that issue while a profiled instruction is executing to measure the level of concurrent execution. However, this fails to account for instructions that issue but are aborted, and therefore fail to retire. Provided here is a measurement of the amount of useful concurrency. The useful concurrency being the average number of instructions that issue in parallel and successfully retire with a given instruction. Instructions that issue but subsequently abort are not useful. Then, instructions whose stalls are not masked by useful concurrency can be classified as bottlenecks. To state this another way, a key metric for pinpointing performance bottlenecks on an out-of-order processor is the number of issue slots that are wasted while a given instruction executes.
- Accordingly, in order to measure useful concurrency, a technique called "N-wise sampling" is provided. The basic idea is to implement a nested form of sampling. Here, a window of instructions that may execute concurrently with a first profiled instruction is dynamically defined. For example where N is two, a second instruction is randomly selected for profiling from the window of instructions. The profiled and second instruction form a sample pair for which profile information can be collected.
- Pair-wise sampling facilitates the determination of the number of wasted issue slots attributable to each instruction, and pinpoints bottlenecks much more accurately than known techniques. In general, pair-wise sampling is very flexible, forming the basis for analysis that can determine a wide variety of interesting concurrency and utilization metrics.
- Examples of information that can be captured include: the instruction's address (program counter or PC), whether the instruction suffered an instruction cache miss and the latency incurred to service the miss. If the instruction performs a memory operation, then determine whether the instruction suffered a data-cache miss and measure the latency for satisfying the memory request. Furthermore, the amount of time the instruction spends in each pipeline stage can be measured. The profile information can also indicate whether the instruction retired or aborted, and in the latter case what kind of trap caused execution of the instruction to be aborted.
- The information is collected in a set of profiling registers as the instruction progresses through the execution pipeline. When an instruction finishes executing, either because it retires or because it aborts, an interrupt is delivered to higher level software. The software can then process the information present in the profiling registers in a variety of ways.
- The disclosed technique is an improvement over existing performance-monitoring hardware, and can be efficiently implemented at a relatively low hardware cost in modem microprocessors that can issue instructions out-of-order.
-
- Figure 1 is a block diagram of a computer system with instruction driven state sampling;
- Figure 2a is a block diagram of a microprocessor execution pipeline for processing sampled instructions;
- Figure 2b is a block diagram of the pipeline showing state information which can be sampled;
- Figure 3 is a block diagram of a register file for storing profile information;
- Figure 4 is a block diagram of an augmented instruction;
- Figure 5 is a block diagram for profiling selected instructions;
- Figure 6 is a schematic of a circuit for measuring pipeline latencies;
- Figure 7a is a flow diagram of a process for sampling instructions; and
- Figure 7b is a flow diagram of a process for estimating statistics of properties of instructions processed by the processor pipeline.
-
- Figure 1 shows a
computer system 100 which can use the sampling method and apparatus as described herein. Thesystem 100 includes one ormore processors 110, off-chip memories 1209, and input/output interfaces (I/O) 130 connected bybus lines 140. Theprocessors 110 can be implemented on integrated semi-conductor chips asmultiple execution pipelines 111 including functional execution units, on-chip data-caches (D-cache) 113 and instruction caches (I-cache) 112, for example, the Digital Equipment Corporation Alpha 21264 processor. Theprocessor chip 110 also includeshardware 119 described in greater detail below for sampling processor states for selected instructions. - The off-
chip memories 120 can be arranged hierarchically, including general purpose caches (B-cache or SRAM) 121, volatile memories (DRAM) 122, and persistent memories (disk) 123. The I/O 130 can be used to input and output data to and from thesystem 100. - During operation of the
system 100, instructions and data of software programs are stored in thememories 120. The instructions and data are generated conventionally using known compiler, linker, and loader techniques. The instructions and data are transferred to theexecution pipeline 111 of one of theprocessors 110 via the caches 112-113. In the pipeline, the instructions are decoded for execution. Some of the instructions operate on the data. Other instructions control the execution flow of the programs. - It is desired to collect detailed performance data while the instructions execute. Performance data can be related to memory operations and execution flows.
- Figure 2a shows an
execution pipeline 200 of one of theprocessors 110 of Figure 1 having a plurality of stages serially arranged as, for example, fetch, map, issue, execute, and retire units, respectively 210, 220, 230, 240, and 250. The rate at which thepipeline 200 processes information (data and instructions) is controlled by system clock signals onlines 201, i.e., so called clock "cycles." - Each clock cycle defines a "slot" or interval of time when a stage of the
pipeline 200 can do a discrete amount of processing. A processing slot usually carries forward instructions, and in the case of execution units, described below, data, generally "data items" hereinafter. In some cases, for example, on branch mispredicts or cache misses, or pipeline stalls, the clock continues to cycle, but no meaningful instructions are carried forward. - As an advantage, the present apparatus and method can sample state information about processor slots that carry "garbage" or no useful data. These are known as "wasted" slots. Identifying and sampling wasted slots can be an important precursor to optimizing tasks, since wasted slots do no useful work, and therefore degrade system performance. Therefore, in general, what is being sampled here are not simply "events" or "instructions" as in the prior art, but state information related to pushing processor slots through the
pipeline 200, whether they are associated with valid or invalid instructions. - The B-
cache 121 transfers data items to the I-cache 112 and D-cache 113, respectively. The fetchunit 210, using some type of a translation look-aside buffer (TLB) 205 to resolve virtual addresses to physical addresses, fetches next instructions to be executed from the I-cache 112. The items fetched from the I-cache 112 are generally executable instructions. However, these can also be invalid instructions, as in the case of I-cache misses "garbage" data, i.e., not an instruction. - Preferably, a set of "instructions" are fetched during a single processor cycle. The set can include, for example, four instructions. In other words, the
pipeline 200 is four slots wide. Other types of processors may fetch fewer or more instructions during a single processor cycle. In general, this means that each cycle fills four processing slots from the cache. Some of the slots may be wasted when the I-cache 112 does not have the available data. Instead of pausing, holding up all processing, the slots are carried forward in any case to make them available for the purpose of sampling, although a garbage "instruction" in a slot may never issue for execution. - During fetching, selected instructions can be augmented with additional information to allow sampling or system profiling. An augmented instruction is described below with reference to Figure 4. It should be noted that in other implementations, the augmentation of the selected instructions can take place in any of the stages of the processor, including the
issue unit 230. - In the
system 100, the operands of instructions are dynamically assigned or "mapped" to physical registers using themap unit 220 in the next stage of thepipeline 200. The map unit assigns physical registers to architectural or "virtual" registers. In other words, there may not be a one-to-one correspondence between virtual and physical registers. - In the next stage, fetched instructions are ordered by an
issue unit 230. Theissue unit 230 includes an issue queue having a head-of-the-queue entry 231 for the next instruction to be executed. It should be noted, that one or more instructions in theissue unit 230 may be stalled because resources or data needed by the instructions are not available. Therefore, other pending instructions may be issued out-of-order from thequeue 230 "around" the stalled instructions. The correct execution order will be affirmed in the retireunit 250 described below. - The instructions are issued to functional execution units (E0 ,..., E3) 241, and a load/store (Id/st)
unit 242. Each of theexecution units 241 may be designed to handle instructions with specific types of operator codes (opcodes), for example, integer and floating point arithmetic, branching and jump instructions, etc. While being processed by the execution units intermediate values may be produced. The Id/st unit 240 executes memory access instructions, for example, loads and stores data from and to the D-cache 113. The Id/st unit 242 is especially identified because it may experience long delays. Also note, memory access instructions with long latencies may "complete" long before the data are brought into the processor to improve throughput. - The termination of execution of an instruction is handled by the retire
unit 250. The retireunit 250 commits the processing state. It should be noted, that some instructions may abort or be trapped. For example, the execution flow may change after an instruction is fetched, or an instruction may suffer an exception trap. In these cases, the instruction and all subsequent instructions already in the pipeline are discarded and the speculative processing state is rolled back. As an advantage here, discarded or "aborted" instructions are also profiled, as are wasted processor slots. In other words, termination can mean retiring a completely executed valid instruction, post-processing a partially executed valid instruction, or discarding an invalid instruction or wasted slot. - The basic idea which underlies the present technique follows the processing of "data items" in selected "slots," primarily instructions, as they progress through the stages of the
pipeline 200. Profiling hardware dynamically gathers detailed state information. The state information can come from any of the pipeline stages, or elsewhere in thesystem 100, for example, first and second level caches, or other sub-systems. The state information can be directly attributed to specific events. - Here, the design strategy is to collect information that is difficult to determine statically in a profile record. This makes the profile record useful for performance tools, profile-directed optimization, or for making resource allocation policy decisions in operating system and application level software, including dynamic adjustments directly in response to the sampling and analysis. Recall, the present method and apparatus is designed to operate on real functional systems.
- To determine what state information is interesting to save as part of the profile record, it is useful to examine the information that theoretically is available to the various stages of the
pipeline 200 of a modern out-of-order microprocessor as shown in Figure 2b. - As shown in Figure 2b, the stages of the pipeline are fetch 210,
map 220,issue 230, execute 240, and retire 250. During any of the stages, depending on a particular implementation, any "in-flight"instruction 202 processed by thepipeline 200 can be selected for sampling byline 512. The selection is controlled by a value of acounter 510. The value of the counter can be initialized by line (init) 511. - State information, such as instruction addresses (PC) 281, branch history bits (HIST) 282,
stage latencies 283, branch taken indication (T) 287 data address (ADDR) 284, data miss (MISS) 285, andretired status 286 can be sampled onlines 288. Termination of the processing of the selected instructions can generate an interrupt signal online 289. The interruptsignal 289 can cause software to sample the state information 281-286 via lines 299. Alternatively, software may pollline 289 via aninternal processor register 541. - An out-of-order execution processor fetches and retires instructions in order, but executes them according to their data dependencies. An instruction is said to be "in-flight" from the time it is fetched until it terminates, e.g., retires or aborts. Instructions, after mapping, are placed in the
issue unit 230, and wait there until registers holding input operands are updated. - Each processor cycle, the fetch
unit 210 fetches and decodes a set of instructions from theinstruction cache 112. The instruction decoder, which may be part of the fetchunit 210, identifies which instructions in the fetched set are part of the instruction stream. Because it takes multiple cycles to resolve the program counter (PC) of a next instruction to fetch, the next PC is predicted by a branch or jump predictor, which may be part of fetchunit 210. If the prediction is incorrect, then the processor will abort the mispredicted instructions, i.e., the instruction fetched on a "bad" path, and will restart fetching instructions on the "good" path. - To allow instructions to execute out-of-order, registers are dynamically renamed by the
map unit 220 to prevent write-after-read and write-after-write conflicts. Two instructions that write the same virtual register can safely execute out-of-order because they will write different physical registers, and consumers of the virtual registers will get the proper values. Instructions are fetched, mapped, and retired in order, although they may execute out-of-order. - The
register map unit 220 assigns operands of fetched instructions to valid physical registers. That is, the virtual names of the register operands are renamed to the physical register space of the processor. Instructions then proceed to theinstruction queue 230 where they wait for two events before executing. First, their register dependencies must be resolved. Second, the resources the instruction needs, e.g., execution units, registers, cache ports, memory queues, etc., must be available. This means that required resources cannot be reallocated for any currently mapped instructions. - When these two conditions are met for an instruction, the instruction's operands are looked up in the physical register file. The content of the operand registers and some information about the instruction are then sent to the
appropriate execution unit 240 and executed. When the instruction is finished executing, and the instruction is the oldest "non-retired" instruction in the processor, the instruction retires. This frees the resources used by the instruction, such as physical registers and cache ports. - Numerous events may delay the execution of an instruction. In the front of the pipeline, the fetch
unit 210 may stall due to an I-cache 112 miss, or the fetchunit 210 may fetch instructions of a mispredicted path. Themap unit 220 may stall due to lack of free physical registers, or lack of free slots in theissue unit 230. - Instructions in the
issue unit 230 may wait for their register dependencies to be satisfied, or for the availability ofexecution units 240. Instructions may stall due to misses in the D-cache. Instructions may trap because they were speculatively issued down a bad path, or because the processor took an interrupt, such as an illegal operation or memory address. Many of these conditions are difficult to predict at compile-time, and all of them degrade the performance of thesystem 100. This makes it valuable to sample the information available onlines 288. - Therefore, as shown in Figure 3, there is provided a
memory 300 for storing profile information for each instruction being sampled. Thememory 300 can be in the form of a register file or buffer. In other words, a selected instruction that will be sampled is directly identified with theregister file 300. Theregister file 300 can include a plurality of registers. Alternatively, thefile 300 can be implemented as a single indexable register with multiple fields. - The
file 300 is coupled to the components of thepipeline 200 bylines 288 of Figure 2b so that performance information related to the selected instruction can be captured for each stage of thepipeline 200. It should be noted that the profile registers 300 are more than simple "event" counters as found in the prior art, here the registers collect performance information that is attributable to specific known instructions and events. - In Figure 3, the number of bits allocated for each register depends on the type of information stored therein, for example, instruction addresses (64 bits), latencies, i.e., cycle counts (8 or 10 bits), discrete events (1 bit per event) and so forth. These numbers are merely a guideline. Other implementations may use different numbers of bits for the
various registers 300, this is a design choice. - In the preferred embodiment, a
profile PC register 310 stores the PC of the selected instruction. As described below, an instruction that is being profiled has a "profile" bit asserted. ThePC register 310 can also include the opcode of the selected instruction. In addition, for processors which permit multi-threaded execution additional bits of theregister 310 can store the identifier of the thread. Other fields of theregister 310 can store the process identifier, the address space number, the CPU number, and the instruction number (inum) of the instruction being executed. In addition, on processors having multiple logical register sets, i.e., hardware contexts, and simultaneously executing threads, register 310 can store hardware context and thread identifiers. By storing this information, the profile information can be directly attributed to a specific instruction. In addition, the sampled information can be filtered according to range of addresses, opcode, execution threads, address spaces, and the like. - A profile
effective address register 320 is loaded with an address associated with the selected instruction. If the instruction is a memory access instruction, then the physical address resulting from the translation of the virtual memory address can be captured inregister 320. If the instruction is a jump or a branch then the physical address resulting from the translation of the virtual target PC can be captured inregister 320. - As an advantage of the present sampling technique, it is possible to sample over all "instructions" processed by the
pipeline 200, independent of the sampling rate. The instructions can be valid instructions, invalid instructions, non-interruptible instructions, or "garbage" instructions. Thus, the captured effective addresses are statistically representative of the overall behavior of the program. By capturing the effective addresses of sampled instructions, memory accesses and execution flows can precisely be correlated to actual dynamic executions. - A profiled
event register 330 is partitioned into, for example, one bit fields. The 1-bit fields record events for the selected instruction. When an instruction is first selected, the register is cleared. Events could include cache misses, branch mispredicts, resource conflicts, traps and exception conditions, retire/abort/invalid, TLB misses, taken/non-taken, data dependency stall, resource dependency stalls, and so forth. Note, this implementation allows multiple events to be attributed to a single instruction. It should be noted that event information is collected for both retired and aborted instructions. In order to reduce the size of theevent register 330, some of the bit fields can be used to record different types of mutually exclusive events depending on the opcode of the instruction. - A profiled path register 340 is used to capture recent branch taken/not-taken information from a branch history table. Branch history tables are well known in the art for other uses. Global branch taken history can be used to indicate the execution path which caused the selected instruction to be fetched. Note that the instruction does not have to be a branch instruction for this information to be useful. The use of the path information is described in greater detail below.
- Latency registers 350 store timing information taken at check points while a selected instruction is in flight, e.g. between the various stages of the
pipeline 200. The checkpoints may differ from processor to processor depending on where an instruction might be stalled waiting for some event or resource. Each latency register 350 counts the number of cycles an instruction spent between two checkpoints. - When the selected instruction passes a checkpoint, i.e., entering a next stage in the
pipeline 200, the correspondinglatency register 350 is first cleared and then incremented once per cycle until the instruction passes the next checkpoint when the next latency register is initialized and begins counting. The number of latency registers 350 depends on the number of stages of thepipeline 200 in a particular implementation. A complete latency profile is stored in the latency registers 350 when the instruction aborts or retires. - A list of potentially useful latencies to collect includes: fetch-to-map, map-to-data ready, data ready-to-execute, execute-to-retire ready, retire ready-to-retire delays. For memory instructions (loads and stores) latencies can be issue-to-completion. This last latency differs from other latencies in that some memory operations may retire before the data they operate on have actually been brought into the processor. These latencies could be directly counted in the
registers 350, or the registers can collect raw cycle counts, in which case, profiling software computes differences between raw counts for successive stages to determine actual latencies. A circuit which counts example pipeline latency clock cycles is described below with reference to Figure 6. - The updating of the information in the register(s) 300 does not have to happen immediately, a delay is acceptable. All that is required is that the interrupt signaling the fact that the selected instruction has completed (retired or aborted) is delayed until all information in the
register file 300 have been updated, or the interrupt handler can stall until theprofile file 300 has been updated. - It should be noted that the
profile register file 300 can be replicated. If there are multiple copies of the profile register file, then multiple instructions can be selected for profiling, either serially, or concurrently. In this case, each selected instruction is explicitly identified with a specific register file as described below. Multiple register files can be sampled in response to a single interrupt signal to reduce the amount of overhead. - As shown in Figure 4, each
instruction 400 includes a sample field. For example, the sample field can be a one bit tag called the "sample" bit (S) 401. When thesample bit 401 is asserted the instruction is selected for sampling. Asserting thebit 401 actives the sampling hardware which collects the profile information, and also causes the interrupt when the selected instruction completes (retired or aborted). Alternatively, each "instruction" fetched can be consecutively numbered with an "inum" value. In this case, instructions with specific inum values can be selected. The mechanism for selecting instructions is described below. - The
profile register file 300 can be read when the fields have been updated and the interrupt signal is generated. The interrupt signal can cause privileged profiling software (PSW) to process the contents of the profile registers 300. It should be noted that in the case where multiple samples are recorded, a single interrupt can cause the sampling of performance data for multiple selected instructions. - Depending on the implementation, the
augmented instruction 400 can include the following additional fields, up to three instruction operands (op1, op2, and op3) 411-413, the program counter (PC) 420, the operator code (opcode) 430. A valid field (V) 431 can indicate whether the "instruction" in the selected slot is valid or not by setting a one bit field to either true or false.Fields - In a slightly more complicated design, multiple instructions may concurrently be profiled. In this implementation, there are a plurality of
register files 300 or single larger registers with sub-fields, the number offiles 300 corresponding to the number of in-flight instructions which can concurrently be profiled. To handle this case, theinstruction 400 is also augmented to include a sample register file identifier (ID)field 402. This allows profile information to be directly linked to one of the several register files 300. As noted above, here there is a direct association between selected instructions and profile registers. The profile information collected in the registers is therefore directly attributable to a specific instruction. - Even when only one in-flight instruction is profiled at a time, it may be useful to have the file or register 300 be indexed by the
ID field 402 so that the cost of the profiling software's interrupt handler may be amortized over several instruction samples. To determine whether an instruction within a set of instructions is a selected instruction can be performed by using a "wired-OR" operation. - The overhead of the present profiling is reduced by restricting the number of instructions that can concurrently be profiled, e.g.,
bit 401 is set. Instead of profiling every instruction in a program or a part of the program, here instructions to be profiled are selected during a specific stage of theprocessor pipeline 200, e.g., during fetching, and the selected instructions are tagged by asserting thesample bit 401. If thesample bit 401 is asserted, then the components of thepipeline 200 forward profile information to the profile register file(s) 300. - The following sections describes the supporting details of instruction level profiling as described herein.
- First, each decoded instruction state that passes through the
processor pipeline 200 is augmented with additional information as described above. An instruction is considered to be in flight from the time it is fetched until it retires or aborts. As stated above, the instruction is augmented with at least onesample bit 401. Thesample bit 401 is part of the state of every in-flight instruction and cache/memory request. When thebit 401 is asserted, the bit indicates that profiling information is recorded for this instruction, otherwise not. - In a simplified design, only one in-flight instruction at any one time is allowed to have its
sample bit 401 asserted. Thesample bit 401 remains asserted for the selected instruction until the instruction retires or is aborted. In a more complex design withmultiple register files 300, multiple in-flight instructions can individually be profiled, and additional bits can be asserted. - As shown in Figure 5 for a fetch stage implementation, selection of instructions to be profiled, and sampling of profile information proceeds as follows. A fetch
counter 510 is initialized by, for example, privileged profiling software (PSW) 520 vialine 511. ThePSW 520 can initialize thecounter 510 with a value randomly selected from an interval of values having a predetermined size. Thus, the sampled instructions will not correlate with any specific patterns in the execution of instructions. The size of the interval determines the average frequency of sampling. The size of the interval can be varied. Other randomizing techniques to initialize the value ofcounter 510, including hardware, may also be used. - Without random sampling, for instance when instructions are sampled at a fixed frequency as in the prior art, it may not be possible to generate a statistically correct profile of all instructions fetched, e.g., the aggregate operation of the
system 100. This is particularly true for an execution thread having execution loops that include a number of instructions that is not relatively prime with respect to the rate of sampling, e.g., for a loop with two instructions and a sampling interval of 65536 instructions. As an advantage, randomly selected instructions will produce correlations independent of the length of the sampling interval. - For each
instruction 400 fetched, thecounter 510 is incremented or alternatively, in a different implementation, decremented from its initial value by the fetchunit 210 of thepipeline 200. When thecounter 510, depending on the implementation, either over flows or under flows, the current fetched instruction has itssample bit 401 asserted, and theID field 402 can also be initialized when multiple instructions are selected for sampling. - In an alternative embodiment, the
counter 510 is incremented every cycle, instead of for each instruction fetched, e.g., thecounter 510 counts fetch opportunities and not actual instructions fetched. For example, if the fetchunit 210 can fetch four items from the I-cache 112 during each clock cycle, then there are four fetch opportunities. It may well be that one or more fetches from the I-cache will miss, or fetch a "bad" instruction. In the case of a miss, the slot available for the missed instruction will contain "garbage," and the instruction will need to be marked as invalid. A bad instruction is one that lies on a bad execution path, or will otherwise abort. - Counting cycles instead of fetched instructions advantageously simplifies the design. Just counting valid fetched instructions can be quite complicated because control flow can branch into, or out of the group of fetched instructions, and it becomes necessary to decode all instructions to determine which are valid, no longer is it a simple matter of just incrementing the counter by four.
- As an advantage, anything (good instructions, bad instructions, garbage instructions) that are fetched from the I-cache during a cycle can be selected for sampling so that the true performance of the I-
cache 112 andpipeline 200 can be determined. Here, there is no bias, so the results will be a statistically correct estimate of the performance of the system. - The sampled instruction information can be filtered by a
filter 505. Filtering can be on the basis of instruction opcode, operands, or more complex filtering criteria such a first type of instruction followed by another type of instruction within some period of time. If there is filtering on the input to thepipeline 200, then thecounter 510 can be reset. There a number of ways to do this. In one way, the current initial value of thecounter 510 is stored in aninit register 513. When an instruction is filtered, thecounter 510 is reloaded with the value stored in theinit register 513 to recall the initial randomized selection. - After the instruction has been augmented, the
pipeline 200 provides the profiling information 281-286 of Figure 2b to the register file(s) 300. The retireunit 250, in response to the instruction completing or aborting, completes the filing of profile information, and generates an interrupt signal online 540 so that thePSW 520 can sample the profile information. - Alternatively,
PSW 520 may pollline 540 via an internal processor register or memory location (541). As one feature of the present technique, in contrast to some prior art profiling techniques, there is no impact on the processor cycle time even though the present technique delivers precise information about states across the processor. The only time constraint is that all profile information must be recorded before the profile registers 300 are sampled. - Figure 6 shows a
circuit 600 for counting exemplary latencies: fetch-to-map (F M), map-to-issue (M I), issue-to-retire (I R), fetch-to-trap (F T), and issue-to-ldst (I LS). Thecircuit 600 includes acycle counter 610 coupled byline 611 to latches 620. - The
cycle counter 610 and latches 620 are initialized by signal Pfetch online 601. This signal is generated when an instruction to be profiled is fetched, for example, a signal derived from thesample bit 401. Thecounter 610 is incremented by clock signals online 609. Each clock signal corresponds to one processor cycle. - As the
instruction 400 progresses through the stages of thepipeline 200, stage transitions in thepipeline 200 trigger signals Pmap, Pissue, Pretire, Ptrap, and PLSdone respectively on lines 602-606. The corresponding latches 620 can be read on lines 612-616 for storing in the profile latency registers (or fields) 350 of Figure 3. - The profiling hardware described above can be utilized in a variety of different ways. Because the present technique provides very detailed information about the execution of individual instructions, one application could profile a large number of instructions. The sample information can be stored in a memory buffer for later processing by profiling tools to produce detailed instruction-level information.
- The information can be used to develop, for example, histograms of load latencies for each load instruction, histograms of instruction execution times, and perhaps even a moderately comprehensive analysis of the pipeline state for each instruction. Because the amount of information provided by this approach is likely to be quite high, the overall memory overhead of the present technique is also likely to be quite high because a substantial amount of memory traffic is involved. For example, if a billion instructions are fetched per second, and sampling is performed every 10,000 fetched instructions, then the data rate for the profile information will be approximately 2.4 MB per second.
- The following section describes software-implemented methods for reducing bandwidth by aggregating profile information.
- The volume of sampled data can be reduced by ignoring some fields of the profile record, e.g., the data in the profile registers 300, except when they are explicitly requested. A user of the
system 100 may desire different levels of profiling. In a lowest overhead mode, the profiling application software can generate a profile report for all or part of a program, using just the PC and retire-delay fields. Depending on the optimization to be performed, other per-PC values may be summarized by averaging or other statistical metrics, such as minimum, maximum, or computing standard deviation. Given more time to process data, the profiling application may produce histograms of various instruction latencies. - The effective memory address, branch target address, and branch history samples will likely require more expensive processing than the other fields. These fields can probably be ignored except when gathering data to perform specific optimization tasks. Given the inter-instruction fetch distance between instructions in cycles, the profiling application can also gather information about levels of concurrency.
- Filtering of the profiling information can also be done by hardware means, for example, a mask register, or programmable logic. For example, only sample when there was a cache miss, or when the instruction retired, or other Boolean combinations of opcodes, operands, addresses, events and latencies.
- The present profiling technique can be used to get a precise understanding of the internal operation of an out-of-order issue processor, such as the Alpha 21264 processor. One of the first things to notice about this type of machine organization is that there are many places where an instruction might stall in the
pipeline 200, and a large number of reasons why it might stall. - For example, an instruction might stall in the
issue unit 230, either because some of its operands are not data ready, because some of the resources required for the execution of the selected instruction are unavailable, or because other instructions were chosen to execute ahead of it. - An instruction might stall in the map stage, which makes virtual to physical register mappings, either because the machine is out of physical registers, or because there are too many instructions in flight, or because the
issue unit 230 is full; meaning there is no place to put the about-to-be executed instruction. Alternatively, an instruction might stall in the retire unit, because previously issued instructions, in program order, have not yet completed. - Determining exactly where an instruction stalled, why it stalled, and how long it stalled depends heavily on the precise state of the machine when that instruction is executed. Because the processor is so dynamic, it is difficult for software performance tools to determine this state statically.
- As shown in Figure 7a, a method 700 for profiling can include the following steps. The profiling state is initialized in
step 710. Here, registers are cleared and counters are assigned their initial values. Instep 720, an instruction is fetched and counted. Instep 730, the instruction is selected when the number of fetched instructions since initialization is equal to a predetermined random number. The selected instruction is augmented to indicate its selection. - As the selected instruction progresses through the
execution pipeline 200, profile information is collected instep 740. Upon completion (retired or aborted), the collected information is sampled instep 750. Sampled information can be buffered for subsequent processing. It is also possible to sample a particular profiling state to extract more detailed information. - As shown in Figure 7b, a
process 799 estimates statistics of properties of instructions processed by thepipeline 200. Theprocess 799 can include the following steps. Step 751 reads theprofile record 300 sampled as described above instep 750. The record is read when the selected instruction completes. Instep 760, the sample is selected or discarded depending on afunction 755 which takes into consideration state information of the system. - For example, function 755 takes as
input state information 756 such as addresses, process identifiers, address space numbers, hardware context identifiers, or thread identifiers of the selected instructions.Function 755 may also use state information such as path-identifying information, opcodes, operands, latencies, or events experienced by the selected instructions. The event information can be retire/abort/invalid status, cache hit/miss, branch mispredict, trap status, TLB hit/miss, and data resource dependency status, and so forth. - Step 760 produces a subset of samples based on the
function 755. Instep 780,statistics 790 are determined. These statistics can include averages, standard deviations, histograms (distribution), and error bounds of the properties of the sampled instructions. For example, average rates at which specified events occur, average latencies of instruction execution and memory accesses. Averages of execution rates of processes, threads, or hardware contexts can also be determined. The histograms can show the distribution of instruction execution, memory access rates, or latencies.
The bound on the errors can be approximated by a reciprocal of a square root of the number of samples for the particular property being sampled.
Claims (26)
- An apparatus (100) for sampling instructions in a processor pipeline (200) of a system, the pipeline having a plurality of processing stages, comprising:means (210) for fetching instructions into a first stage of the pipeline, the instructions being randomly identified by additional fields indicating that they have been selected for sampling, the additional fields including a sample bit (401) on each instruction in the pipeline;means for identifying any of the fetched instructions as a selected instruction;means for sampling state information of the system while a particular selected instruction is in any stage of the pipeline (200);means (300) for storing the state information; andmeans for informing software when the particular selected instruction leaves the pipeline (200) so that the software can read any of the state information, wherein the means for sampling and the means for informing software are activated, in use, by asserting the sample bit (401 ) in the selected instruction.
- An apparatus (100) according to claim 1, wherein the selected instructions include valid instructions which are completely processed by the pipeline (200), valid instructions which are aborted before leaving the pipeline, and invalid instructions which are partially processed before leaving the pipeline.
- An apparatus (100) according to claim 1, wherein the selected instructions can include non-interruptible instructions.
- An apparatus (100) according to any of claims 1 to 3, wherein the plurality of stages include fetch (210), map (220), issue (230), execution (240), and retire (250) stages.
- An apparatus (100) according to any of the preceding claims, wherein the additional fields store instruction numbers and further including comparator registers (300) storing the additional fields.
- An apparatus (100) according to any of the preceding claims, further includinga sampling counter (510);means (520) for initializing the sampling counter (510) to a specified value;means for activating the identifying means when the sample counter (510) overflows in response to specified events.
- An apparatus (100) according to claim 6, wherein the specified events are valid fetched instructions.
- An apparatus (100) according to claim 6, wherein a rate of fetching is determined by a clock, and the specified events are subdivisions of clock cycles corresponding to a single potentially fetched instruction.
- An apparatus (100) according to claim 6, wherein the specified events are the entrance of instructions into any stage of the pipeline (200).
- An apparatus (100) according to claim 6, wherein the specified value is chosen randomly from an interval of numbers to specify the average frequency of sampling.
- An apparatus (100) according to claim 10, wherein the size of the interval of numbers is varied to dynamically change the average frequency of sampling.
- An apparatus (100) according to claim 10, wherein the random number is determined by the software.
- An apparatus (100) according to claim 10, wherein the random number is generated by hardware.
- An apparatus (100) according to any one of the preceding claims, wherein the state information includes information identifying the selected instruction.
- An apparatus (100) according to claim 14, wherein the identifying information includes the addresses of the selected instructions.
- An apparatus (100) according to claim 14, wherein the identifying information includes identifications of processes executing the selected instruction.
- An apparatus (100) according to claim 14, wherein the identifying information includes address space numbers.
- An apparatus (100) according to claim 14, wherein the identifying information includes a hardware context identifier.
- An apparatus (100) according to any one of the preceding claims, wherein the means for informing software generates an interrupt when the particular selected instruction leaves the pipeline.
- An apparatus (100) according to any one of claims 1 to 18, wherein the means for informing software sets a flag that can be polled by the software to determine that the particular selected instruction has left the pipeline.
- An apparatus (100) according to any one of the preceding claims, wherein a subset of the selected instructions are sampled.
- An apparatus (100) according to any one of the preceding claims, wherein the state information includes a thread identifier.
- An apparatus (100) according to any one of claims 1 to 20, wherein the state information includes a retired/abort status of the selected instructions.
- An apparatus (100) according to any one of claims 1 to 20, wherein the state information includes events detected while processing the selected instructions.
- An apparatus (100) according to any one of claims 1 to 20, wherein the state information includes latencies experienced by the selected instructions.
- A computer system (100) including apparatus according to any one of claims 1 to 25.
Applications Claiming Priority (2)
| Application Number | Priority Date | Filing Date | Title |
|---|---|---|---|
| US08/980,190 US6000044A (en) | 1997-11-26 | 1997-11-26 | Apparatus for randomly sampling instructions in a processor pipeline |
| US980190 | 1997-11-26 |
Publications (3)
| Publication Number | Publication Date |
|---|---|
| EP0919918A2 EP0919918A2 (en) | 1999-06-02 |
| EP0919918A3 EP0919918A3 (en) | 2000-02-23 |
| EP0919918B1 true EP0919918B1 (en) | 2003-11-19 |
Family
ID=25527399
Family Applications (1)
| Application Number | Title | Priority Date | Filing Date |
|---|---|---|---|
| EP98309631A Expired - Lifetime EP0919918B1 (en) | 1997-11-26 | 1998-11-25 | Apparatus for randomly sampling instructions in a processor pipeline |
Country Status (4)
| Country | Link |
|---|---|
| US (1) | US6000044A (en) |
| EP (1) | EP0919918B1 (en) |
| JP (1) | JP4467093B2 (en) |
| DE (1) | DE69819849T2 (en) |
Families Citing this family (108)
| Publication number | Priority date | Publication date | Assignee | Title |
|---|---|---|---|---|
| US8352400B2 (en) | 1991-12-23 | 2013-01-08 | Hoffberg Steven M | Adaptive pattern recognition based controller apparatus and method and human-factored interface therefore |
| US5362442A (en) | 1993-07-22 | 1994-11-08 | 2920913 Canada Inc. | Method for sterilizing products with gamma radiation |
| US6237073B1 (en) | 1997-11-26 | 2001-05-22 | Compaq Computer Corporation | Method for providing virtual memory to physical memory page mapping in a computer operating system that randomly samples state information |
| US6332178B1 (en) | 1997-11-26 | 2001-12-18 | Compaq Computer Corporation | Method for estimating statistics of properties of memory system transactions |
| US6549930B1 (en) | 1997-11-26 | 2003-04-15 | Compaq Computer Corporation | Method for scheduling threads in a multithreaded processor |
| US6374367B1 (en) | 1997-11-26 | 2002-04-16 | Compaq Computer Corporation | Apparatus and method for monitoring a computer system to guide optimization |
| US6195748B1 (en) | 1997-11-26 | 2001-02-27 | Compaq Computer Corporation | Apparatus for sampling instruction execution information in a processor pipeline |
| US6175814B1 (en) * | 1997-11-26 | 2001-01-16 | Compaq Computer Corporation | Apparatus for determining the instantaneous average number of instructions processed |
| US6237059B1 (en) | 1997-11-26 | 2001-05-22 | Compaq Computer Corporation | Method for estimating statistics of properties of memory system interactions among contexts in a computer system |
| US6442585B1 (en) | 1997-11-26 | 2002-08-27 | Compaq Computer Corporation | Method for scheduling contexts based on statistics of memory system interactions in a computer system |
| US6163840A (en) * | 1997-11-26 | 2000-12-19 | Compaq Computer Corporation | Method and apparatus for sampling multiple potentially concurrent instructions in a processor pipeline |
| KR19990049284A (en) * | 1997-12-12 | 1999-07-05 | 구본준 | Data program unit |
| US6233531B1 (en) * | 1997-12-19 | 2001-05-15 | Advanced Micro Devices, Inc. | Apparatus and method for monitoring the performance of a microprocessor |
| US6353805B1 (en) | 1997-12-31 | 2002-03-05 | Intel Corporation | Apparatus and method for cycle accounting in microprocessors |
| US6052802A (en) * | 1997-12-31 | 2000-04-18 | Intel Corporation | Apparatus and method for cycle accounting in microprocessors |
| US6314493B1 (en) * | 1998-02-03 | 2001-11-06 | International Business Machines Corporation | Branch history cache |
| US6347362B1 (en) * | 1998-12-29 | 2002-02-12 | Intel Corporation | Flexible event monitoring counters in multi-node processor systems and process of operating the same |
| US6360337B1 (en) | 1999-01-27 | 2002-03-19 | Sun Microsystems, Inc. | System and method to perform histogrammic counting for performance evaluation |
| US7966078B2 (en) | 1999-02-01 | 2011-06-21 | Steven Hoffberg | Network media appliance system and method |
| US6415378B1 (en) * | 1999-06-30 | 2002-07-02 | International Business Machines Corporation | Method and system for tracking the progress of an instruction in an out-of-order processor |
| US6437783B1 (en) * | 1999-09-13 | 2002-08-20 | Intel Corporation | Method and system for simultaneously displaying the throughput on multiple busses |
| US6961930B1 (en) | 1999-09-22 | 2005-11-01 | Hewlett-Packard Development Company, L.P. | Efficient, transparent and flexible latency sampling |
| US6754848B1 (en) * | 1999-09-30 | 2004-06-22 | International Business Machines Corporation | Method, system and program products for operationally migrating a cluster through emulation |
| US6748589B1 (en) | 1999-10-20 | 2004-06-08 | Transmeta Corporation | Method for increasing the speed of speculative execution |
| US6725363B1 (en) * | 2000-07-31 | 2004-04-20 | Sun Microsystems, Inc. | Method for filtering instructions to get more precise event counts |
| US6751721B1 (en) * | 2000-08-31 | 2004-06-15 | Hewlett-Packard Development Company, L.P. | Broadcast invalidate scheme |
| US6678840B1 (en) * | 2000-08-31 | 2004-01-13 | Hewlett-Packard Development Company, Lp. | Fault containment and error recovery in a scalable multiprocessor |
| US6546465B1 (en) | 2000-08-31 | 2003-04-08 | Hewlett-Packard Development Company, L.P. | Chaining directory reads and writes to reduce DRAM bandwidth in a directory based CC-NUMA protocol |
| US6738836B1 (en) | 2000-08-31 | 2004-05-18 | Hewlett-Packard Development Company, L.P. | Scalable efficient I/O port protocol |
| US6546453B1 (en) | 2000-08-31 | 2003-04-08 | Compaq Information Technologies Group, L.P. | Proprammable DRAM address mapping mechanism |
| US6636955B1 (en) | 2000-08-31 | 2003-10-21 | Hewlett-Packard Development Company, L.P. | Mechanism for synchronizing multiple skewed source-synchronous data channels with automatic initialization feature |
| US6622225B1 (en) | 2000-08-31 | 2003-09-16 | Hewlett-Packard Development Company, L.P. | System for minimizing memory bank conflicts in a computer system |
| US6671822B1 (en) | 2000-08-31 | 2003-12-30 | Hewlett-Packard Development Company, L.P. | Method and system for absorbing defects in high performance microprocessor with a large n-way set associative cache |
| US6654858B1 (en) | 2000-08-31 | 2003-11-25 | Hewlett-Packard Development Company, L.P. | Method for reducing directory writes and latency in a high performance, directory-based, coherency protocol |
| US7099913B1 (en) | 2000-08-31 | 2006-08-29 | Hewlett-Packard Development Company, L.P. | Speculative directory writes in a directory based cache coherent nonuniform memory access protocol |
| US6662319B1 (en) | 2000-08-31 | 2003-12-09 | Hewlett-Packard Development Company, L.P. | Special encoding of known bad data |
| US6961781B1 (en) | 2000-08-31 | 2005-11-01 | Hewlett-Packard Development Company, L.P. | Priority rules for reducing network message routing latency |
| US6779142B1 (en) | 2000-08-31 | 2004-08-17 | Hewlett-Packard Development Company, L.P. | Apparatus and method for interfacing a high speed scan-path with slow-speed test equipment |
| US6567900B1 (en) | 2000-08-31 | 2003-05-20 | Hewlett-Packard Development Company, L.P. | Efficient address interleaving with simultaneous multiple locality options |
| US6633960B1 (en) | 2000-08-31 | 2003-10-14 | Hewlett-Packard Development Company, L.P. | Scalable directory based cache coherence protocol |
| US6715057B1 (en) | 2000-08-31 | 2004-03-30 | Hewlett-Packard Development Company, L.P. | Efficient translation lookaside buffer miss processing in computer systems with a large range of page sizes |
| US6668335B1 (en) | 2000-08-31 | 2003-12-23 | Hewlett-Packard Company, L.P. | System for recovering data in a multiprocessor system comprising a conduction path for each bit between processors where the paths are grouped into separate bundles and routed along different paths |
| US6681295B1 (en) | 2000-08-31 | 2004-01-20 | Hewlett-Packard Development Company, L.P. | Fast lane prefetching |
| US7213087B1 (en) | 2000-08-31 | 2007-05-01 | Hewlett-Packard Development Company, L.P. | Mechanism to control the allocation of an N-source shared buffer |
| US6704817B1 (en) * | 2000-08-31 | 2004-03-09 | Hewlett-Packard Development Company, L.P. | Computer architecture and system for efficient management of bi-directional bus |
| US6662265B1 (en) | 2000-08-31 | 2003-12-09 | Hewlett-Packard Development Company, L.P. | Mechanism to track all open pages in a DRAM memory system |
| US6754739B1 (en) | 2000-08-31 | 2004-06-22 | Hewlett-Packard Development Company | Computer resource management and allocation system |
| US8458754B2 (en) | 2001-01-22 | 2013-06-04 | Sony Computer Entertainment Inc. | Method and system for providing instant start multimedia content |
| US7093108B2 (en) * | 2001-02-01 | 2006-08-15 | Arm Limited | Apparatus and method for efficiently incorporating instruction set information with instruction addresses |
| US7093236B2 (en) | 2001-02-01 | 2006-08-15 | Arm Limited | Tracing out-of-order data |
| US7320065B2 (en) | 2001-04-26 | 2008-01-15 | Eleven Engineering Incorporated | Multithread embedded processor with input/output capability |
| US6696060B2 (en) | 2001-06-14 | 2004-02-24 | Clearant, Inc. | Methods for sterilizing preparations of monoclonal immunoglobulins |
| US6742179B2 (en) * | 2001-07-12 | 2004-05-25 | International Business Machines Corporation | Restructuring of executable computer code and large data sets |
| US6946098B2 (en) | 2001-08-10 | 2005-09-20 | Clearant, Inc. | Methods for sterilizing biological materials |
| US7252799B2 (en) | 2001-08-31 | 2007-08-07 | Clearant, Inc. | Methods for sterilizing preparations containing albumin |
| US6749851B2 (en) | 2001-08-31 | 2004-06-15 | Clearant, Inc. | Methods for sterilizing preparations of digestive enzymes |
| US20030095890A1 (en) | 2001-09-24 | 2003-05-22 | Shirley Miekka | Methods for sterilizing biological materials containing non-aqueous solvents |
| US20030101336A1 (en) * | 2001-11-28 | 2003-05-29 | Sun Microsystems, Inc. | Technique for associating instructions with execution events |
| US7096390B2 (en) | 2002-04-01 | 2006-08-22 | Sun Microsystems, Inc. | Sampling mechanism including instruction filtering |
| US20040003148A1 (en) * | 2002-06-28 | 2004-01-01 | Sun Microsystems, Inc., A Delaware Corporation | Buffer management for real time systems management controller |
| US7210072B2 (en) * | 2002-12-17 | 2007-04-24 | Texas Instruments Incorporated | Apparatus and method for trace stream identification of a pipeline flattener primary code flush following initiation of an interrupt service routine |
| DE602004010098T3 (en) | 2003-05-06 | 2014-09-04 | Apple Inc. | METHOD FOR MODIFYING A MESSAGE STORAGE AND TRANSMISSION NETWORK SYSTEM AND DATA ANSWERING SYSTEM |
| US20050183065A1 (en) * | 2004-02-13 | 2005-08-18 | Wolczko Mario I. | Performance counters in a multi-threaded processor |
| US8826241B2 (en) * | 2004-02-16 | 2014-09-02 | Oracle America, Inc. | Instruction sampling in a multi-threaded processor |
| US20050188186A1 (en) * | 2004-02-23 | 2005-08-25 | Wolczko Mario I. | Obtaining execution path information in an instruction sampling system |
| US7735073B1 (en) | 2004-02-28 | 2010-06-08 | Oracle International Corporation | Method and apparatus for data object profiling |
| US8065665B1 (en) * | 2004-02-28 | 2011-11-22 | Oracle America, Inc. | Method and apparatus for correlating profile data |
| US7827543B1 (en) | 2004-02-28 | 2010-11-02 | Oracle America, Inc. | Method and apparatus for profiling data addresses |
| US20050198555A1 (en) * | 2004-03-03 | 2005-09-08 | Wolczko Mario I. | Incorporating instruction reissue in an instruction sampling mechanism |
| US20050204346A1 (en) * | 2004-03-09 | 2005-09-15 | Intel Corporation | Using sampling data for program phase detection |
| US7707554B1 (en) | 2004-04-21 | 2010-04-27 | Oracle America, Inc. | Associating data source information with runtime events |
| US20080133601A1 (en) * | 2005-01-05 | 2008-06-05 | Musicstrands, S.A.U. | System And Method For Recommending Multimedia Elements |
| US7693887B2 (en) * | 2005-02-01 | 2010-04-06 | Strands, Inc. | Dynamic identification of a new set of media items responsive to an input mediaset |
| EP1849099B1 (en) * | 2005-02-03 | 2014-05-07 | Apple Inc. | Recommender system for identifying a new set of media items responsive to an input set of media items and knowledge base metrics |
| WO2006084269A2 (en) | 2005-02-04 | 2006-08-10 | Musicstrands, Inc. | System for browsing through a music catalog using correlation metrics of a knowledge base of mediasets |
| EP1926027A1 (en) * | 2005-04-22 | 2008-05-28 | Strands Labs S.A. | System and method for acquiring and aggregating data relating to the reproduction of multimedia files or elements |
| US7774758B2 (en) * | 2005-05-16 | 2010-08-10 | Texas Instruments Incorporated | Systems and methods for secure debugging and profiling of a computer system |
| US7877387B2 (en) * | 2005-09-30 | 2011-01-25 | Strands, Inc. | Systems and methods for promotional media item selection and promotional program unit generation |
| US20090070267A9 (en) * | 2005-09-30 | 2009-03-12 | Musicstrands, Inc. | User programmed media delivery service |
| BRPI0616928A2 (en) | 2005-10-04 | 2011-07-05 | Strands Inc | Methods and computer program for viewing a music library |
| JP4940410B2 (en) | 2005-12-19 | 2012-05-30 | アップル インコーポレイテッド | User-to-user recommender |
| US20070162546A1 (en) * | 2005-12-22 | 2007-07-12 | Musicstrands, Inc. | Sharing tags among individual user media libraries |
| US20070244880A1 (en) * | 2006-02-03 | 2007-10-18 | Francisco Martin | Mediaset generation system |
| US20090222392A1 (en) * | 2006-02-10 | 2009-09-03 | Strands, Inc. | Dymanic interactive entertainment |
| US7743009B2 (en) * | 2006-02-10 | 2010-06-22 | Strands, Inc. | System and methods for prioritizing mobile media player files |
| US8521611B2 (en) | 2006-03-06 | 2013-08-27 | Apple Inc. | Article trading among members of a community |
| CN101611401B (en) * | 2006-10-20 | 2012-10-03 | 苹果公司 | Personal music recommendation mapping |
| US8671000B2 (en) | 2007-04-24 | 2014-03-11 | Apple Inc. | Method and arrangement for providing content to multimedia devices |
| US9483405B2 (en) | 2007-09-20 | 2016-11-01 | Sony Interactive Entertainment Inc. | Simplified run-time program translation for emulating complex processor pipelines |
| US20090276368A1 (en) * | 2008-04-28 | 2009-11-05 | Strands, Inc. | Systems and methods for providing personalized recommendations of products and services based on explicit and implicit user data and feedback |
| US20090276351A1 (en) * | 2008-04-30 | 2009-11-05 | Strands, Inc. | Scaleable system and method for distributed prediction markets |
| EP2304597A4 (en) * | 2008-05-31 | 2012-10-31 | Apple Inc | Adaptive recommender technology |
| US20090299945A1 (en) * | 2008-06-03 | 2009-12-03 | Strands, Inc. | Profile modeling for sharing individual user preferences |
| DE102008045767A1 (en) * | 2008-09-04 | 2010-03-11 | Continental Teves Ag & Co. Ohg | Microprocessor with pipeline bubble detector |
| US8914384B2 (en) | 2008-09-08 | 2014-12-16 | Apple Inc. | System and method for playlist generation based on similarity data |
| US8332406B2 (en) | 2008-10-02 | 2012-12-11 | Apple Inc. | Real-time visualization of user consumption of media items |
| US20100169328A1 (en) * | 2008-12-31 | 2010-07-01 | Strands, Inc. | Systems and methods for making recommendations using model-based collaborative filtering with user communities and items collections |
| US20110060738A1 (en) | 2009-09-08 | 2011-03-10 | Apple Inc. | Media item clustering based on similarity data |
| US8082467B2 (en) * | 2009-12-23 | 2011-12-20 | International Business Machines Corporation | Triggering workaround capabilities based on events active in a processor pipeline |
| US8433759B2 (en) | 2010-05-24 | 2013-04-30 | Sony Computer Entertainment America Llc | Direction-conscious information sharing |
| US20120084537A1 (en) * | 2010-09-30 | 2012-04-05 | International Business Machines Corporation | System and method for execution based filtering of instructions of a processor to manage dynamic code optimization |
| WO2013048468A1 (en) * | 2011-09-30 | 2013-04-04 | Intel Corporation | Instruction and logic to perform dynamic binary translation |
| US8983905B2 (en) | 2011-10-03 | 2015-03-17 | Apple Inc. | Merging playlists from multiple sources |
| US10176013B2 (en) | 2014-03-13 | 2019-01-08 | International Business Machines Corporation | Dual/multi-mode processor pipeline sampling |
| US9916161B2 (en) | 2015-06-25 | 2018-03-13 | Intel Corporation | Instruction and logic for tracking fetch performance bottlenecks |
| US9830160B1 (en) * | 2016-09-22 | 2017-11-28 | International Business Machines Corporation | Lightweight profiling using branch history |
| US10936653B2 (en) | 2017-06-02 | 2021-03-02 | Apple Inc. | Automatically predicting relevant contexts for media items |
| US11853221B2 (en) | 2022-02-18 | 2023-12-26 | Hewlett Packard Enterprise Development Lp | Dynamic prefetching of data from storage |
Family Cites Families (17)
| Publication number | Priority date | Publication date | Assignee | Title |
|---|---|---|---|---|
| US4590550A (en) * | 1983-06-29 | 1986-05-20 | International Business Machines Corporation | Internally distributed monitoring system |
| US5103394A (en) * | 1984-04-30 | 1992-04-07 | Hewlett-Packard Company | Software performance analyzer |
| US4845615A (en) * | 1984-04-30 | 1989-07-04 | Hewlett-Packard Company | Software performance analyzer |
| US4821178A (en) * | 1986-08-15 | 1989-04-11 | International Business Machines Corporation | Internal performance monitoring by event sampling |
| US5151981A (en) * | 1990-07-13 | 1992-09-29 | International Business Machines Corporation | Instruction sampling instrumentation |
| JPH0774984B2 (en) * | 1991-06-10 | 1995-08-09 | インターナショナル・ビジネス・マシーンズ・コーポレイション | System resource utilization measurement method and data processing system |
| US5450586A (en) * | 1991-08-14 | 1995-09-12 | Hewlett-Packard Company | System for analyzing and debugging embedded software through dynamic and interactive use of code markers |
| GB2266606B (en) * | 1992-04-27 | 1996-02-14 | Intel Corp | A microprocessor with an external command mode |
| JPH06290079A (en) * | 1993-03-30 | 1994-10-18 | Hitachi Ltd | Information processing system |
| US5485574A (en) * | 1993-11-04 | 1996-01-16 | Microsoft Corporation | Operating system based performance monitoring of programs |
| US5493673A (en) * | 1994-03-24 | 1996-02-20 | International Business Machines Corporation | Method and apparatus for dynamically sampling digital counters to improve statistical accuracy |
| US5446876A (en) * | 1994-04-15 | 1995-08-29 | International Business Machines Corporation | Hardware mechanism for instruction/data address tracing |
| US5581482A (en) * | 1994-04-26 | 1996-12-03 | Unisys Corporation | Performance monitor for digital computer system |
| US5528753A (en) * | 1994-06-30 | 1996-06-18 | International Business Machines Corporation | System and method for enabling stripped object software monitoring in a computer system |
| US5537541A (en) * | 1994-08-16 | 1996-07-16 | Digital Equipment Corporation | System independent interface for performance counters |
| US5751945A (en) * | 1995-10-02 | 1998-05-12 | International Business Machines Corporation | Method and system for performance monitoring stalls to identify pipeline bottlenecks and stalls in a processing system |
| US5809450A (en) * | 1997-11-26 | 1998-09-15 | Digital Equipment Corporation | Method for estimating statistics of properties of instructions processed by a processor pipeline |
-
1997
- 1997-11-26 US US08/980,190 patent/US6000044A/en not_active Expired - Fee Related
-
1998
- 1998-11-25 DE DE69819849T patent/DE69819849T2/en not_active Expired - Lifetime
- 1998-11-25 EP EP98309631A patent/EP0919918B1/en not_active Expired - Lifetime
- 1998-11-26 JP JP37553698A patent/JP4467093B2/en not_active Expired - Fee Related
Non-Patent Citations (1)
| Title |
|---|
| SMITH J.E. ET AL: "PowerPC 601 and Alpha 21064: A Tale of Two RISCs", COMPUTER, vol. 27, no. 6, June 1994 (1994-06-01), US, pages 46 - 58 * |
Also Published As
| Publication number | Publication date |
|---|---|
| DE69819849T2 (en) | 2004-09-02 |
| EP0919918A3 (en) | 2000-02-23 |
| EP0919918A2 (en) | 1999-06-02 |
| JPH11272515A (en) | 1999-10-08 |
| DE69819849D1 (en) | 2003-12-24 |
| JP4467093B2 (en) | 2010-05-26 |
| US6000044A (en) | 1999-12-07 |
Similar Documents
| Publication | Publication Date | Title |
|---|---|---|
| EP0919918B1 (en) | Apparatus for randomly sampling instructions in a processor pipeline | |
| EP0919924B1 (en) | Apparatus for sampling multiple concurrent instructions in a processor pipeline | |
| EP0919922B1 (en) | Method for estimating statistics of properties of interactions processed by a processor pipeline | |
| US5923872A (en) | Apparatus for sampling instruction operand or result values in a processor pipeline | |
| US6070009A (en) | Method for estimating execution rates of program execution paths | |
| US5964867A (en) | Method for inserting memory prefetch operations based on measured latencies in a program optimizer | |
| US5809450A (en) | Method for estimating statistics of properties of instructions processed by a processor pipeline | |
| US6092180A (en) | Method for measuring latencies by randomly selected sampling of the instructions while the instruction are executed | |
| US6195748B1 (en) | Apparatus for sampling instruction execution information in a processor pipeline | |
| US6549930B1 (en) | Method for scheduling threads in a multithreaded processor | |
| US6237073B1 (en) | Method for providing virtual memory to physical memory page mapping in a computer operating system that randomly samples state information | |
| US5797019A (en) | Method and system for performance monitoring time lengths of disabled interrupts in a processing system | |
| US5752062A (en) | Method and system for performance monitoring through monitoring an order of processor events during execution in a processing system | |
| US5691920A (en) | Method and system for performance monitoring of dispatch unit efficiency in a processing system | |
| US6148396A (en) | Apparatus for sampling path history in a processor pipeline | |
| US6708296B1 (en) | Method and system for selecting and distinguishing an event sequence using an effective address in a processing system | |
| US5751945A (en) | Method and system for performance monitoring stalls to identify pipeline bottlenecks and stalls in a processing system | |
| US6175814B1 (en) | Apparatus for determining the instantaneous average number of instructions processed | |
| JP5649613B2 (en) | Method, apparatus, microprocessor and system for enhancing performance monitoring architecture for critical path based analysis | |
| Dean et al. | ProfileMe: Hardware support for instruction-level profiling on out-of-order processors | |
| US6189072B1 (en) | Performance monitoring of cache misses and instructions completed for instruction parallelism analysis | |
| US5938760A (en) | System and method for performance monitoring of instructions in a re-order buffer | |
| US6574727B1 (en) | Method and apparatus for instruction sampling for performance monitoring and debug | |
| US5949971A (en) | Method and system for performance monitoring through identification of frequency and length of time of execution of serialization instructions in a processing system | |
| US6539502B1 (en) | Method and apparatus for identifying instructions for performance monitoring in a microprocessor |
Legal Events
| Date | Code | Title | Description |
|---|---|---|---|
| PUAI | Public reference made under article 153(3) epc to a published international application that has entered the european phase |
Free format text: ORIGINAL CODE: 0009012 |
|
| AK | Designated contracting states |
Kind code of ref document: A2 Designated state(s): DE FR GB |
|
| AX | Request for extension of the european patent |
Free format text: AL;LT;LV;MK;RO;SI |
|
| PUAL | Search report despatched |
Free format text: ORIGINAL CODE: 0009013 |
|
| AK | Designated contracting states |
Kind code of ref document: A3 Designated state(s): AT BE CH CY DE DK ES FI FR GB GR IE IT LI LU MC NL PT SE |
|
| AX | Request for extension of the european patent |
Free format text: AL;LT;LV;MK;RO;SI |
|
| RAP1 | Party data changed (applicant data changed or rights of an application transferred) |
Owner name: COMPAQ COMPUTER CORPORATION |
|
| 17P | Request for examination filed |
Effective date: 20000811 |
|
| AKX | Designation fees paid |
Free format text: DE FR GB |
|
| 17Q | First examination report despatched |
Effective date: 20001115 |
|
| GRAH | Despatch of communication of intention to grant a patent |
Free format text: ORIGINAL CODE: EPIDOS IGRA |
|
| GRAS | Grant fee paid |
Free format text: ORIGINAL CODE: EPIDOSNIGR3 |
|
| GRAA | (expected) grant |
Free format text: ORIGINAL CODE: 0009210 |
|
| AK | Designated contracting states |
Kind code of ref document: B1 Designated state(s): DE FR GB |
|
| REG | Reference to a national code |
Ref country code: GB Ref legal event code: FG4D |
|
| REF | Corresponds to: |
Ref document number: 69819849 Country of ref document: DE Date of ref document: 20031224 Kind code of ref document: P |
|
| ET | Fr: translation filed | ||
| PLBE | No opposition filed within time limit |
Free format text: ORIGINAL CODE: 0009261 |
|
| STAA | Information on the status of an ep patent application or granted ep patent |
Free format text: STATUS: NO OPPOSITION FILED WITHIN TIME LIMIT |
|
| 26N | No opposition filed |
Effective date: 20040820 |
|
| PGFP | Annual fee paid to national office [announced via postgrant information from national office to epo] |
Ref country code: FR Payment date: 20051117 Year of fee payment: 8 |
|
| REG | Reference to a national code |
Ref country code: FR Ref legal event code: ST Effective date: 20070731 |
|
| PG25 | Lapsed in a contracting state [announced via postgrant information from national office to epo] |
Ref country code: FR Free format text: LAPSE BECAUSE OF NON-PAYMENT OF DUE FEES Effective date: 20061130 |
|
| PGFP | Annual fee paid to national office [announced via postgrant information from national office to epo] |
Ref country code: GB Payment date: 20071128 Year of fee payment: 10 |
|
| GBPC | Gb: european patent ceased through non-payment of renewal fee |
Effective date: 20081125 |
|
| PG25 | Lapsed in a contracting state [announced via postgrant information from national office to epo] |
Ref country code: GB Free format text: LAPSE BECAUSE OF NON-PAYMENT OF DUE FEES Effective date: 20081125 |
|
| REG | Reference to a national code |
Ref country code: DE Ref legal event code: R082 Ref document number: 69819849 Country of ref document: DE Representative=s name: BOEHMERT & BOEHMERT ANWALTSPARTNERSCHAFT MBB -, DE Effective date: 20120329 Ref country code: DE Ref legal event code: R081 Ref document number: 69819849 Country of ref document: DE Owner name: HEWLETT-PACKARD DEVELOPMENT COMPANY, L.P., HOU, US Free format text: FORMER OWNER: COMPAQ COMPUTER CORP., HOUSTON, TEX., US Effective date: 20120329 |
|
| PGFP | Annual fee paid to national office [announced via postgrant information from national office to epo] |
Ref country code: DE Payment date: 20121128 Year of fee payment: 15 |
|
| REG | Reference to a national code |
Ref country code: DE Ref legal event code: R119 Ref document number: 69819849 Country of ref document: DE Effective date: 20140603 |
|
| PG25 | Lapsed in a contracting state [announced via postgrant information from national office to epo] |
Ref country code: DE Free format text: LAPSE BECAUSE OF NON-PAYMENT OF DUE FEES Effective date: 20140603 |