EP0851241A2 - Ultrasonic diagnostic imaging of response frequency differing from transmit frequency - Google Patents
Ultrasonic diagnostic imaging of response frequency differing from transmit frequency Download PDFInfo
- Publication number
- EP0851241A2 EP0851241A2 EP97308965A EP97308965A EP0851241A2 EP 0851241 A2 EP0851241 A2 EP 0851241A2 EP 97308965 A EP97308965 A EP 97308965A EP 97308965 A EP97308965 A EP 97308965A EP 0851241 A2 EP0851241 A2 EP 0851241A2
- Authority
- EP
- European Patent Office
- Prior art keywords
- harmonic
- ultrasonic
- echo signals
- imaging system
- diagnostic imaging
- Prior art date
- Legal status (The legal status is an assumption and is not a legal conclusion. Google has not performed a legal analysis and makes no representation as to the accuracy of the status listed.)
- Granted
Links
Images


Classifications
-
- G—PHYSICS
- G01—MEASURING; TESTING
- G01S—RADIO DIRECTION-FINDING; RADIO NAVIGATION; DETERMINING DISTANCE OR VELOCITY BY USE OF RADIO WAVES; LOCATING OR PRESENCE-DETECTING BY USE OF THE REFLECTION OR RERADIATION OF RADIO WAVES; ANALOGOUS ARRANGEMENTS USING OTHER WAVES
- G01S7/00—Details of systems according to groups G01S13/00, G01S15/00, G01S17/00
- G01S7/52—Details of systems according to groups G01S13/00, G01S15/00, G01S17/00 of systems according to group G01S15/00
- G01S7/52017—Details of systems according to groups G01S13/00, G01S15/00, G01S17/00 of systems according to group G01S15/00 particularly adapted to short-range imaging
- G01S7/52046—Techniques for image enhancement involving transmitter or receiver
-
- A—HUMAN NECESSITIES
- A61—MEDICAL OR VETERINARY SCIENCE; HYGIENE
- A61B—DIAGNOSIS; SURGERY; IDENTIFICATION
- A61B8/00—Diagnosis using ultrasonic, sonic or infrasonic waves
- A61B8/13—Tomography
- A61B8/14—Echo-tomography
-
- A—HUMAN NECESSITIES
- A61—MEDICAL OR VETERINARY SCIENCE; HYGIENE
- A61B—DIAGNOSIS; SURGERY; IDENTIFICATION
- A61B8/00—Diagnosis using ultrasonic, sonic or infrasonic waves
- A61B8/48—Diagnostic techniques
- A61B8/488—Diagnostic techniques involving Doppler signals
-
- A—HUMAN NECESSITIES
- A61—MEDICAL OR VETERINARY SCIENCE; HYGIENE
- A61B—DIAGNOSIS; SURGERY; IDENTIFICATION
- A61B8/00—Diagnosis using ultrasonic, sonic or infrasonic waves
- A61B8/52—Devices using data or image processing specially adapted for diagnosis using ultrasonic, sonic or infrasonic waves
- A61B8/5207—Devices using data or image processing specially adapted for diagnosis using ultrasonic, sonic or infrasonic waves involving processing of raw data to produce diagnostic data, e.g. for generating an image
-
- G—PHYSICS
- G01—MEASURING; TESTING
- G01S—RADIO DIRECTION-FINDING; RADIO NAVIGATION; DETERMINING DISTANCE OR VELOCITY BY USE OF RADIO WAVES; LOCATING OR PRESENCE-DETECTING BY USE OF THE REFLECTION OR RERADIATION OF RADIO WAVES; ANALOGOUS ARRANGEMENTS USING OTHER WAVES
- G01S7/00—Details of systems according to groups G01S13/00, G01S15/00, G01S17/00
- G01S7/52—Details of systems according to groups G01S13/00, G01S15/00, G01S17/00 of systems according to group G01S15/00
- G01S7/52017—Details of systems according to groups G01S13/00, G01S15/00, G01S17/00 of systems according to group G01S15/00 particularly adapted to short-range imaging
- G01S7/52023—Details of receivers
- G01S7/52036—Details of receivers using analysis of echo signal for target characterisation
- G01S7/52038—Details of receivers using analysis of echo signal for target characterisation involving non-linear properties of the propagation medium or of the reflective target
-
- G—PHYSICS
- G01—MEASURING; TESTING
- G01S—RADIO DIRECTION-FINDING; RADIO NAVIGATION; DETERMINING DISTANCE OR VELOCITY BY USE OF RADIO WAVES; LOCATING OR PRESENCE-DETECTING BY USE OF THE REFLECTION OR RERADIATION OF RADIO WAVES; ANALOGOUS ARRANGEMENTS USING OTHER WAVES
- G01S15/00—Systems using the reflection or reradiation of acoustic waves, e.g. sonar systems
- G01S15/88—Sonar systems specially adapted for specific applications
- G01S15/89—Sonar systems specially adapted for specific applications for mapping or imaging
- G01S15/8906—Short-range imaging systems; Acoustic microscope systems using pulse-echo techniques
- G01S15/8979—Combined Doppler and pulse-echo imaging systems
-
- G—PHYSICS
- G01—MEASURING; TESTING
- G01S—RADIO DIRECTION-FINDING; RADIO NAVIGATION; DETERMINING DISTANCE OR VELOCITY BY USE OF RADIO WAVES; LOCATING OR PRESENCE-DETECTING BY USE OF THE REFLECTION OR RERADIATION OF RADIO WAVES; ANALOGOUS ARRANGEMENTS USING OTHER WAVES
- G01S7/00—Details of systems according to groups G01S13/00, G01S15/00, G01S17/00
- G01S7/52—Details of systems according to groups G01S13/00, G01S15/00, G01S17/00 of systems according to group G01S15/00
- G01S7/52017—Details of systems according to groups G01S13/00, G01S15/00, G01S17/00 of systems according to group G01S15/00 particularly adapted to short-range imaging
- G01S7/52023—Details of receivers
- G01S7/52033—Gain control of receivers
-
- G—PHYSICS
- G01—MEASURING; TESTING
- G01S—RADIO DIRECTION-FINDING; RADIO NAVIGATION; DETERMINING DISTANCE OR VELOCITY BY USE OF RADIO WAVES; LOCATING OR PRESENCE-DETECTING BY USE OF THE REFLECTION OR RERADIATION OF RADIO WAVES; ANALOGOUS ARRANGEMENTS USING OTHER WAVES
- G01S7/00—Details of systems according to groups G01S13/00, G01S15/00, G01S17/00
- G01S7/52—Details of systems according to groups G01S13/00, G01S15/00, G01S17/00 of systems according to group G01S15/00
- G01S7/52017—Details of systems according to groups G01S13/00, G01S15/00, G01S17/00 of systems according to group G01S15/00 particularly adapted to short-range imaging
- G01S7/52053—Display arrangements
- G01S7/52057—Cathode ray tube displays
- G01S7/5206—Two-dimensional coordinated display of distance and direction; B-scan display
-
- G—PHYSICS
- G01—MEASURING; TESTING
- G01S—RADIO DIRECTION-FINDING; RADIO NAVIGATION; DETERMINING DISTANCE OR VELOCITY BY USE OF RADIO WAVES; LOCATING OR PRESENCE-DETECTING BY USE OF THE REFLECTION OR RERADIATION OF RADIO WAVES; ANALOGOUS ARRANGEMENTS USING OTHER WAVES
- G01S7/00—Details of systems according to groups G01S13/00, G01S15/00, G01S17/00
- G01S7/52—Details of systems according to groups G01S13/00, G01S15/00, G01S17/00 of systems according to group G01S15/00
- G01S7/52017—Details of systems according to groups G01S13/00, G01S15/00, G01S17/00 of systems according to group G01S15/00 particularly adapted to short-range imaging
- G01S7/52053—Display arrangements
- G01S7/52057—Cathode ray tube displays
- G01S7/52074—Composite displays, e.g. split-screen displays; Combination of multiple images or of images and alphanumeric tabular information
Definitions
- This invention relates to ultrasonic diagnosis and imaging of the body and, in particular, to new methods and apparatus for ultrasonically imaging with a response frequency which differs from the transmitted frequency.
- Contrast agents are substances which are biocompatible and exhibit uniquely chosen acoustic properties which return readily identifiable echo signals in response to insonification. Contrast agents can have several properties which enables them to enhance an ultrasonic image. One is the nonlinear characteristics of many contrast agents. Agents have been produced which, when insonified by an ultrasonic wave at one frequency, will exhibit resonance modes which return energy at other frequencies, in particular, harmonic frequencies. A harmonic contrast agent, when insonified at a fundamental frequency, will return echoes at the second, third, fourth, and higher harmonics of that frequency.
- tissue and fluids also have inherent nonlinear properties. Tissue and fluids will, even in the absence of a contrast agent, develop and return their own non-fundamental frequency echo response signals, including signals at harmonics of the fundamental. Muir and Carstensen explored these properties of water beginning in 1980, and Starritt et al. looked at these properties in human calf muscle and excised bovine liver.
- an ultrasonic imaging system and method for imaging tissue and fluids from response frequencies which differ from the transmitted frequency, in particular echoes returned from the tissue or fluids at a harmonic of a transmitted fundamental frequency.
- the imaging system comprises a means for transmitting an ultrasonic wave at a fundamental frequency, means for receiving echoes at a harmonic frequency, and an image processor for producing an ultrasonic image from the harmonic frequency echoes.
- the transmitting and receiving means comprise a single ultrasonic probe.
- the probe utilizes a broadband ultrasonic transducer for both transmission and reception.
- partially decorrelated components of received harmonic echoes are produced and utilized to remove artifacts from the harmonic image, providing clearly defined images of tissue boundaries such as that of the endocardium.
- the partially decorrelated components are produced by processing the harmonic echoes through different passbands.
- the methods of the present invention include the use of harmonic echoes to reduce near-field or multipath clutter in an ultrasonic image, such as that produced when imaging through a narrow acoustic window such as the ribs.
- harmonic and fundamental echoes are blended in a common image to reduce clutter, image at appreciable depths, and overcome the effects of depth-dependent attenuation.
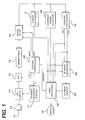
- a central controller 120 commands a transmit frequency control 117 to transmit a desired transmit frequency band.
- the parameters of the transmit frequency band, f tr are coupled to the transmit frequency control 117, which causes the transducer 112 of ultrasonic probe 110 to transmit ultrasonic waves in the fundamental frequency band.
- a band of frequencies located about a central frequency of 1.67 MHz is transmitted. This is lower than conventional transmitted imaging frequencies, which generally range from 2.5 MHz and above. However, use of a typical transmit frequency of 3 or 5 MHz will produce harmonics at 6 and 10 MHz.
- the central transmit frequency in the illustrated embodiment is below 5 MHz, and preferably below 2.5 MHz, thereby producing lower frequency harmonics that are less susceptible to depth dependent attenuation and enabling harmonic imaging at greater depths.
- a transmitted fundamental frequency of 1.67 MHz will produce second harmonic return signals at 3.34 MHz in the illustrated embodiment. It will be understood, of course, that any ultrasonic frequency may be used, with due consideration of the desired depth of penetration and the sensitivity of the transducer and ultrasound system.
- the array transducer 112 of the probe 110 transmits ultrasonic energy and receives echoes returned in response to this transmission.
- the response characteristic of the transducer can exhibit two passbands, one around the fundamental transmit frequency and another about a harmonic frequency in the received passband.
- a broadband transducer having a passband encompassing both the transmitted fundamental and received harmonic passbands is preferred.
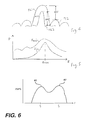
- the transducer may be manufactured and tuned to exhibit a response characteristic as shown in FIGURE 6, in which the lower hump 60 of the response characteristic is centered about the transmitted fundamental frequency f t , and the upper hump 62 is centered about the received harmonic frequency f r of the response passband.
- the transducer response characteristic of FIGURE 7 is preferred, however, as the single dominant characteristic 64 allows the probe to be suitable for both harmonic imaging and conventional broadband imaging.
- the characteristic 64 encompasses the transmitted fundamental frequency f t , and also the harmonic receive passband bounded between frequencies f L and f c , and centered about frequency f r .
- a low fundamental transmit frequency of 1.67 MHz will result in harmonic returning echo signals at a frequency of 3.34 MHz.
- a response characteristic 64 of approximately 2 MHz would be suitable for these fundamental and harmonic frequencies.
- Tissue and cells in the body alter the transmitted fundamental frequency signals during propagation and the returned echoes contain harmonic components of the originally transmitted fundamental frequency.
- these echoes are received by the transducer array 112, coupled through the T/R switch 114 and digitized by analog to digital converters 115.
- the sampling frequency f s of the A/D converters 115 is controlled by the central controller.
- the desired sampling rate dictated by sampling theory is at least twice the highest frequency fc of the received passband and, for the preceding exemplary frequencies, might be on the order of at least 8 MHz. Sampling rates higher than the minimum requirement are also desirable.
- the echo signal samples from the individual transducer elements are delayed and summed by a beamformer 116 to form coherent echo signals.
- the digital coherent echo signals are then filtered by a digital filter 118.
- the transmit frequency f t is not tied to the receiver, and hence the receiver is free to receive a band of frequencies which is different from the transmitted band.
- the digital filter 118 bandpass filters the signals in the passband bounded by frequencies f L and f c in FIGURE 7, and can also shift the frequency band to a lower or baseband frequency range.
- the digital filter could be a filter with a 1 MHz passband and a center frequency of 3.34 MHz in the above example.
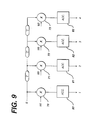
- a preferred digital filter is a series of multipliers 70-73 and accumulators 80-83 as shown in FIGURE 9.
- This arrangement is controlled by the central controller 120, which provides multiplier weights and decimation control which control the characteristics of the digital filter.
- the arrangement is controlled to operate as a finite impulse response (FIR) filter, and performs both filtering and decimation.
- FIR finite impulse response
- the first stage output 1 could be controlled to operate as a four tap FIR filter with a 4:1 decimation rate.
- Temporally discrete echo samples S are applied to the multiplier 70 of the first stage. As the samples S are applied, they are multiplied by weights provided by the central controller 120. Each of these products is stored in the accumulator 80 until four such products have been accumulated (added).
- An output signal is then produced at the first stage output 1.
- the output signal has been filtered by a four tap FIR filter since the accumulated total comprises four weighted samples. Since the time of four samples is required to accumulate the output signal, a 4:1 decimation rate is achieved. One output signal is produced for every four input samples. The accumulator is cleared and the process repeats. It is seen that the higher the decimation rate (the longer the interval between output signals), the greater can be the effective tap number of the filter.
- temporally separate samples are delayed by delay elements ⁇ and applied to the four multipliers 70-73, multiplied, and accumulated in the accumulators 80-83. After each accumulator has accumulated two products, the four output signals are combined as a single output signal.
- the filter is operating as an eight tap filter with a 2:1 decimation rate. With no decimation, the arrangement can be operated as a four tap FIR filter.
- the filter can also be operated by applying echo signals to all multipliers simultaneously and selectively time sequencing the weighting coefficients. A whole range of filter characteristics are possible through programming of the weighting and decimation rates of the filter, under control of the central controller.
- the use of a digital filter provides the advantage of being quickly and easily changed to provide a different filter characteristic.
- a digital filter can be programmed to pass received fundamental frequencies at one moment, and harmonic frequencies at the next.
- the digital filter can thus be operated to alternately produce images or lines of fundamental and harmonic digital signals, or lines of different alternating harmonics in a time-interleaved sequence simply by changing the filter coefficients during signal processing.
- the digital filter 118 is controlled by the central controller 120 to pass echo signals at a harmonic frequency for processing, to the exclusion of the fundamental frequency.
- the harmonic echo signals from the tissue are detected and processed by either a B mode processor 37 or a contrast signal detector 128 for display as a two dimensional ultrasonic image on the display 50.
- the filtered echo signals from the digital filter 118 are also coupled to a Doppler processor 130 for conventional Doppler processing to produce velocity and power Doppler signals.
- the outputs of these processors are coupled to a 3D image rendering processor 162 for the rendering of three dimensional images, which are stored in a 3D image memory 164.
- Three dimensional rendering may be performed as described in U.S. Pat. [appl. serial no. 08/638,710], and in U.S. Pats. 5,474,073 and 5,485,842, the latter two patents illustrating three dimensional power Doppler ultrasonic imaging techniques.
- the signals from the contrast signal detector 128, the processors 37 and 130, and the three dimensional image signals are coupled to a video processor 140 where they may be selected for two or three dimensional display on an image display 50 as-dictated by user selection.
- harmonic imaging of tissue and blood can reduce near field clutter in the ultrasonic image. It is believed that the harmonic response effect in tissue is dependent upon the energy level of the transmitted waves. Near to an array transducer which is focused at a greater depth, transmitted wave components are unfocused and of insufficient energy to stimulate a detectable harmonic response in the near field tissue. But as the transmitted wave continues to penetrate the body, the higher intensity energy will give rise to the harmonic effect as the wave components begin to focus. While both near and far field regions will return a fundamental frequency response, clutter from these signals is eliminated by the passband of the digital filter 118, which is set to the harmonic frequency band. The harmonic response from the tissue is then detected and displayed, while the clutter from the near field fundamental response is eliminated from the displayed image.
- FIGURES 2, 3, 4, and 5 illustrate some of the properties of harmonic return signals which can be utilized to advantage in ultrasonic imaging. It should be appreciated that several of these properties and their interactions are not yet fully and commonly understood among the scientific community, and are still the subject of research and discussion.
- FIGURE 2 illustrates the spatial response, and specifically the main lobe and sidelobes, of fundamental and harmonic signals received by a transducer array 112. In this illustration the array is directed to image an area of the body behind the ribs, such as the heart, and the main lobe is seen to extend between ribs 10 and 10'. Overlying the ribs is a tissue interface 12, as from a layer of fat between the skin and ribs.
- the FIGURE shows a main lobe of the fundamental signals FL1, and on either side of the main lobe are sidelobes FL2 and FL3.
- the FIGURE also shows the main lobe HL1 of a harmonic of the fundamental frequency, and sidelobes HL2 and HL3 of the harmonic main lobe.
- the main lobe of the fundamental echoes is wide enough to encompass portions of the ribs 10,10'. Accordingly, acoustic energy at the fundamental can be reflected back toward the transducer 112 as indicated by the arrow 9. While some of the energy of this reflection may travel back to and be received directly by the transducer, in this example some of the reflected energy is reflected a second time by the tissue interface 12, as indicated by arrow 9'. This second reflection of energy reaches the other rib 10', where it is reflected a second time as shown by arrow 9" and travels back to and is received by the transducer 112.
- these echoes reflected by the ribs are unwanted artifacts which contaminate the ultrasonic image.
- Unwanted echoes which are reflected a number of times before reaching the transducer, such as those following the paths of arrows 9,9',9" are referred to as multipath artifacts.
- image "clutter" which clouds the near field and in some cases all of the image.
- This near field haze or clutter can obscure structure which may be of interest near the transducer.
- the multipath artifacts can be reproduced in the image at greater depths due to the lengthy multiple paths traveled by these artifacts, and can clutter and obscure regions of interest at greater depths of field.
- FIGURE 3 shows a second example in which the main lobes of both the fundamental and harmonic returns do not intersect the ribs, and the problem discussed in FIGURE 2 does not arise.
- the ribs 10, 10' are closer to the skin surface and the transducer 112. While the main lobes do not intersect the ribs, the sidelobes FL2 of the fundamental do reach the ribs, allowing sidelobe energy to be reflected back to the transducer as shown by reflection path 9. Again, this will produce clutter in the fundamental image. But the smaller and narrower sidelobes HL2 of the received harmonic energy do not reach the ribs. Again, the harmonic image will exhibit reduced clutter as compared to the fundamental image.
- FIGURE 4 illustrates the fundamental and harmonic beam patterns in a perspective which is across the lobes of FIGURES 2 and 3, that is, across the axis of the transducer.
- This drawing illustrates the relative amplitude responses of the fundamental and second harmonic beam patterns. Illustrated are the dynamic response DRF between the main (FL1) and first sidelobe (FL2) of the fundamental component of the sound beam, and the dynamic response DRH between the main (HL1) and first sidelobe (HL2) of the second harmonic component. If responses due to the main lobes are considered desired signal responses, and responses due to the sidelobes are considered to be clutter or noise, the signal to noise ratio of the harmonic is greater than that of the fundamental. That is, there is relatively less sidelobe clutter in a harmonic image than in the corresponding fundamental image of the same transmission, or DRH > DRF.
- FIGURE 5 illustrates another comparison of the properties of fundamental and harmonic signals, which is the relative amount of energy (in units of acoustic pressure P) emanating from increasing depths Z in the body at the fundamental and second harmonic frequencies.
- the curve denoted Fund. shows the buildup of propagated acoustic energy at the fundamental frequency. While the curve is seen to peak at the focus of the array transducer, it is seen that there is nonetheless an appreciable amount of fundamental energy at the shallower depths before the focal region. In comparison, there is comparatively much less energy, and a lesser buildup of energy, at the harmonic frequency propagated at these lesser depths of field. Hence, with less energy available for multipath reverberation and other aberrations, there is less near field clutter with harmonic imaging than with imaging the fundamental echo returns from the same transmission.
- FIGURE 8 illustrates the bands of received signals and the digital filter of a typical FIGURE 1 embodiment of the present invention for a transmitted signal of four cycles of a 1.67 MHz acoustic wave. Transmitting multiple cycles narrows the bandwidth of the transmitted signal; the greater the number of cycles, the narrower the bandwidth.
- the transducer 112 receives a fundamental signal in a bandwidth 90, which is seen to peak at the transmitted frequency of 1.67 MHz. As the fundamental frequency band rolls off, the harmonic band 92 comes up, and is seen to exhibit a peak return at the harmonic frequency of 3.34 MHz.
- the received signals are applied to a digital filter with a passband characteristic 94, which is seen to be centered around the harmonic frequency of 3.34 MHz.
- this passband will substantially suppress signals at the fundamental frequency while passing the harmonic signals on to further processing and image formation.
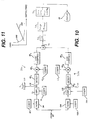
- FIGURE 10 shows a portion of a preferred embodiment of the present invention in block diagram form, from the beamformer output through to the image display.
- This embodiment not only produces harmonic images of tissue and blood flow, but also overcomes signal dropout deficiencies of conventional imaging systems which arise when imaging patients with difficult to image pathology. Additionally, this embodiment reduces an artifact of coherent ultrasound images known as speckle.
- the signal and data lines connecting the blocks of the block diagram all represent multi-conductor digital data paths, as the processor of the illustrated embodiment is entirely digital.
- Scanline echo data from the beamformer 116 is applied in parallel to the two channels 30a,30b of the processor illustrated in FIGURE 10, one of which is a high frequency channel and the other of which is a low frequency channel.
- Each channel of the processor has a normalization stage 32,132 which multiplies the scanline data by a scale factor on a sample by sample basis to produce gain or attenuation that can vary with the depth of the body from which each sample returned.
- the scale factor for each channel is provided by normalization coefficients stored in or generated by coefficient circuits 32,132, which in a preferred embodiment are digital memories. As the multiplying coefficients are changed along the sequence of scanline echoes, depth dependent gain or attenuation is produced.
- the function of the normalization stages is twofold. One is to compensate for a transducer aperture which expands with depth of scan. As signals from an increasing number of transducers are used with increasing depth, the magnitude of the summed beamformed signals will increase. This increase is offset by reduced gain (increased attenuation) in the normalization stage, in proportion to the rate at which channels are added to the beamforming process, so that the resultant echo sequence will be unaffected by the changing aperture.
- the second function of the normalization stages is to equalize the nominal signal amplitudes of the two channels 30a,30b.
- the nominal signal amplitudes of the passbands of the two channels are desirably the same, so that the original relative signal levels will be preserved after the passbands are summed to create the full harmonic passband.
- ultrasound signals are subject to depth dependent attenuation which varies with frequency, higher frequencies being more greatly attenuated with depth than lower frequencies.
- the coefficients for the normalization stages provide signal gain which increases with depth. Since the two channels employ different frequency passbands, the depth dependent gain of the two channels differs from one channel to the other.
- the rate of gain increase for the higher frequency passband channel is greater than that of the lower frequency passband channel.
- FIGURE 11 shows the normalization gain characteristic of the higher frequency passband channel separated into two components.
- the depth dependent characteristic 200 offsets the effect of an increasing aperture in the channel, and the depth dependent characteristic 202 compensates for depth dependent signal attenuation.
- the low frequency passband channel may also have a depth dependent gain characteristic but with a different characteristic 202 for the different rate of attenuation of the lower frequencies.
- the high frequency passband channel has a similar but more rapidly increasing depth dependent gain characteristic to account for the more rapid rate of attenuation of the higher frequencies.
- Each depth dependent gain characteristic 202 is chosen to offset the effect of depth dependent gain for the particular frequency passband employed by that channel.
- the coefficients of the coefficient circuits apply a gain or attenuation characteristic which is a combination of the two characteristics 200,202.
- the coefficient memories 32,132 store multiple combined gain curves which are changed with memory addressing to match scanhead characteristics or the type of signals being processed (2D or Doppler).
- the rate of gain change may be controlled by the rate at which the coefficients are changed for the multiplier of each normalization stage 30,130.
- the normalized echo signals in each channel are coupled to quadrature bandpass filters (QBPs) in each channel.
- the quadrature bandpass filters provide three functions: band limiting the RF scanline data, producing in-phase and quadrature pairs of scanline data, and decimating the digital sample rate.
- Each QBP comprises two separate filters, one producing in-phase samples (I) and the other producing quadrature samples (Q), with each filter being formed by a plurality of multiplier-accumulators (MACs) implementing an FIR filter.
- MACs multiplier-accumulators
- the product of the echo sample and the weighting coefficient is stored in an accumulator 212 where it may be accumulated with previous products.
- Other MACs receive the echo samples at different phases and likewise accumulate weighted echo samples.
- the accumulated outputs of several MACs can be combined, and the final accumulated product comprises filtered echo data.
- the rate at which accumulated outputs are taken sets the decimation rate of the filter.
- the length of the filter is a product of the decimation rate and the number of MACs used to form the filter, which determine the number of incoming echo samples used to produce the accumulated output signal.
- the filter characteristic is determined by the values of the multiplying coefficients.
- coefficient memories 38,138 which are coupled to apply selected coefficients to the multipliers of the MACs.
- the MACs effectively convolve the received echo signals with sine and cosine representative coefficients, producing output samples which are in a quadrature relationship.
- the coefficients for the MACs which form the I filter implement a sine function, while the coefficients for the Q filter implement a cosine function.
- the coefficients of the active QBPs additionally implement a low pass filter function that is frequency shifted to form, in combination with the sine (for I) and cosine (for Q) functions, a bandpass filter for the quadrature samples.
- QBP 1 in channel 30a is producing I and Q samples of the scanline data in a first, low frequency passband
- QBP 2 in channel 30b is producing I and Q samples of the scanline data in a second, higher frequency passband.
- the echo data in the passband produced by QBP 1 of channel 30a is detected by a detector 40 1 and the detected signals are coupled to one input of a summer 48.
- detection is performed digitally by implementing the algorithm (I 2 +Q 2 ) 1 ⁇ 2 .
- the echo data in the complementary passband produced by QBP 2 of channel 30b is detected by a detector 40 2 and these detected signals are coupled to a second input of the summer 48.
- a gain stage formed by multipliers 44 1 ,44 2 which receive weighting coefficients from coefficient memories 42 1 ,42 2 .
- the purpose of this gain stage is to partition the balance of analog and digital gains in the ultrasound system for optimal system performance. Some of the gains in the echo signal path may be automatically implemented by the ultrasound system, while others, such as manual gain control and TGC gain, may be controlled by the user.
- the system partitions these gains so that the analog gains preceding the ADCs (analog to digital converters) of the beamformer are adjusted optimally for the dynamic input range of the ADCs.
- the digital gain is adjusted to optimize the brightness of the image.
- the two gains together implement gain control changes effected by the user.
- the gain imparted to the scanline signals by the multipliers 44 1 ,44 2 is selected in concert with the gain of the preceding normalization stage 34,134 in the channel.
- the gain of each normalization stage is chosen to prevent the attainment of saturation levels in the QBPs, as may occur when strong signals from contrast agents or harmonic imaging are being received.
- the maximum gain of the normalization stage is controlled, and any reduction imposed by reason of this control is restored by the gain of the succeeding multiplier 44 1 ,44 2 .
- the gain function provided by these multipliers could be performed anywhere along the digital signal processing path. It could be implemented by changing the slope of the compression curves discussed below. It could also, for instance, be performed in conjunction with the gains applied by the normalization stages. This latter implementation, however, would eliminate the ability to effect the saturation control discussed above.
- the present inventors have found implementation of this gain function to be eased when provided after detection, and in the preferred embodiment by use of a multiplier after detection.
- the signals produced by the gain stages 44 1 ,44 2 generally exhibit a greater dynamic range than may be accommodated by the display 50. Consequently, the scanline signals of the multipliers are compressed to a suitable dynamic range by lookup tables.
- the compression is logarithmic, as indicated by log compression processors 46 1 ,46 2 .
- the output of each lookup table is proportional to the log of the signal input value.
- the present inventors have found that the use of log compression to scale the echo signals can affect low level signals near the baseline (black) level of the signal dynamic range by exacerbating the degree and the number of echoes with components at the black level, a manifestation of the destructive interference arising from the speckle effect of the coherent ultrasonic energy.
- the embodiment of FIGURE 10 reduces this problem by producing separate, partially decorrelated versions of the echo signals in the two channels 30a,30b.
- This embodiment partially decorrelates the echo signal versions by separating the echo signal components into two different passbands as shown in FIGURE 13. The two passbands can be completely separated or, as shown in this example, overlapping.
- the lower passband 300a is centered about a frequency of 3.1 MHz
- the higher passband 300b is centered about a frequency of 3.3 MHz, a center frequency separation of only 200 kHz. Even this small degree of separation has been found sufficient to decorrelate the signal components of the two passbands sufficiently such that black level signal dropout in one passband will frequently not align in frequency with its corresponding component in the other passband. Consequently, when these decorrelated replicas of the same echo signal are combined by the summer 48, the signal dropout and speckle artifacts will be markedly reduced. This is especially significant when trying to image fine structures at deep depths in the body, such as the endocardium. A harmonic image of the endocardium is significantly improved by the artifact elimination effects of the embodiment of FIGURE 10.
- the signal gain of the two passbands 300a,300b of FIGURE 13 can be matched to preserve the original signal levels.after summation.
- the lower frequency passband is processed with less dynamic range than the higher frequency passband as shown in FIGURE 13. This has the effect of suppressing the fundamental frequency contributions of the lower frequency passband (which contains more fundamental frequency components than the higher frequency band.) This is accomplished as a component of different compression characteristics in the log compression processors 46 1 ,46 2 , or elsewhere in the channels 30a,30b subsequent to the separation of the broadband signal into separate passbands.
- the processed echo signals at the output of the summer 48 are coupled to a lowpass filter 52.
- This lowpass filter like the QBPs, is formed by combinations of multiplier-accumulators with variable coefficients, arranged to implement an FIR filter, to control the filter characteristic.
- the lowpass filter provides two functions. One is to eliminate sampling frequency and other unwanted high frequency components from the processed echo signals. A second function is to match the scanline data rate to the vertical line density of the display 50, so as to prevent aliasing in the displayed image.
- the FIR filter performs this function by selectively decimating or interpolating the scanline data.
- the filtered echo signals are then stored in an image memory 54.
- the scanlines are scan converted to rectilinear coordinates by a scan converter and greyscale mapping processor 56. If scan conversion has been performed earlier in the process, or is not needed for the image data, the processor 56 may simply convert the echo data to the desired greyscale map by a lookup table process. The image data may then be stored in a final image memory or sent to a video display driver (not shown) for conversion to display signals suitable for driving the display 50.
- the processing described above can be performed in an embodiment which utilizes a single one of the channels 30a, 30b to process the echo data from a scanline twice to alternately produce a line of signals for each of the two passbands in a time-interleaved fashion.
- the use of two parallel channels affords twice the processing speed, enabling harmonic images to be produced in real time and at twice the frame rate of a time multiplexed embodiment.
- Harmonic images produced from high frequency signals can suffer from depth dependent attenuation as the echo signals return from increasing depths in the body.
- Lower frequency fundamental signals may experience less attenuation, and hence in some cases may exhibit better signal to noise ratios at greater depths.
- the embodiment of FIGURE 14 takes advantage of this characteristic by blending fundamental and harmonic image data in one image. It is possible, for instance, to create a normal tissue image of the heart from fundamental frequencies, and overlay the fundamental frequency tissue image with a harmonic tissue image of the heart to better define the endocardial border in the composite image.
- the two images may be formed by alternately switching the digital filter 118 between fundamental and harmonic frequencies to separately assemble fundamental and harmonic images, or by employing the two parallel filters of FIGURE 10 with two passbands, one set to pass fundamental frequencies and the other set to pass harmonic frequencies.
- the filter of channel 30a is set to pass fundamental signal frequencies, and echo signals passed by this channel are stored in a fundamental image memory 182.
- harmonic signal frequencies are passed by channel 30b and stored in a harmonic image memory.
- the fundamental and harmonic images are then blended together by a proportionate combiner 190, under control of a blend control 192.
- the blend control 192 may automatically implement a pre-programmed blending algorithm, or one directed by the user.
- the proportionate combiner 190 may create a blended image which uses only echo data from the harmonic image at shallow depths, then combines echo data from both image at intermediate depths, and finally only uses echo data of the fundamental image at deep depths.
- This combines the reduced clutter benefit of harmonic echo data at shallow depths and the greater penetration and signal to noise ratio of fundamental echoes received from deeper depths, while affording a smooth transition from one type of data to the other at intermediate depths.
- Other combining algorithms are also possible, such as simply switching from one type of data to another at a predetermined depth, or outlining a region of the image to be displayed with one type of data while the remainder of the image is displayed using the other type of data.
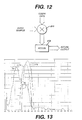
- a third technique for producing blended images is to receive each scanline of the image through a depth-dependent, time varying filter.
- Such filters are well known for improving the signal to noise ratio of received echo signals in the presence of depth dependent attenuation as shown, for instance, in U.S. Pat. 4,016,750.
- the passband 210 of a time varying filter is initially set to pass harmonic frequencies f h , as shown in FIGURE 15, as echo signals begin to be received from shallow depths.
- the passband 210 undergoes a transition to lower frequencies, eventually moving to the fundamental frequencies f f as shown by passband 212 in FIGURE 15.
- each line in the resultant image can comprise harmonic frequencies in the near field (shallow depths), fundamental frequencies in the far field (deepest depths), and a blend of the two in between.
- a fourth technique for producing blended images is to transmit and receive twice along each scanline.
- One transmission is at a fundamental frequency and is followed by reception of echoes at a harmonic frequency.
- Another transmission is at a fundamental frequency, followed by reception at the fundamental frequency.
- the two fundamental transmission frequencies may be the same or, if desired, may be different fundamental frequencies.
- the harmonic and fundamental echoes are then combined along the scanline in the desired proportions to form a blended scanline, and an image field of such scanlines are produced to form a blended image.
- Harmonic tissue images of moving tissue can also be formed by processing the received harmonic tissue echo signals with the processor described in U.S. Patent [application 08/655,394], entitled MEDICAL ULTRASONIC POWER MOTION IMAGING.
- the present invention encompasses an ultrasonic imaging system for imaging the nonlinear response of tissue and fluids of the body to ultrasound by transmitting a fundamental frequency signal, receiving an echo signal from the tissue at a non-fundamental, preferably harmonic, frequency, detecting the non-fundamental frequency echo signals, and forming an image of the tissue and fluids from the non-fundamental frequency echo signals.
- harmonic also refers to harmonic frequencies of higher order than the second harmonic and to subharmonics, as the principles described herein are equally applicable to higher order and subharmonic frequencies.
Abstract
Description
Claims (47)
- An ultrasonic diagnostic imaging system for imaging the harmonic response of structure inside a body, comprising:means for transmitting ultrasonic energy into the body at a fundamental frequency;means, responsive to said transmitted ultrasonic energy, for receiving ultrasonic echo signals at a harmonic of said fundamental frequency; andmeans for producing an ultrasonic image from said harmonic echo signals.
- The ultrasonic diagnostic imaging system of Claim 1, wherein said means for transmitting and said means for receiving comprise an ultrasonic transducer probe.
- The ultrasonic diagnostic imaging system of Claim 2, wherein said ultrasonic transducer probe comprises a plurality of transducer elements for transmitting ultrasonic energy at a fundamental frequency and for receiving ultrasonic echo signals at a harmonic of said fundamental frequency.
- The ultrasonic diagnostic imaging system of Claim 3, wherein said transducer elements exhibit a response characteristic which encompasses both said fundamental frequency and said harmonic of said fundamental frequency.
- The ultrasonic diagnostic imaging system of Claim 1, wherein said means for receiving ultrasonic echo signals at a harmonic of said fundamental frequency comprises a filter defining a passband which includes said harmonic frequency to the exclusion of said fundamental frequency.
- The ultrasonic diagnostic imaging system of Claim 5, wherein said filter comprises a programmable digital filter.
- The ultrasonic diagnostic imaging system of Claim 1. wherein said means for producing an ultrasonic image includes a B mode processor.
- The ultrasonic diagnostic imaging system of Claim 7, wherein said B mode processor includes an amplitude detector for detecting the envelope of said harmonic echo signals.
- The ultrasonic diagnostic imaging system of Claim 1, wherein said structure comprises naturally occurring structure of the body.
- The ultrasonic diagnostic imaging system of Claim 9, wherein said naturally occurring structure comprises tissue and cells of the body.
- A method for producing an ultrasonic image from the harmonic response of the interior of the body comprising the steps of:transmitting ultrasonic energy into the body at a fundamental frequency;receiving ultrasonic echo signals at a harmonic of said fundamental frequency; andprocessing said harmonic echo signals to produce ultrasonic image display signals; anddisplaying said ultrasonic image display signals.
- The method of Claim 11, wherein the steps of transmitting and receiving comprise using an ultrasonic probe with a transducer array to transmit fundamental frequency ultrasonic energy and receive harmonic echo signals.
- The method of Claim 12, wherein the step of using an ultrasonic probe comprises the step of transmitting fundamental frequency ultrasonic energy and receiving harmonic echo signals with the same transducer elements.
- The method of Claim 11, wherein the step of receiving ultrasonic echo signals at a harmonic of said fundamental frequency comprises passing received ultrasonic echo signals through a filter which passes signals at said harmonic of said fundamental frequency to the exclusion of said fundamental frequency.
- The method of Claim 11, wherein said processing step comprises B mode processing said harmonic echo signals.
- The method of Claim 15, wherein said step of B mode processing includes the step of amplitude detecting said harmonic echo signals.
- An ultrasonic diagnostic imaging system for producing an ultrasonic image of the harmonic response of structure inside a body with reduced artifacts, comprising:means for transmitting ultrasonic energy into the body at a fundamental frequency;means, responsive to said transmitted ultrasonic energy, for receiving ultrasonic echo signals at a harmonic of said fundamental frequency;means for processing said harmonic ultrasonic echo signals to generate at least partially decorrelated replicas of said echo signals;means for combining said decorrelated replicas to produce artifact-reduced harmonic echo signals; andmeans for utilizing said artifact-reduced harmonic echo signals to produce an ultrasonic image.
- The ultrasonic diagnostic imaging system of Claim 17, wherein said artifacts comprise dropout artifacts.
- The ultrasonic diagnostic imaging system of Claim 18, wherein said artifacts further comprise speckle artifacts.
- The ultrasonic diagnostic imaging system of Claim 17, wherein said means for processing comprises a bandpass filter for separating components of said harmonic ultrasonic echo signals into two passbands having differing center frequencies.
- The ultrasonic diagnostic imaging system of Claim 20, wherein said means for processing further comprises a detector for detecting harmonic ultrasonic echo signals in each of said passbands.
- The ultrasonic diagnostic imaging system of Claim 21, wherein said means for processing further comprises a log compression processor for log compressing said detected harmonic ultrasonic echo signals.
- The ultrasonic diagnostic imaging system of Claim 17, wherein said processing means comprises two parallel channels, each having an input coupled to receive harmonic ultrasonic echo signals and an output coupled to said combining means,
wherein each of said channels includes a bandpass filter having a filter characteristic different from that of the other channel. - The ultrasonic diagnostic imaging system of Claim 23, wherein said filter characteristic is the peak response frequency of the filter.
- The ultrasonic diagnostic imaging system of Claim 23, wherein said filter characteristic is the center frequency of the filter.
- The ultrasonic diagnostic imaging system of Claim 23, wherein each of said channels further includes a detector.
- The ultrasonic diagnostic imaging system of Claim 26, wherein each of said channels further includes a log compression processor.
- The ultrasonic diagnostic imaging system of Claim 17, wherein said processing means comprises means for separating said harmonic ultrasonic echo signals into two passbands of unequal dynamic range.
- The ultrasonic diagnostic imaging system of Claim 28, wherein said two passbands comprise a low frequency passband and a high frequency passband, and wherein the dynamic range of said low frequency passband is less than that of said high frequency passband.
- The ultrasonic diagnostic imaging system of Claim 29, wherein said processing means further comprises means for mapping the dynamic range of each of said passbands differently.
- A method for producing a harmonic ultrasonic image with reduced artifacts comprising the steps of:transmitting ultrasonic energy at a fundamental frequency;receiving ultrasonic echo signals at a harmonic of said fundamental frequency;processing said harmonic echo signals to produce decorrelated replicas of said signals;combining said decorrelated replicas to produce artifact reduced harmonic echo signals; andutilizing said artifact reduced harmonic echo signals to produce an ultrasonic image.
- The method of Claim 31, wherein the step of processing said harmonic echo signals comprises separating components of said harmonic echo signals into two different passbands.
- The method of Claim 32, wherein the step of processing said harmonic echo signals comprises separating components of said harmonic echo signals into two different passbands of unequal dynamic range.
- The method of Claim 33, wherein the step of processing said harmonic echo signals comprises separating components of said harmonic echo signals into a high frequency passband of a given dynamic range and a low frequency passband of a dynamic range which is less than that of said given dynamic range.
- An ultrasonic diagnostic imaging system for producing a harmonic ultrasonic image of structure inside a body, comprising:means for transmitting ultrasonic energy into the body at a fundamental frequency;means, responsive to said transmitted ultrasonic energy, for receiving ultrasonic echo signals at said fundamental frequency and at a harmonic of said fundamental frequency; andan image processor which processes said received fundamental frequency echo signals and harmonic frequency echo signals to produce an ultrasonic image formed of components of both said fundamental and said harmonic echo signals.
- The ultrasonic diagnostic imaging system of Claim 35, wherein said receiving means includes means for producing separated fundamental and harmonic frequency echo signals.
- The ultrasonic diagnostic imaging system of Claim 36, wherein said receiving means includes a filter for producing fundamental frequency echo signals to the at least partial exclusion of harmonic frequency echo signals, and for producing harmonic frequency echo signals to the at least partial exclusion of fundamental frequency echo signals.
- The ultrasonic diagnostic imaging system of Claim 35, wherein said image processor comprises means for utilizing predominately harmonic echo signals in the near field of said image, and predominately fundamental frequency echo signals in the far field of said image.
- An ultrasonic diagnostic imaging system for imaging the harmonic response of structure inside a body which exhibits depth dependent attenuation of ultrasonic energy, comprising:means for transmitting ultrasonic energy into the body at a fundamental frequency which is equal to or less than 5 MHz;means, responsive to said transmitted ultrasonic energy, for receiving ultrasonic echo signals at a harmonic of said fundamental frequency which is equal to or less than 10 MHz; andmeans for producing an ultrasonic image from said harmonic echo signals.
- The ultrasonic diagnostic imaging system of Claim 39, wherein said transmitting means transmits ultrasonic energy into the body at a fundamental frequency which is equal to or less than 2.5 MHz; and
wherein said receiving means receives ultrasonic echo signals at a harmonic of said fundamental frequency which is equal to or less than 5 MHz. - The ultrasonic diagnostic imaging system of Claim 39, wherein said transmitting means transmits ultrasonic energy into the body at a fundamental frequency which is less than 2 MHz; and
wherein said receiving means receives ultrasonic echo signals at a harmonic of said fundamental frequency which is less than 4 MHz. - The ultrasonic diagnostic imaging system of Claim 39, wherein said receiving means includes a programmable digital filter which is programmed to pass a band of said harmonic echo signals to the exclusion of said fundamental frequency.
- An ultrasonic diagnostic imaging system for imaging the nonlinear response of tissue, comprising:a transmitter for transmitting ultrasonic energy into the body at a fundamental frequency;a receiver, responsive to echoes returned from tissue following said ultrasonic energy transmission, for separating signals representing the nonlinear response of tissue to ultrasound; andan image processor for producing an ultrasonic image from said nonlinear response signals.
- The ultrasonic diagnostic imaging system of Claim 43, wherein said receiver includes a filter circuit for separating signals representing the nonlinear response of tissue to ultrasound.
- The ultrasonic diagnostic imaging system of Claim 43, wherein said receiver includes a signal processor, responsive to the reception of multiple echoes from the same spatial location in tissue, for combining said multiple echo signals to separate signals representing the nonlinear response of tissue to ultrasound.
- The ultrasonic diagnostic imaging system of Claim 43, wherein the the nonlinear response of tissue to ultrasound comprises a second or higher order harmonic of said fundamental frequency.
- The ultrasonic diagnostic imaging system of Claim 43, wherein the the nonlinear response of tissue to ultrasound comprises a subharmonic of said fundamental frequency.
Applications Claiming Priority (2)
| Application Number | Priority Date | Filing Date | Title |
|---|---|---|---|
| US3277196P | 1996-11-26 | 1996-11-26 | |
| US32771P | 1996-11-26 |
Publications (3)
| Publication Number | Publication Date |
|---|---|
| EP0851241A2 true EP0851241A2 (en) | 1998-07-01 |
| EP0851241A3 EP0851241A3 (en) | 1999-06-02 |
| EP0851241B1 EP0851241B1 (en) | 2006-05-24 |
Family
ID=21866722
Family Applications (1)
| Application Number | Title | Priority Date | Filing Date |
|---|---|---|---|
| EP97308965A Expired - Lifetime EP0851241B1 (en) | 1996-11-26 | 1997-11-07 | Ultrasonic diagnostic imaging of response frequency differing from transmit frequency |
Country Status (2)
| Country | Link |
|---|---|
| EP (1) | EP0851241B1 (en) |
| DE (1) | DE69735927T2 (en) |
Cited By (29)
| Publication number | Priority date | Publication date | Assignee | Title |
|---|---|---|---|---|
| US5897500A (en) * | 1997-12-18 | 1999-04-27 | Acuson Corporation | Ultrasonic imaging system and method for displaying composite fundamental and harmonic images |
| US5902242A (en) * | 1998-01-22 | 1999-05-11 | Acuson Corporation | System and method for forming a combined ultrasonic image |
| US5928151A (en) * | 1997-08-22 | 1999-07-27 | Acuson Corporation | Ultrasonic system and method for harmonic imaging in three dimensions |
| US5957852A (en) * | 1998-06-02 | 1999-09-28 | Acuson Corporation | Ultrasonic harmonic imaging system and method |
| US5961464A (en) * | 1998-09-16 | 1999-10-05 | Hewlett-Packard Company | Ultrasound contrast agent detection using spectral analysis from acoustic scan lines |
| EP0947853A2 (en) * | 1998-03-31 | 1999-10-06 | General Electric Company | Method and apparatus for enhanced flow imaging in b-mode ultrasound |
| WO1999058061A1 (en) * | 1998-05-14 | 1999-11-18 | Koninklijke Philips Electronics N.V. | A method for doppler imaging moving tissue and fluids in a body and ultrasonic doppler imaging system for carrying out this method |
| WO2000013038A1 (en) * | 1998-09-02 | 2000-03-09 | General Electric Company | Method and apparatus for improving sidelobe performance of sparse array using harmonic imaging |
| US6039690A (en) * | 1997-06-17 | 2000-03-21 | Acuson Corporation | Method and apparatus for frequency control of an ultrasound system |
| EP0989415A2 (en) * | 1998-09-21 | 2000-03-29 | Matsushita Electric Industrial Co., Ltd. | Ultrasonic diagnostic system |
| US6048316A (en) * | 1998-10-16 | 2000-04-11 | Acuson Corporation | Medical diagnostic ultrasonic imaging system and method for displaying composite fundamental and harmonic images |
| US6108572A (en) * | 1998-03-31 | 2000-08-22 | General Electric Company | Method and apparatus for harmonic imaging using multiple focal zones |
| US6122222A (en) * | 1995-03-02 | 2000-09-19 | Acuson Corporation | Ultrasonic transmit and receive system |
| US6132374A (en) * | 1997-08-01 | 2000-10-17 | Acuson Corporation | Ultrasonic imaging method and system |
| US6206833B1 (en) | 1996-11-08 | 2001-03-27 | Research Corporation Technologiers, Inc. | Finite amplitude distortion-based inhomogeneous pulse echo ultrasonic imaging |
| US6213946B1 (en) | 1998-12-24 | 2001-04-10 | Agilent Technologies, Inc. | Methods and apparatus for speckle reduction by orthogonal pulse compounding in medical ultrasound imaging |
| US6293914B1 (en) | 1998-08-31 | 2001-09-25 | Acuson Corporation | Ultrasonic system and method for measurement of fluid flow |
| WO2001096897A2 (en) * | 2000-06-15 | 2001-12-20 | Ge Medical Systems Global Technology Company Llc | Signal processing method and apparatus and imaging system |
| US6527718B1 (en) | 1999-08-20 | 2003-03-04 | Brian G Connor | Ultrasound system for continuous imaging and delivery of an encapsulated agent |
| US6740039B1 (en) | 1999-08-20 | 2004-05-25 | Koninklijke Philips Electronics N.V. | Methods and apparatus for displaying information relating to delivery and activation of a therapeutic agent using ultrasound energy |
| WO2017062265A1 (en) * | 2015-10-08 | 2017-04-13 | Acist Medical Systems, Inc. | Systems and methods to reduce near-field artifacts |
| US9704240B2 (en) | 2013-10-07 | 2017-07-11 | Acist Medical Systems, Inc. | Signal processing for intravascular imaging |
| US9808222B2 (en) | 2009-10-12 | 2017-11-07 | Acist Medical Systems, Inc. | Intravascular ultrasound system for co-registered imaging |
| US20170330331A1 (en) | 2016-05-16 | 2017-11-16 | Acist Medical Systems, Inc. | Motion-based image segmentation systems and methods |
| US10275881B2 (en) | 2015-12-31 | 2019-04-30 | Val-Chum, Limited Partnership | Semi-automated image segmentation system and method |
| US10653393B2 (en) | 2015-10-08 | 2020-05-19 | Acist Medical Systems, Inc. | Intravascular ultrasound imaging with frequency selective imaging methods and systems |
| US11024034B2 (en) | 2019-07-02 | 2021-06-01 | Acist Medical Systems, Inc. | Image segmentation confidence determination |
| CN113945731A (en) * | 2021-12-06 | 2022-01-18 | 中国科学院大学 | Ultrasonic speed measuring device and ultrasonic speed measuring equipment |
| US11369337B2 (en) | 2015-12-11 | 2022-06-28 | Acist Medical Systems, Inc. | Detection of disturbed blood flow |
Families Citing this family (1)
| Publication number | Priority date | Publication date | Assignee | Title |
|---|---|---|---|---|
| DE102019104679A1 (en) * | 2019-02-25 | 2020-08-27 | GAMPT mbH, Gesellschaft für angewandte medizinische Physik und Technik | Method for shortening the measurement time in elastography |
Citations (3)
| Publication number | Priority date | Publication date | Assignee | Title |
|---|---|---|---|---|
| US4016750A (en) | 1975-11-06 | 1977-04-12 | Stanford Research Institute | Ultrasonic imaging method and apparatus |
| US5474073A (en) | 1994-11-22 | 1995-12-12 | Advanced Technology Laboratories, Inc. | Ultrasonic diagnostic scanning for three dimensional display |
| US5485842A (en) | 1994-11-30 | 1996-01-23 | Advanced Technology Laboratories, Inc. | Ultrasonic diagnostic scan conversion for three dimensional display processing |
Family Cites Families (6)
| Publication number | Priority date | Publication date | Assignee | Title |
|---|---|---|---|---|
| US4561019A (en) * | 1983-05-16 | 1985-12-24 | Riverside Research Institute | Frequency diversity for image enhancement |
| FR2631707B1 (en) * | 1988-05-20 | 1991-11-29 | Labo Electronique Physique | ULTRASONIC ECHOGRAPH WITH CONTROLLABLE PHASE COHERENCE |
| DE3829999A1 (en) * | 1988-09-01 | 1990-03-15 | Schering Ag | ULTRASONIC METHOD AND CIRCUITS THEREOF |
| US5453575A (en) * | 1993-02-01 | 1995-09-26 | Endosonics Corporation | Apparatus and method for detecting blood flow in intravascular ultrasonic imaging |
| US5724976A (en) * | 1994-12-28 | 1998-03-10 | Kabushiki Kaisha Toshiba | Ultrasound imaging preferable to ultrasound contrast echography |
| DE69634714T2 (en) * | 1995-03-31 | 2006-01-19 | Kabushiki Kaisha Toshiba, Kawasaki | Therapeutic ultrasound device |
-
1997
- 1997-11-07 DE DE69735927T patent/DE69735927T2/en not_active Expired - Lifetime
- 1997-11-07 EP EP97308965A patent/EP0851241B1/en not_active Expired - Lifetime
Patent Citations (4)
| Publication number | Priority date | Publication date | Assignee | Title |
|---|---|---|---|---|
| US4016750A (en) | 1975-11-06 | 1977-04-12 | Stanford Research Institute | Ultrasonic imaging method and apparatus |
| US4016750B1 (en) | 1975-11-06 | 1994-04-05 | Stanford Research Inst | Ultrasonic imaging method and apparatus |
| US5474073A (en) | 1994-11-22 | 1995-12-12 | Advanced Technology Laboratories, Inc. | Ultrasonic diagnostic scanning for three dimensional display |
| US5485842A (en) | 1994-11-30 | 1996-01-23 | Advanced Technology Laboratories, Inc. | Ultrasonic diagnostic scan conversion for three dimensional display processing |
Cited By (43)
| Publication number | Priority date | Publication date | Assignee | Title |
|---|---|---|---|---|
| US6122222A (en) * | 1995-03-02 | 2000-09-19 | Acuson Corporation | Ultrasonic transmit and receive system |
| US7811233B2 (en) | 1996-11-08 | 2010-10-12 | Research Corporation Technologies, Inc. | Finite amplitude distortion-based inhomogeneous pulse echo ultrasonic imaging |
| US7513870B2 (en) | 1996-11-08 | 2009-04-07 | Research Corproation Technologies, Inc. | Finite amplitude distortion-based inhomogeneous pulse echo ultrasonic imaging |
| US7104956B1 (en) | 1996-11-08 | 2006-09-12 | Research Corporation Technologies, Inc. | Finite amplitude distortion-based inhomogeneous pulse echo ultrasonic imaging |
| US7004905B2 (en) | 1996-11-08 | 2006-02-28 | Research Corporation Technologies, Inc. | Finite amplitude distortion-based inhomogeneous pulse echo ultrasonic imaging |
| US6206833B1 (en) | 1996-11-08 | 2001-03-27 | Research Corporation Technologiers, Inc. | Finite amplitude distortion-based inhomogeneous pulse echo ultrasonic imaging |
| US6354997B1 (en) | 1997-06-17 | 2002-03-12 | Acuson Corporation | Method and apparatus for frequency control of an ultrasound system |
| US6039690A (en) * | 1997-06-17 | 2000-03-21 | Acuson Corporation | Method and apparatus for frequency control of an ultrasound system |
| US6045505A (en) * | 1997-06-17 | 2000-04-04 | Acuson Corporation | Method and apparatus for frequency control of an ultrasound system |
| US6132374A (en) * | 1997-08-01 | 2000-10-17 | Acuson Corporation | Ultrasonic imaging method and system |
| DE19882575B3 (en) * | 1997-08-01 | 2015-03-05 | Siemens Medical Solutions USA, Inc. (n.d. Ges. d. Staates Delaware) | Ultrasound imaging using the fundamental frequency |
| US5928151A (en) * | 1997-08-22 | 1999-07-27 | Acuson Corporation | Ultrasonic system and method for harmonic imaging in three dimensions |
| US5897500A (en) * | 1997-12-18 | 1999-04-27 | Acuson Corporation | Ultrasonic imaging system and method for displaying composite fundamental and harmonic images |
| US5902242A (en) * | 1998-01-22 | 1999-05-11 | Acuson Corporation | System and method for forming a combined ultrasonic image |
| EP0947853A2 (en) * | 1998-03-31 | 1999-10-06 | General Electric Company | Method and apparatus for enhanced flow imaging in b-mode ultrasound |
| US6108572A (en) * | 1998-03-31 | 2000-08-22 | General Electric Company | Method and apparatus for harmonic imaging using multiple focal zones |
| EP0947853A3 (en) * | 1998-03-31 | 2003-01-08 | General Electric Company | Method and apparatus for enhanced flow imaging in b-mode ultrasound |
| WO1999058061A1 (en) * | 1998-05-14 | 1999-11-18 | Koninklijke Philips Electronics N.V. | A method for doppler imaging moving tissue and fluids in a body and ultrasonic doppler imaging system for carrying out this method |
| US5957852A (en) * | 1998-06-02 | 1999-09-28 | Acuson Corporation | Ultrasonic harmonic imaging system and method |
| US6293914B1 (en) | 1998-08-31 | 2001-09-25 | Acuson Corporation | Ultrasonic system and method for measurement of fluid flow |
| WO2000013038A1 (en) * | 1998-09-02 | 2000-03-09 | General Electric Company | Method and apparatus for improving sidelobe performance of sparse array using harmonic imaging |
| US5961464A (en) * | 1998-09-16 | 1999-10-05 | Hewlett-Packard Company | Ultrasound contrast agent detection using spectral analysis from acoustic scan lines |
| EP0989415A3 (en) * | 1998-09-21 | 2001-05-02 | Matsushita Electric Industrial Co., Ltd. | Ultrasonic diagnostic system |
| EP0989415A2 (en) * | 1998-09-21 | 2000-03-29 | Matsushita Electric Industrial Co., Ltd. | Ultrasonic diagnostic system |
| US6048316A (en) * | 1998-10-16 | 2000-04-11 | Acuson Corporation | Medical diagnostic ultrasonic imaging system and method for displaying composite fundamental and harmonic images |
| US6213946B1 (en) | 1998-12-24 | 2001-04-10 | Agilent Technologies, Inc. | Methods and apparatus for speckle reduction by orthogonal pulse compounding in medical ultrasound imaging |
| US6527718B1 (en) | 1999-08-20 | 2003-03-04 | Brian G Connor | Ultrasound system for continuous imaging and delivery of an encapsulated agent |
| US6740039B1 (en) | 1999-08-20 | 2004-05-25 | Koninklijke Philips Electronics N.V. | Methods and apparatus for displaying information relating to delivery and activation of a therapeutic agent using ultrasound energy |
| WO2001096897A3 (en) * | 2000-06-15 | 2002-04-11 | Ge Med Sys Global Tech Co Llc | Signal processing method and apparatus and imaging system |
| WO2001096897A2 (en) * | 2000-06-15 | 2001-12-20 | Ge Medical Systems Global Technology Company Llc | Signal processing method and apparatus and imaging system |
| US9808222B2 (en) | 2009-10-12 | 2017-11-07 | Acist Medical Systems, Inc. | Intravascular ultrasound system for co-registered imaging |
| US10134132B2 (en) | 2013-10-07 | 2018-11-20 | Acist Medical Systems, Inc. | Signal processing for intravascular imaging |
| US9704240B2 (en) | 2013-10-07 | 2017-07-11 | Acist Medical Systems, Inc. | Signal processing for intravascular imaging |
| WO2017062265A1 (en) * | 2015-10-08 | 2017-04-13 | Acist Medical Systems, Inc. | Systems and methods to reduce near-field artifacts |
| US10653393B2 (en) | 2015-10-08 | 2020-05-19 | Acist Medical Systems, Inc. | Intravascular ultrasound imaging with frequency selective imaging methods and systems |
| US10909661B2 (en) | 2015-10-08 | 2021-02-02 | Acist Medical Systems, Inc. | Systems and methods to reduce near-field artifacts |
| US11369337B2 (en) | 2015-12-11 | 2022-06-28 | Acist Medical Systems, Inc. | Detection of disturbed blood flow |
| US10275881B2 (en) | 2015-12-31 | 2019-04-30 | Val-Chum, Limited Partnership | Semi-automated image segmentation system and method |
| US20170330331A1 (en) | 2016-05-16 | 2017-11-16 | Acist Medical Systems, Inc. | Motion-based image segmentation systems and methods |
| US10489919B2 (en) | 2016-05-16 | 2019-11-26 | Acist Medical Systems, Inc. | Motion-based image segmentation systems and methods |
| US11024034B2 (en) | 2019-07-02 | 2021-06-01 | Acist Medical Systems, Inc. | Image segmentation confidence determination |
| US11763460B2 (en) | 2019-07-02 | 2023-09-19 | Acist Medical Systems, Inc. | Image segmentation confidence determination |
| CN113945731A (en) * | 2021-12-06 | 2022-01-18 | 中国科学院大学 | Ultrasonic speed measuring device and ultrasonic speed measuring equipment |
Also Published As
| Publication number | Publication date |
|---|---|
| EP0851241A3 (en) | 1999-06-02 |
| EP0851241B1 (en) | 2006-05-24 |
| DE69735927T2 (en) | 2007-05-24 |
| DE69735927D1 (en) | 2006-06-29 |
Similar Documents
| Publication | Publication Date | Title |
|---|---|---|
| US5879303A (en) | Ultrasonic diagnostic imaging of response frequency differing from transmit frequency | |
| US6251074B1 (en) | Ultrasonic tissue harmonic imaging | |
| EP0851241B1 (en) | Ultrasonic diagnostic imaging of response frequency differing from transmit frequency | |
| US5908389A (en) | Ultrasonic diagnostic imaging of harmonic frequencies with speckle reduction processing | |
| US6458083B1 (en) | Ultrasonic harmonic imaging with adaptive image formation | |
| US6050942A (en) | Digital scanline signal processor for an ultrasonic diagnostic imaging system | |
| JP4382884B2 (en) | Ultrasonic image processing method and apparatus using harmonics | |
| US6139501A (en) | Coincident tissue and motion ultrasonic diagnostic imaging | |
| US5891038A (en) | Method, apparatus and applications for combining transmit wave functions to obtain synthetic waveform in ultrasonic imaging system | |
| US5961461A (en) | Method and apparatus for adaptive B-mode image enhancement | |
| US6454714B1 (en) | Ultrasonic harmonic flash suppression | |
| JP4547065B2 (en) | Imaging system and operating method thereof | |
| US6491631B2 (en) | Harmonic golay-coded excitation with differential pulsing for diagnostic ultrasound imaging | |
| US6036643A (en) | Ultrasonic harmonic doppler imaging | |
| US10952703B2 (en) | Broadband blended fundamental and harmonic frequency ultrasonic diagnostic imaging | |
| US7011632B2 (en) | Methods and apparatus for ultrasonic compound imaging | |
| US6179781B1 (en) | Medical diagnostic ultrasound method and apparatus for improving doppler processing | |
| JPH1128209A (en) | Ultrasonic imaging method and system | |
| US6210334B1 (en) | Medical diagnostic ultrasound method and apparatus for harmonic detection using doppler processing | |
| WO2002019912A2 (en) | Ultrasonic diagnostic imaging system and method with harmonic spatial compounding | |
| US6733453B2 (en) | Elevation compounding for ultrasound imaging | |
| JP2003299650A (en) | System and method of dynamic automatic sensing of available dynamic range | |
| US20070083109A1 (en) | Adaptive line synthesis for ultrasound | |
| WO2019206709A1 (en) | Ultrasound imaging system for high resolution wideband harmonic imaging | |
| US20050124895A1 (en) | Ultrasonic speckle reduction using nonlinear echo combinations |
Legal Events
| Date | Code | Title | Description |
|---|---|---|---|
| PUAI | Public reference made under article 153(3) epc to a published international application that has entered the european phase |
Free format text: ORIGINAL CODE: 0009012 |
|
| AK | Designated contracting states |
Kind code of ref document: A2 Designated state(s): DE FR GB IT |
|
| AX | Request for extension of the european patent |
Free format text: AL;LT;LV;MK;RO;SI |
|
| PUAL | Search report despatched |
Free format text: ORIGINAL CODE: 0009013 |
|
| AK | Designated contracting states |
Kind code of ref document: A3 Designated state(s): AT BE CH DE DK ES FI FR GB GR IE IT LI LU MC NL PT SE |
|
| AX | Request for extension of the european patent |
Free format text: AL;LT;LV;MK;RO;SI |
|
| 17P | Request for examination filed |
Effective date: 19991202 |
|
| AKX | Designation fees paid |
Free format text: DE FR GB IT |
|
| 17Q | First examination report despatched |
Effective date: 20021127 |
|
| GRAP | Despatch of communication of intention to grant a patent |
Free format text: ORIGINAL CODE: EPIDOSNIGR1 |
|
| GRAS | Grant fee paid |
Free format text: ORIGINAL CODE: EPIDOSNIGR3 |
|
| GRAA | (expected) grant |
Free format text: ORIGINAL CODE: 0009210 |
|
| AK | Designated contracting states |
Kind code of ref document: B1 Designated state(s): DE FR GB IT |
|
| PG25 | Lapsed in a contracting state [announced via postgrant information from national office to epo] |
Ref country code: IT Free format text: LAPSE BECAUSE OF FAILURE TO SUBMIT A TRANSLATION OF THE DESCRIPTION OR TO PAY THE FEE WITHIN THE PRESCRIBED TIME-LIMIT;WARNING: LAPSES OF ITALIAN PATENTS WITH EFFECTIVE DATE BEFORE 2007 MAY HAVE OCCURRED AT ANY TIME BEFORE 2007. THE CORRECT EFFECTIVE DATE MAY BE DIFFERENT FROM THE ONE RECORDED. Effective date: 20060524 |
|
| REG | Reference to a national code |
Ref country code: GB Ref legal event code: FG4D |
|
| REF | Corresponds to: |
Ref document number: 69735927 Country of ref document: DE Date of ref document: 20060629 Kind code of ref document: P |
|
| ET | Fr: translation filed | ||
| PLBE | No opposition filed within time limit |
Free format text: ORIGINAL CODE: 0009261 |
|
| STAA | Information on the status of an ep patent application or granted ep patent |
Free format text: STATUS: NO OPPOSITION FILED WITHIN TIME LIMIT |
|
| 26N | No opposition filed |
Effective date: 20070227 |
|
| PGFP | Annual fee paid to national office [announced via postgrant information from national office to epo] |
Ref country code: IT Payment date: 20081027 Year of fee payment: 12 |
|
| PG25 | Lapsed in a contracting state [announced via postgrant information from national office to epo] |
Ref country code: IT Free format text: LAPSE BECAUSE OF NON-PAYMENT OF DUE FEES Effective date: 20091107 |
|
| REG | Reference to a national code |
Ref country code: FR Ref legal event code: PLFP Year of fee payment: 19 |
|
| REG | Reference to a national code |
Ref country code: FR Ref legal event code: PLFP Year of fee payment: 20 |
|
| PGFP | Annual fee paid to national office [announced via postgrant information from national office to epo] |
Ref country code: FR Payment date: 20161129 Year of fee payment: 20 Ref country code: GB Payment date: 20161130 Year of fee payment: 20 |
|
| REG | Reference to a national code |
Ref country code: DE Ref legal event code: R082 Ref document number: 69735927 Country of ref document: DE Representative=s name: MEISSNER BOLTE PATENTANWAELTE RECHTSANWAELTE P, DE |
|
| PGFP | Annual fee paid to national office [announced via postgrant information from national office to epo] |
Ref country code: DE Payment date: 20170131 Year of fee payment: 20 |
|
| REG | Reference to a national code |
Ref country code: DE Ref legal event code: R071 Ref document number: 69735927 Country of ref document: DE |
|
| REG | Reference to a national code |
Ref country code: GB Ref legal event code: PE20 Expiry date: 20171106 |
|
| PG25 | Lapsed in a contracting state [announced via postgrant information from national office to epo] |
Ref country code: GB Free format text: LAPSE BECAUSE OF EXPIRATION OF PROTECTION Effective date: 20171106 |