EP0718626A2 - Calibrating and testing immunoassays to minimize interferences - Google Patents
Calibrating and testing immunoassays to minimize interferences Download PDFInfo
- Publication number
- EP0718626A2 EP0718626A2 EP95309354A EP95309354A EP0718626A2 EP 0718626 A2 EP0718626 A2 EP 0718626A2 EP 95309354 A EP95309354 A EP 95309354A EP 95309354 A EP95309354 A EP 95309354A EP 0718626 A2 EP0718626 A2 EP 0718626A2
- Authority
- EP
- European Patent Office
- Prior art keywords
- time
- rate
- liquids
- over
- cross
- Prior art date
- Legal status (The legal status is an assumption and is not a legal conclusion. Google has not performed a legal analysis and makes no representation as to the accuracy of the status listed.)
- Granted
Links
Images


Classifications
-
- G—PHYSICS
- G01—MEASURING; TESTING
- G01N—INVESTIGATING OR ANALYSING MATERIALS BY DETERMINING THEIR CHEMICAL OR PHYSICAL PROPERTIES
- G01N33/00—Investigating or analysing materials by specific methods not covered by groups G01N1/00 - G01N31/00
- G01N33/48—Biological material, e.g. blood, urine; Haemocytometers
- G01N33/50—Chemical analysis of biological material, e.g. blood, urine; Testing involving biospecific ligand binding methods; Immunological testing
- G01N33/53—Immunoassay; Biospecific binding assay; Materials therefor
- G01N33/543—Immunoassay; Biospecific binding assay; Materials therefor with an insoluble carrier for immobilising immunochemicals
- G01N33/54366—Apparatus specially adapted for solid-phase testing
- G01N33/54386—Analytical elements
-
- G—PHYSICS
- G01—MEASURING; TESTING
- G01N—INVESTIGATING OR ANALYSING MATERIALS BY DETERMINING THEIR CHEMICAL OR PHYSICAL PROPERTIES
- G01N33/00—Investigating or analysing materials by specific methods not covered by groups G01N1/00 - G01N31/00
- G01N33/48—Biological material, e.g. blood, urine; Haemocytometers
- G01N33/50—Chemical analysis of biological material, e.g. blood, urine; Testing involving biospecific ligand binding methods; Immunological testing
- G01N33/58—Chemical analysis of biological material, e.g. blood, urine; Testing involving biospecific ligand binding methods; Immunological testing involving labelled substances
- G01N33/581—Chemical analysis of biological material, e.g. blood, urine; Testing involving biospecific ligand binding methods; Immunological testing involving labelled substances with enzyme label (including co-enzymes, co-factors, enzyme inhibitors or substrates)
-
- Y—GENERAL TAGGING OF NEW TECHNOLOGICAL DEVELOPMENTS; GENERAL TAGGING OF CROSS-SECTIONAL TECHNOLOGIES SPANNING OVER SEVERAL SECTIONS OF THE IPC; TECHNICAL SUBJECTS COVERED BY FORMER USPC CROSS-REFERENCE ART COLLECTIONS [XRACs] AND DIGESTS
- Y10—TECHNICAL SUBJECTS COVERED BY FORMER USPC
- Y10S—TECHNICAL SUBJECTS COVERED BY FORMER USPC CROSS-REFERENCE ART COLLECTIONS [XRACs] AND DIGESTS
- Y10S435/00—Chemistry: molecular biology and microbiology
- Y10S435/962—Prevention or removal of interfering materials or reactants or other treatment to enhance results, e.g. determining or preventing nonspecific binding
-
- Y—GENERAL TAGGING OF NEW TECHNOLOGICAL DEVELOPMENTS; GENERAL TAGGING OF CROSS-SECTIONAL TECHNOLOGIES SPANNING OVER SEVERAL SECTIONS OF THE IPC; TECHNICAL SUBJECTS COVERED BY FORMER USPC CROSS-REFERENCE ART COLLECTIONS [XRACs] AND DIGESTS
- Y10—TECHNICAL SUBJECTS COVERED BY FORMER USPC
- Y10S—TECHNICAL SUBJECTS COVERED BY FORMER USPC CROSS-REFERENCE ART COLLECTIONS [XRACs] AND DIGESTS
- Y10S435/00—Chemistry: molecular biology and microbiology
- Y10S435/97—Test strip or test slide
-
- Y—GENERAL TAGGING OF NEW TECHNOLOGICAL DEVELOPMENTS; GENERAL TAGGING OF CROSS-SECTIONAL TECHNOLOGIES SPANNING OVER SEVERAL SECTIONS OF THE IPC; TECHNICAL SUBJECTS COVERED BY FORMER USPC CROSS-REFERENCE ART COLLECTIONS [XRACs] AND DIGESTS
- Y10—TECHNICAL SUBJECTS COVERED BY FORMER USPC
- Y10S—TECHNICAL SUBJECTS COVERED BY FORMER USPC CROSS-REFERENCE ART COLLECTIONS [XRACs] AND DIGESTS
- Y10S436/00—Chemistry: analytical and immunological testing
- Y10S436/805—Optical property
-
- Y—GENERAL TAGGING OF NEW TECHNOLOGICAL DEVELOPMENTS; GENERAL TAGGING OF CROSS-SECTIONAL TECHNOLOGIES SPANNING OVER SEVERAL SECTIONS OF THE IPC; TECHNICAL SUBJECTS COVERED BY FORMER USPC CROSS-REFERENCE ART COLLECTIONS [XRACs] AND DIGESTS
- Y10—TECHNICAL SUBJECTS COVERED BY FORMER USPC
- Y10S—TECHNICAL SUBJECTS COVERED BY FORMER USPC CROSS-REFERENCE ART COLLECTIONS [XRACs] AND DIGESTS
- Y10S436/00—Chemistry: analytical and immunological testing
- Y10S436/815—Test for named compound or class of compounds
Definitions
- This invention relates to a method of calibrating and testing immunoassays that are susceptible to interferences, especially hemoglobin, using dried slide test elements.
- Immunoassays are commonly done as rate assays, that is, they are measured as a rate of change over time, for example, the rate of increase or decrease in density of a dye.
- the dye chemistry can be, for example, one that relies upon an enzyme to catalyze a leuco dye to change into a colored dye.
- a class of enzymes that is frequently used for this purpose is oxidases, preferably peroxidase, or "POD". Most preferably, the peroxidase is horseradish peroxidase, hereinafter "HRP".
- Immunoassays involve the measurement of limited amounts of POD, unlike other assays which can use excess amounts of POD. (Excess amounts of course are relatively insensitive to interferents that imitate or react with the POD.)
- An immunoassay is usually either “competitive” or “sandwich”.
- “competitive” assays a labeled analog of the target analyte to be determined is placed in competition with the analyte for a fixed amount of an appropriate, immobilized antibody which can react with either the target analyte or a target analyte analog.
- the label on the analog can be appropriately detected in either its “free” or its complexed (that is, reacted) form. Signal level then will tell the user how much target analyte is in the sample being tested.
- the target analyte is contacted with two or more receptor molecules, for example, antibodies, which bind to the target analyte at different epitopic sites.
- receptor molecules for example, antibodies
- One receptor molecule is typically appropriately labeled and the other is either immobilized on a solid substrate, or is capable of being immobilized thereon.
- the amount of target analyte is directly proportional to the amount of bound complex among the target analyte and the two receptors.
- hemoglobin interference we have discovered some properties of the hemoglobin interference that have allowed us to overcome the above-noted problems. That is, we have discovered a) that the rate of impact of interferents such as hemoglobin at a fixed concentration, that is, the bias effect, varies depending on the concentration of the analyte; and b) that the rate of change of the signal produced by a selected amount of target analyte and a fixed amount of interferent, for example, hemoglobin, say 250 mg/dl, decreases over time faster than the rate of change of signal produced by that same amount of target analyte with zero amount of interferent (hemoglobin).
- the method comprises the steps of:
- a calibration method of reducing hemoglobin bias in calibration values for testing for a target analyte in an immunoassay that uses horseradish peroxidase and a substrate to produce a dye density that changes over time.
- the method comprises the steps of:
- a method for testing patient body fluids for a target analyte to reduce any hemoglobin bias in an immunoassay that uses horse radish peroxidase and a leuco dye to produce a dye density that changes over time, the method comprising the steps of
- rate immunoassays can be conducted using a POD detection scheme, while at the same time reducing the bias that is normally created when certain interferents are present.
- a cross-over time is ascertained for a first liquid having x amount of the target analyte and a non-negligible amount of hemoglobin, and a second liquid having said x amount of the target analyte and zero amount of hemoglobin.
- the invention is useful for interferents other than hemoglobin, or if the second liquid has a negligible amount of hemoglobin, which as used herein means from zero to 50 mg/dl, and where the two liquids never reach a time in which their rates are exactly equal.
- cross-over means, when the rates of change of the slide test elements bearing the respective two liquids are either substantially the same, or, when they first reach a steady-state minimum difference having minimized bias - a condition that can occur especially for very low levels of target analyte.
- the preferred embodiments feature assays in which the rate of change of dye density for a given immunoassay decreases over time as shown for particular preferred analytes, and wherein the optimal read time values are shown as a continuous polynomial curve determined by using more than two, that is, three cross-over points from three calibrator liquids of a known hemoglobin concentration.
- the invention is useful for sandwich and competitive immunoassays regardless of the analyte of choice, and regardless of whether the optimal read times are a graphic plot or look-up table, calculated as a polynomial function or a linear function from more than two cross-over points of calibrators, or only two, respectively; so long as the immunoassay chemistry uses POD to produce the dye density.
- interferent biases can be reduced in a similar manner, if the interferent, hereinafter "interferent of choice", produces a cross-over point in time as herein defined, of the measured rates of change, when tested with both negligible and non-negligible amounts of the interferent, respectively.
- interferents include: reducing agents such as gentisic acid, ascorbic acid, dipyrone, and so forth
- the preferred slide test elements for assaying phenytoin and digoxin comprise the following:
- Elements for the detection of digoxin were prepared using conventional procedures and the general structure of slide test elements available under the trademark "Ektachem”® from the Clinical Diagnostics Division, formerly of Eastman Kodak Co., but having the following coating formulations.
- the gravure and receptor coatings detailed below diffused into the porous spreading coating to form separate zones near the boundaries of the dried porous spreading layer.
- Such elements were prepared similarly to those described above for digoxin except that they had reagents suitable for detection of diphenylhydantoin.
- the elements were coated using conventional procedures and equipment and had the following basic coating compositions and structure:
- curves 10A' and 20A' each have a definite amount of hemoglobin interferent present, for example, 250 mg/dL, whereas 10B' and 20B' have none.
- the curves 20A' and 20B' represent 2x the amount of analyte of curves 10A' and 10B'.
- This cross-over phenomenon of Fig. 2 represents, of course, the point of minimum hemoglobin bias, and the optimal point in time when the unknown sample should be read for its rate, for this particular concentration of target analyte, for example, 1X amount for curves 10A' and 10B'.
- the rest of the method of the invention is a procedure so that an "optimal" time of reading is selected that is close to, if not exactly the same as, the cross-over time for that exact amount of target analyte. Hence, the amount of bias from hemoglobin is minimized.
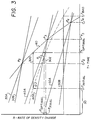
- Fig. 3 the calibration portion of the invention is illustrated therein. That is, calibration is conventionally achieved by taking a set of slide test elements that are substantially identical, all for the same target immuno-analyte, for example digoxin, and testing on an analyzer one, two or three calibrator fluids of varying concentration (C1, C2, and C3) of the target immuno-analyte, to determine their rate of change over time using some of said set of test elements. Such testing produces, Fig. 3, curves 30B, 40B, and 50B, respectively. These liquids however have negligible, for example, zero, amounts of hemoglobin.
- the calibration procedure adds to this, the steps of ascertaining the similar rate curves 30A, 40A, and 50A, using other of said set of slide test elements on the same analyzer, using however calibration liquids having concentrations C1, C2, or C3 , , respectively, and a non-negligible amount of hemoglobin, for example, 250 mg/dl.
- the non-negligible amount of hemoglobin is the same for all of these additional calibration liquids, but it need not be.
- the next step is to determine the points in time when each pair of curves reaches its cross-over time.
- those are, respectively, times T2, T3, and T4, when the rates of change within a pair are substantially equal (shown as points P2, P3, and P4).
- These times are each the optimal read time for that particular concentration of immuno-analyte in sample liquids, if such concentrations can be known or approximated. That is, the invention can be practiced by picking only one of these cross-over points for the corresponding concentration of analyte, regardless of whatever read times are used at other analyte concentrations.
- the curve shape for curve 60 it represents the assigned cross-over points in time from which a table of optimal read times can be constructed for subsequent testing of patient samples of unknown concentration and hemoglobin content.
- test procedure on such a patient sample is as follows, using such curve 60, Fig. 4.
- the patient sample is deposited and the rate of change detected in the same kind of analyzer used for the calibration.
- An extensive set of data points, represented by curve S (for "sample"), is ascertained, from at least time T initial to a time T final .
- T initial which is early in the read times (for example, averaged over the first 30 sec.)
- R initial the corresponding rate of change for that sample is ascertained.
- T optimal read is selected from curve 60, arrow 100. That optimal read time is then used, on curve S, to ascertain (arrow 200) the "final" rate of change at that optimal time, that is then conventionally converted (from a calibration table) into a concentration.
- T initial can be taken during the time periods covered by curve 60, provided that said same T initial is used throughout all assays.
- R optimal is the value corresponding to the actual cross-over point P s , where curve S crosses over curve 40B. Nevertheless, this is a value for R final that is much closer to R optimal than most other readings that could be selected from curve S', for example, at a time T bad .
- the optimal read time curve 60 is vertical or substantially vertical for a given target immunoanalyte, only one pair of curves needs to be ascertained to identify a single cross-over point for use with all assays of that analyte.
- This condition is shown in Fig. 5, which also shows a cross-over condition where the paired curves never are equal, but establish a steady state minimum difference ⁇ R.
- a plot of calibration liquids having C x concentration of analyte and 200 or 5 mg/dl hemoglobin produces, respectively, curves 70A and 70B that have a cross-over point on time T1, where the rates are substantially equal.
- curves 80A and 80B result (curve 80A being for a liquid with non-negligible amounts of 180 mg/dl of hemoglobin).
- the cross-over point in time is then ascertained to be time T2, where a steady-state minimum difference to ⁇ R is first obtained.
- T2 time
- T1 or T2 any one of the two read times T1 or T2 is selected to be used thereafter as the optimal read time for all testing of patient sample liquids for this particular immunoassay.
- the other time points on curve 60' are then ignored.
- Such a process of selecting only one optimal read time is best used, of course, when curve 60' is exactly vertical. However, it is a useful approximation if T2-T1 varies no more than 10 seconds over the normal concentration range of the target immuno-analyte.
- the calibration liquids had the following formulas:
- PVP polyvinylpyrrolidone
- Fig. 6 illustrates the calibration plot and the curve 60'' of the optimal read time achieved by the three pairs of calibration liquids, shown as curves 30A'', 30B''; 40A'', 40B''; and 50A'', 50B''. That is, curves 30A'' and 30B'' are for Liquid 1 the contents of which are described above, and curves 40A'', 40B'' are for Liquid 2 and curves 50A'', 50B'' for Liquid 3.
- T opt 2.41-20.625(rate init.)
- rate init the reading obtained early on as an initial value, for example, at 0.5 min.
- the bias in Table 1 comes from the fact that a time of reading of 1 minute is too late for the liquid 1 case, and too early for liquids 2 and 3, regarding their cross-over times, something that would, of course be unknown if they were samples instead of calibrators.
- the phenytoin assays can be calibrated and assayed in the manner described in the next example, although it clearly is not optimal since the ends of the range are not optimized.
- curves 30A''' and 30B''' represent Liquid 1 prepared as described for Example 1, except that the analyte was 1 ng/mL of digoxin.
- Curves 40A''' and 40B''' represent Liquid 2 prepared as described for Example 1, except that the analyte was 2 ng/mL of digoxin.
- Curves 50A''' and 50B''' represent Liquid 3, prepared as described for Example 1, except that the analyte was 4 ng/mL of digoxin.
- the "A" curves are the respective liquids with 250 mg/dL of hemoglobin present, and the "B" curves have zero amounts of hemoglobin present.
Abstract
- a) calibrating an immunoassay of a target analyte by ascertaining the time at which the rate of change in density produced by a first set of the test elements for the target analyte on at least one liquid having a known amount of interferent of choice and a known amount of target analyte, crosses over or minimizes the difference compared to the rate of change in density produced by a second set of test elements substantially identical to the first set of test elements, on a liquid having the known amount of target analyte but a negligible amount of interferent of choice, and
- b) conducting an assay of a patient sample of unknown amount of the target analyte by reading the rate of change in density in a third set of the test elements substantially identical to the first and second sets, caused by the sample, at a time corresponding to the cross-over time ascertained in step a).
Description
- This invention relates to a method of calibrating and testing immunoassays that are susceptible to interferences, especially hemoglobin, using dried slide test elements.
- Immunoassays are commonly done as rate assays, that is, they are measured as a rate of change over time, for example, the rate of increase or decrease in density of a dye. The dye chemistry can be, for example, one that relies upon an enzyme to catalyze a leuco dye to change into a colored dye. A class of enzymes that is frequently used for this purpose is oxidases, preferably peroxidase, or "POD". Most preferably, the peroxidase is horseradish peroxidase, hereinafter "HRP".
- Immunoassays involve the measurement of limited amounts of POD, unlike other assays which can use excess amounts of POD. (Excess amounts of course are relatively insensitive to interferents that imitate or react with the POD.) An immunoassay is usually either "competitive" or "sandwich". In "competitive" assays, a labeled analog of the target analyte to be determined is placed in competition with the analyte for a fixed amount of an appropriate, immobilized antibody which can react with either the target analyte or a target analyte analog. The label on the analog can be appropriately detected in either its "free" or its complexed (that is, reacted) form. Signal level then will tell the user how much target analyte is in the sample being tested.
- In the alternative immunoassay format of a "sandwich" immunoassay or immunometric assay, the target analyte is contacted with two or more receptor molecules, for example, antibodies, which bind to the target analyte at different epitopic sites. One receptor molecule is typically appropriately labeled and the other is either immobilized on a solid substrate, or is capable of being immobilized thereon. The amount of target analyte is directly proportional to the amount of bound complex among the target analyte and the two receptors.
- In either of these assays, if HRP is used, it is part of the "label". Hence, immunoassays cannot rely on the presence of excessive amounts of HRP to overcome changes due to the presence of interferents.
- It has been known in the art that such peroxidase chemistry, when used in immunoassays, is interfered with by substances such as hemoglobin. That is, the presence of any hemoglobin will cause more or less of a bias. In liquid immunoassays, this is corrected by diluting, usually. Such correction by dilution is not available, however, when using slide test elements. The reason is that it complicates the procedure, adds errors, and further lowers an already low concentration of certain analytes. Since hemoglobin is often present in blood samples in unknown amounts, it has been a long-felt problem prior to this invention to somehow correct for the unpredictable bias created by hemoglobin in such immunoassays. Certainly a correction could be done if the amount of hemoglobin present (if any) were first ascertained, but that is a step most laboratories do not wish to do prior to running the immunoassay.
- We have discovered some properties of the hemoglobin interference that have allowed us to overcome the above-noted problems. That is, we have discovered a) that the rate of impact of interferents such as hemoglobin at a fixed concentration, that is, the bias effect, varies depending on the concentration of the analyte; and b) that the rate of change of the signal produced by a selected amount of target analyte and a fixed amount of interferent, for example, hemoglobin, say 250 mg/dl, decreases over time faster than the rate of change of signal produced by that same amount of target analyte with zero amount of interferent (hemoglobin). This last means that we have discovered there is a cross-over point in time, defined hereinafter, for any level of any immunoassay analyte, at which the hemoglobin bias becomes zero or a steady-state minimum. It is particularly the latter cross-over time that has led to the invention.
- More specifically, in accord with one aspect of the invention, there is provided a method of reducing bias caused by an interferent of choice when conducting immunoassays using a dried test element containing detection reagents comprising peroxidase and a substrate that produce a detectable density change at various rates, wherein the peroxidase is present in a predetermined, limited amount. The method comprises the steps of:
- a) calibrating an immunoassay of a target analyte by ascertaining the time at which the rate of change in density produced by a first set of said test elements for said target analyte contacted with at least one liquid having a known amount of interferent of choice and a known amount of target analyte, crosses over or minimizes at a cross-over time, the rate of change in density produced by a second set of test elements substantially identical to said first set of test elements, contacted with a liquid having said known amount of target analyte but a negligible amount of interferent of choice, and
- b) conducting an assay of a patient sample of unknown amount of said target analyte by reading the rate of change in a selected element of said test elements of said first or second sets, caused by said sample contacting said selected element, at a time corresponding to said cross-over time ascertained in step a).
- In accord with another aspect, there is provided a calibration method of reducing hemoglobin bias in calibration values for testing for a target analyte in an immunoassay that uses horseradish peroxidase and a substrate to produce a dye density that changes over time. The method comprises the steps of:
- a) ascertaining for a plurality of times using some of a plurality of slide test elements of identical composition, the rate of change in the dye density produced at least by two liquids having two different preselected known amounts of the target analyte and no amounts of hemoglobin;
- b) ascertaining for the same plurality of times using additional members of the slide test elements of identical composition, the rate of change in the dye density produced by at least two liquids which have added to them, a preselected non-negligible amount of hemoglobin that is the same for both of the at least two liquids;
- c) determining the points in time when the rate of change of the at least two liquids containing the non-negligible amounts of hemoglobin, cross-over or minimize the rate of change for the corresponding two liquids lacking however any hemoglobin, thereby producing cross-over times having a minimized bias; and
- d) selecting said cross-over time for one of the at least two liquids as the optimal read time for subsequent sample testing having an initial rate of change corresponding to said one of said at least two liquids.
- In accord with still another aspect of the invention, there is provided a method for testing patient body fluids for a target analyte to reduce any hemoglobin bias, in an immunoassay that uses horse radish peroxidase and a leuco dye to produce a dye density that changes over time, the method comprising the steps of
- a) ascertaining the rate of change in density over time of a particular patient body fluid of an unknown amount of the analyte, in an analyzer having at least one assigned cross-over point in time as an optimal read time calculated in accordance with the calibration method noted above;
- b) selecting a fixed point in time prior to any of the assigned cross-over times as an initial read time;
- c) ascertaining from the point in time selected in step b), the initial rate for that time from the values ascertained in step a);
- d) ascertaining for the initial rate ascertained from step c) an optimal cross-over read time that corresponds to the initial rate; and
- e) ascertaining from the rates determined in step a) the rate of change of the patient sample corresponding to the optimal read time.
- Accordingly, it is an advantageous feature of the invention that rate immunoassays can be conducted using a POD detection scheme, while at the same time reducing the bias that is normally created when certain interferents are present.
- Other advantageous features will become apparent from the Detailed Description which follows, when read in light of the attached drawings.
- Fig. 1 is a plot of rate of density change versus time as was known in the prior art for 1X and 2X amounts of a particular immuno-analyte, with say 250 mg/dl hemoglobin and with no hemoglobin, respectively;
- Fig. 2 is a similar plot except that it illustrates our discovery that indeed, the curves for zero amount of hemoglobin and a fixed amount, say 250 mg/dl hemoglobin, at any particular concentration of immuno-analyte, do have a cross-over time Ti that is different at different concentration values of the immuno-analyte;
- Fig. 3 is a plot similar to that of Fig. 2 except it illustrates the calibration method of the invention wherein calibrator fluids C₁, C₂, and C₃ are selected each with a known but different level of concentration of immuno-analyte;
- Fig. 4 is a plot similar to that of Fig. 3, but illustrating how the calibration plot obtained in Fig. 3 is used to test for an unknown concentration of a patient sample using the assigned optimal read time curve of Fig. 3.;
- Fig. 5 is a plot similar to that of Fig. 3, but illustrating an alternate embodiment; and
- Figs 6 and 7 are plots similar to that of Fig. 3, but illustrating actual working examples for phenytoin and digoxin, respectively.
- The discussion hereinafter is addressed to certain preferred embodiments, wherein a cross-over time is ascertained for a first liquid having x amount of the target analyte and a non-negligible amount of hemoglobin, and a second liquid having said x amount of the target analyte and zero amount of hemoglobin. In addition, the invention is useful for interferents other than hemoglobin, or if the second liquid has a negligible amount of hemoglobin, which as used herein means from zero to 50 mg/dl, and where the two liquids never reach a time in which their rates are exactly equal. Hence, as used herein, "cross-over" means, when the rates of change of the slide test elements bearing the respective two liquids are either substantially the same, or, when they first reach a steady-state minimum difference having minimized bias - a condition that can occur especially for very low levels of target analyte.
- Additionally, the preferred embodiments feature assays in which the rate of change of dye density for a given immunoassay decreases over time as shown for particular preferred analytes, and wherein the optimal read time values are shown as a continuous polynomial curve determined by using more than two, that is, three cross-over points from three calibrator liquids of a known hemoglobin concentration. In addition, the invention is useful for sandwich and competitive immunoassays regardless of the analyte of choice, and regardless of whether the optimal read times are a graphic plot or look-up table, calculated as a polynomial function or a linear function from more than two cross-over points of calibrators, or only two, respectively; so long as the immunoassay chemistry uses POD to produce the dye density.
- Thus, the invention is described for the particular preferred immuno-analytes, that is, phenytoin and digoxin, corrected for hemoglobin bias. Other interferent biases can be reduced in a similar manner, if the interferent, hereinafter "interferent of choice", produces a cross-over point in time as herein defined, of the measured rates of change, when tested with both negligible and non-negligible amounts of the interferent, respectively. Other examples of such interferents include: reducing agents such as gentisic acid, ascorbic acid, dipyrone, and so forth
The preferred slide test elements for assaying phenytoin and digoxin comprise the following: - Elements for the detection of digoxin were prepared using conventional procedures and the general structure of slide test elements available under the trademark "Ektachem"® from the Clinical Diagnostics Division, formerly of Eastman Kodak Co., but having the following coating formulations. The gravure and receptor coatings detailed below diffused into the porous spreading coating to form separate zones near the boundaries of the dried porous spreading layer.


- Such elements were prepared similarly to those described above for digoxin except that they had reagents suitable for detection of diphenylhydantoin. The elements were coated using conventional procedures and equipment and had the following basic coating compositions and structure:


- Referring now to Fig. 1, the prior art (mostly solution assays) was aware of the "positive" bias created by the presence of the hemoglobin interferent, as shown by curve 10A and curve 10B, or
curve 20A compared tocurve 20B. (Curve 20A differs from 10A only in that 20A is the plot of the rate for an analyte that is present in 2X the amount present for curve 10A.) However, the curves had been tracked only as far as Time
- We have discovered that, for certain peroxidase-driven target immunoassays using dried slide test elements, such as for digoxin and phenytoin, if the rate is allowed to run for a time T>T₁, the paired curves will be found to converge to a cross-over time T₂ or T₃, where T₂ and T₃>T₁. E.g., Fig. 2, curve 10A' substantially equals the rate of curve 10B' at time T₂, and
curve 20A' substantially equals the rate ofcurve 20B' at time T₃. (In these cases, the "cross-over" is a point of substantial equality, but as noted herein, it can be a point in time of steady-state minimal difference.) As in the case of Fig. 1, curves 10A' and 20A' each have a definite amount of hemoglobin interferent present, for example, 250 mg/dL, whereas 10B' and 20B' have none. Thecurves 20A' and 20B' represent 2x the amount of analyte of curves 10A' and 10B'. - This cross-over phenomenon of Fig. 2 represents, of course, the point of minimum hemoglobin bias, and the optimal point in time when the unknown sample should be read for its rate, for this particular concentration of target analyte, for example, 1X amount for curves 10A' and 10B'. Of course, one does not know in advance what the analyte concentration is, nor the amount of hemoglobin, so the rest of the method of the invention is a procedure so that an "optimal" time of reading is selected that is close to, if not exactly the same as, the cross-over time for that exact amount of target analyte. Hence, the amount of bias from hemoglobin is minimized.
- Referring next to Fig. 3, the calibration portion of the invention is illustrated therein. That is, calibration is conventionally achieved by taking a set of slide test elements that are substantially identical, all for the same target immuno-analyte, for example digoxin, and testing on an analyzer one, two or three calibrator fluids of varying concentration (C₁, C₂, and C₃) of the target immuno-analyte, to determine their rate of change over time using some of said set of test elements. Such testing produces, Fig. 3, curves 30B, 40B, and 50B, respectively. These liquids however have negligible, for example, zero, amounts of hemoglobin.
- In accord with one aspect of the invention, the calibration procedure adds to this, the steps of ascertaining the
similar rate curves plot 60 of "optimal" cross-over points, discussed hereinafter, is not in this case vertical, it is preferred that at least two pairs of rate curves be ascertained, that is bothpairs curve 60 is not linear. (A linear curve can be adequately defined by only two pairs of such curves.) - Having ascertained the data points for
curves - Most preferably, instead of working with only two or three tested cross-over points, an extrapolation is made between and beyond those points, for example, even at earlier times, to obtain
curve 60, Fig. 3. That is, the next step is to calculate the corresponding cross-over points in time for analyte concentrations other than C₁, C₂, or C₃. This of course is done by interpolating the other cross-over points, by best-fitting a curve to points P₂, P₃, and P₄. Generically, such a curve is characterized by a polynomial of the formula

curve 60, it represents the assigned cross-over points in time from which a table of optimal read times can be constructed for subsequent testing of patient samples of unknown concentration and hemoglobin content. - In accord with another aspect of the invention, the test procedure on such a patient sample is as follows, using
such curve 60, Fig. 4. - Using another one of said set of identical slide test elements, the patient sample is deposited and the rate of change detected in the same kind of analyzer used for the calibration. An extensive set of data points, represented by curve S (for "sample"), is ascertained, from at least time Tinitial to a time Tfinal. At a fixed time Tinitial, which is early in the read times (for example, averaged over the first 30 sec.), the corresponding rate of change Rinitial for that sample is ascertained. From that value of Rinitial, the corresponding optimal read time Toptimal read is selected from
curve 60, arrow 100. That optimal read time is then used, on curve S, to ascertain (arrow 200) the "final" rate of change at that optimal time, that is then conventionally converted (from a calibration table) into a concentration. - Alternatively, Tinitial can be taken during the time periods covered by
curve 60, provided that said same Tinitial is used throughout all assays. - That this indeed is a read time that minimizes the bias from hemoglobin can be seen from the hypothetical example plotted as dotted curve S' on Fig. 3. Assume that, in fact, its analyte concentration is C₂, a fair assumption given its location close to
curve 40B. At time Tinitial, an initial rate is ascertained which isarrow 300. This produces oncurve 60, an optimal read time Toptimal, which then produces from curve S', a final rate Rfinal as shown,arrow 302. It turns out, however, that this is NOT the final rate that has zero hemoglobin bias, since that zero bias final rate reading is Roptimal, just above Rfinal. Roptimal, of course, is the value corresponding to the actual cross-over point Ps, where curve S crosses overcurve 40B. Nevertheless, this is a value for Rfinal that is much closer to Roptimal than most other readings that could be selected from curve S', for example, at a time Tbad. - If the optimal
read time curve 60 is vertical or substantially vertical for a given target immunoanalyte, only one pair of curves needs to be ascertained to identify a single cross-over point for use with all assays of that analyte. This condition is shown in Fig. 5, which also shows a cross-over condition where the paired curves never are equal, but establish a steady state minimum difference ΔR. Thus, in this hypothetical case, a plot of calibration liquids having Cx concentration of analyte and 200 or 5 mg/dl hemoglobin, produces, respectively, curves 70A and 70B that have a cross-over point on time T₁, where the rates are substantially equal. When another pair of calibration liquids at five time Cx are plotted,curves 80A and 80B result (curve 80A being for a liquid with non-negligible amounts of 180 mg/dl of hemoglobin). The cross-over point in time is then ascertained to be time T₂, where a steady-state minimum difference to ΔR is first obtained. This produces a curve (straight line) 60' of optimal read times that is approximately vertical. Hence, any one of the two read times T₁ or T₂ is selected to be used thereafter as the optimal read time for all testing of patient sample liquids for this particular immunoassay. (The other time points on curve 60' are then ignored.) Such a process of selecting only one optimal read time is best used, of course, when curve 60' is exactly vertical. However, it is a useful approximation if T₂-T₁ varies no more than 10 seconds over the normal concentration range of the target immuno-analyte. - The following examples used the digoxin and phenytoin slide test elements set forth above, tested on an "Ektachem E-250" analyzer available from Clinical Diagnostics Division, formerly of Eastman Kodak Co., using calibration liquids that were spiked with the noted amount of analyte and with zero, or the noted amounts of hemoglobin.
- In this example, the calibration liquids had the following formulas:
- To a 1% polyvinylpyrrolidone (PVP) matrix, was added 2.0 µg/L of phenytoin, and this was split into 2 parts one of which had no amount of hemoglobin, and the other which had 250 mg/dl of hemoglobin, to form a pair of liquids.
- To a 1% PVP matrix, 12.0 µg/mL of phenytoin, was added. This was split into two parts, to which was added, in one part, no amount of hemoglobin, and to the other part, 250 mg/dl of hemoglobin, to form a pair of liquids.
- To a 1% PVP matrix, 40 µg/mL of phenytoin was added. This was split into two parts, to which was added, in one part, no amount of hemoglobin, and to the other part, 250 mg/dl of hemoglobin, to form a pair of liquids.
- Fig. 6 illustrates the calibration plot and the curve 60'' of the optimal read time achieved by the three pairs of calibration liquids, shown as
curves 30A'', 30B''; 40A'', 40B''; and 50A'', 50B''. That is, curves 30A'' and 30B'' are for Liquid 1 the contents of which are described above, and curves 40A'', 40B'' are for Liquid 2 and curves 50A'', 50B'' for Liquid 3. In each set, the A curves represent the appropriate Liquid with 250 mg/dL of hemoglobin present, and the B curves represent the appropriate liquid with ZERO amounts of hemoglobin present. (The reaction start time was 0.3 minutes prior to Time=0 sec. in Figs. 6 and 7.) The amount of phenytoin added to each calibration liquid is noted on the plot. Curve 60'' was then used as the optimal read time value, when detecting an initial rate Ri, say Ri=0.07 at time 0.5 minutes. This then produced a Toptimal of about 0.88 minutes, which is then used to read off curve S'' for an actual sample, a Rfinal rate reading of 0.063. This Rfinal is converted to a calculated phenytoin concentration of about 7.9 µg/mL. - (Curve 60'' can be expressed mathematically as follows:
A
- The utility of Fig. 6 can also be demonstrated using just the calibrators. Consider first the results if all readings were arbitrarily made, as is conventional, at a fixed time, say 1 minute. In that case, the results are as follows:
Table 1 Drug Level Rate @1.0 min. (Dt/min.) Hemoglobin Level (mg/dL) Prediction (µg/mL) Bias (µg/mL) Liquid 1 0.080 0 5.00 -- Liquid 1 0.076 250 5.45 0.45 Liquid 2 0.031 0 20.0 -- Liquid 2 0.033 250 17.6 -2.4 Liquid 3 0.018 0 40.0 -- Liquid 3 0.023 250 29.1 -10.9 - The bias in Table 1 comes from the fact that a time of reading of 1 minute is too late for the liquid 1 case, and too early for liquids 2 and 3, regarding their cross-over times, something that would, of course be unknown if they were samples instead of calibrators.
- If, however, equation A above is used, and the very first data points of the curves are used as the "rateinit", the results become those shown in Table 2, with much improved biases:
Table 2 Drug Level Initial Rate Topt Rateopt Hgb Prediction (µg/mL) Bias (µg/mL) Liquid 1 0.098 0.39 0.094 0 5.00 -- Liquid 1 0.100 0.35 0.095 250 4.94 -0.06 Liquid 2 0.036 1.67 0.027 0 20.0 -- Liquid 2 0.042 1.55 0.028 250 19.2 -0.8 Liquid 3 0.022 1.96 0.015 0 40.0 -- Liquid 3 0.029 1.81 0.017 250 34.9 -5.1 - Alternatively, the phenytoin assays can be calibrated and assayed in the manner described in the next example, although it clearly is not optimal since the ends of the range are not optimized.
- Similar calibration curves, Fig. 7, were created in a manner similar to that of Example 1, using digoxin test elements and calibration liquids spiked with digoxin.
- Thus, curves 30A''' and 30B''' represent Liquid 1 prepared as described for Example 1, except that the analyte was 1 ng/mL of digoxin.
Curves 40A''' and 40B''' represent Liquid 2 prepared as described for Example 1, except that the analyte was 2 ng/mL of digoxin.Curves 50A''' and 50B''' represent Liquid 3, prepared as described for Example 1, except that the analyte was 4 ng/mL of digoxin. As in the case of Fig. 6, the "A" curves are the respective liquids with 250 mg/dL of hemoglobin present, and the "B" curves have zero amounts of hemoglobin present. - An optimal read time curve 60''' was plotted as shown. This curve is sufficiently vertical as to justify the selection of a single optimal point in time for all assays of digoxin. Hence, tests were run successfully using Toptimal of 0.7 minutes measured from the start of the reaction, for all concentrations of digoxin.
- (The curve 60''' has the following mathematical formula:
B
Table 3 Drug Level Rate @ 0.5 min. (Dt/min.) Hemoglobin Level Prediction (ng/mL) Bias (ng/mL) Liquid 1 0.113 0 1.00 -- Liquid 1 0.110 250 1.11 0.11 Liquid 2 0.094 0 2.00 -- Liquid 2 0.092 250 2.19 0.19 Liquid 3 0.080 0 4.00 -- Liquid 3 0.080 250 4.00 0.00 (The zero bias for Liquid 3 results from the lucky coincidence of 0.5 minutes and the cross-over time for Liquid 3.) - If on the other hand, equation B is used, along with the very first data points of each curve as the "rateinit", then the results occur as follows, Table 4, with an improved bias compared to that of Table 3:
Table 4 Drug Level Initial Rate Topt Rateopt Hgb Prediction (ng/mL) Bias (ng/mL) Liquid 1 0.123 0.38 0.119 0 1.00 -- Liquid 1 0.130 0.36 0.120 250 0.97 -0.03 Liquid 2 0.100 0.44 0.096 0 2.00 -- Liquid 2 0.107 0.42 0.960 250 2.00 0.00 Liquid 3 0.083 0.49 0.080 0 4.00 -- Liquid 3 0.090 0.47 0.080 250 4.00 0.00
Claims (8)
- A method of reducing bias caused by an interferent of choice when conducting immunoassays using a dried test element containing detection reagents comprising peroxidase and a substrate that produce a detectable density change at various rates, wherein the peroxidase is present in a predetermined, limited amount, the method comprising the steps of:a) calibrating an immunoassay of a target analyte by ascertaining the time at which the rate of change in density produced by a first set of the test elements for the target analyte contacted with at least one liquid having a known amount of interferent of choice and a known amount of target analyte, crosses over or minimizes at a cross-over time, the rate of change in density produced by a second set of test elements substantially identical to the first set of test elements, contacted with a liquid having the known amount of target analyte but a negligible amount of interferent of choice, andb) conducting an assay of a patient sample of unknown amount of the target analyte by reading the rate of change in a selected element of the test elements of the first or second sets, caused by the sample contacting the selected element, at a time corresponding to the cross-over time ascertained in step a).
- A method as defined in claim 1, and further including the steps a') of repeating the step a) on at least a second liquid having the known amount of interferent of choice and a known amount of the target analyte that is different from the amount of the at least one liquid, and a'') repeating step a) on a third liquid having the known amount of analyte of the second liquid but a negligible amount of interferent of choice, to ascertain the time of the cross-over for the second and third liquids, and
ascertaining a relationship from the time determined in step a) of claim 1 and the time determined in step a') and a'') for the second and third liquids, that applies generally to a variety of amounts of target analyte in sample liquids. - A calibration method of reducing hemoglobin bias in calibration values for testing for a target analyte in an immunoassay that uses horseradish peroxidase and a substrate to produce a dye density that changes over time, the method comprising the steps ofa) ascertaining for a plurality of times using some of a plurality of slide test elements of identical composition, the rate of change in the dye density produced by at least two liquids having two different and preselected known amounts of the target analyte and zero amounts of hemoglobin;b) ascertaining for the plurality of times using additional members of the slide test elements of identical composition, the rate of change in the dye density produced by the at least two liquids which have added to them, a preselected non-negligible amount of hemoglobin that is the same for both of at least the two liquids;c) determining the cross-over points in time when the rate of change of the at least two liquids containing the non-zero amounts of hemoglobin, cross-over or minimize the rate of change for the corresponding two liquids lacking however any hemoglobin, thereby producing cross-over times having a minimized bias; andd) selecting the cross-over time for one of the at least two liquids as the optimal read time for subsequent sample liquid testing having an initial rate of change corresponding to the one of the at least two liquids.
- A calibration method as defined in claim 3, wherein step d) further includes the steps of:d') calculating corresponding cross-over time points for concentrations of the target analyte that are between the concentration values of analyte for the at least two liquids; ande) assigning the cross-over points in time of steps c) and d') to a table of values of optimal read times for use in subsequent testing of unknown patient samples.
- A method as defined in claim 4, wherein the step b) comprises ascertaining the rate of change for only two of the at least three liquids, and wherein the step d) comprises calculating a linear relationship of cross-over times for concentration values between those of the only two liquids.
- A method as defined in claim 4 wherein the step b) comprises ascertaining the rate of change for more than two liquids of the at least three liquids, and wherein the step d) comprises calculating a polynomial relationship of cross-over times for concentration values between those of the more than two liquids.
- A method for testing patient body fluids for a target analyte in an immunoassay that uses horseradish peroxidase and a leuco dye to produce a dye density that changes over time, the method comprising the steps ofa) ascertaining the rate of change in density over time of a particular patient body fluid of an unknown amount of the analyte, in an analyzer having at least one assigned cross-over point in time as an optimal read time calculated in accordance with the calibration method of claim 3 or 4;b) selecting a fixed point in time prior to any of the assigned cross-over times as an initial read time;c) ascertaining from the point in time selected in step b), the initial rate for that time from the values ascertained in step a);d) ascertaining for the initial rate ascertained from step c) an optimal cross-over read time that corresponds to the initial rate; ande) ascertaining from the rates determined in step a) the rate of change of the patient sample occurring at the optimal read time.
- A method for testing as defined in claim 7, wherein the optimal read time is the same for all initial rates ascertained in step c).
Applications Claiming Priority (2)
| Application Number | Priority Date | Filing Date | Title |
|---|---|---|---|
| US363099 | 1989-06-07 | ||
| US08/363,099 US5571682A (en) | 1994-12-22 | 1994-12-22 | Calibrating and testing immunoassays to minimize interferences |
Publications (3)
| Publication Number | Publication Date |
|---|---|
| EP0718626A2 true EP0718626A2 (en) | 1996-06-26 |
| EP0718626A3 EP0718626A3 (en) | 1998-06-10 |
| EP0718626B1 EP0718626B1 (en) | 2001-10-04 |
Family
ID=23428799
Family Applications (1)
| Application Number | Title | Priority Date | Filing Date |
|---|---|---|---|
| EP95309354A Expired - Lifetime EP0718626B1 (en) | 1994-12-22 | 1995-12-21 | Calibrating and testing immunoassays to minimize interferences |
Country Status (7)
| Country | Link |
|---|---|
| US (1) | US5571682A (en) |
| EP (1) | EP0718626B1 (en) |
| JP (1) | JP3672991B2 (en) |
| AT (1) | ATE206519T1 (en) |
| AU (1) | AU4056395A (en) |
| CA (1) | CA2165935C (en) |
| DE (1) | DE69523027T2 (en) |
Families Citing this family (13)
| Publication number | Priority date | Publication date | Assignee | Title |
|---|---|---|---|---|
| US8974386B2 (en) | 1998-04-30 | 2015-03-10 | Abbott Diabetes Care Inc. | Analyte monitoring device and methods of use |
| US6949816B2 (en) | 2003-04-21 | 2005-09-27 | Motorola, Inc. | Semiconductor component having first surface area for electrically coupling to a semiconductor chip and second surface area for electrically coupling to a substrate, and method of manufacturing same |
| US8346337B2 (en) | 1998-04-30 | 2013-01-01 | Abbott Diabetes Care Inc. | Analyte monitoring device and methods of use |
| US8465425B2 (en) | 1998-04-30 | 2013-06-18 | Abbott Diabetes Care Inc. | Analyte monitoring device and methods of use |
| US6175752B1 (en) | 1998-04-30 | 2001-01-16 | Therasense, Inc. | Analyte monitoring device and methods of use |
| US8688188B2 (en) | 1998-04-30 | 2014-04-01 | Abbott Diabetes Care Inc. | Analyte monitoring device and methods of use |
| US9066695B2 (en) | 1998-04-30 | 2015-06-30 | Abbott Diabetes Care Inc. | Analyte monitoring device and methods of use |
| US8480580B2 (en) | 1998-04-30 | 2013-07-09 | Abbott Diabetes Care Inc. | Analyte monitoring device and methods of use |
| US6560471B1 (en) | 2001-01-02 | 2003-05-06 | Therasense, Inc. | Analyte monitoring device and methods of use |
| AU2003296953A1 (en) * | 2002-12-12 | 2004-07-09 | Strategic Diagnostics Inc. | Compositions and methods for detecting animal by product in feed |
| JP4285012B2 (en) * | 2003-01-31 | 2009-06-24 | 株式会社日立製作所 | Learning situation judgment program and user situation judgment system |
| WO2007143225A2 (en) | 2006-06-07 | 2007-12-13 | Abbott Diabetes Care, Inc. | Analyte monitoring system and method |
| US9023599B2 (en) * | 2011-09-25 | 2015-05-05 | Chang Gung Medical Foundation, Linkou Branch | Method of detecting the presence of pneumococcal neuraminidases in Streptococcus pneumoniae-infected samples |
Citations (4)
| Publication number | Priority date | Publication date | Assignee | Title |
|---|---|---|---|---|
| JPS58140636A (en) * | 1982-02-16 | 1983-08-20 | Asahi Chem Ind Co Ltd | Measuring method of electric potential of erythrocyte membrane |
| JPH02167446A (en) * | 1988-09-01 | 1990-06-27 | Konica Corp | Analysis of liquid sample |
| JPH02227639A (en) * | 1989-02-28 | 1990-09-10 | Shimadzu Corp | Biochemical analysis |
| EP0606950A2 (en) * | 1993-01-13 | 1994-07-20 | Johnson & Johnson Clinical Diagnostics, Inc. | A method for reaction rate determination of analytes |
Family Cites Families (4)
| Publication number | Priority date | Publication date | Assignee | Title |
|---|---|---|---|---|
| US4022577A (en) * | 1976-03-12 | 1977-05-10 | The University Of Virginia | Automated radioimmunoassay |
| US4184923A (en) * | 1977-11-03 | 1980-01-22 | Eastman Kodak Company | Reduction of gentisic acid interference in analytical elements |
| US4835110A (en) * | 1985-12-23 | 1989-05-30 | Beckman Instruments, Inc. | Method for enhancing analysis timing in kinetic nephelometry |
| US5171688A (en) * | 1988-08-30 | 1992-12-15 | Cholestech Corporation | Self-corrected assay device |
-
1994
- 1994-12-22 US US08/363,099 patent/US5571682A/en not_active Expired - Lifetime
-
1995
- 1995-12-19 AU AU40563/95A patent/AU4056395A/en not_active Abandoned
- 1995-12-21 DE DE69523027T patent/DE69523027T2/en not_active Expired - Lifetime
- 1995-12-21 CA CA002165935A patent/CA2165935C/en not_active Expired - Fee Related
- 1995-12-21 JP JP33354795A patent/JP3672991B2/en not_active Expired - Fee Related
- 1995-12-21 EP EP95309354A patent/EP0718626B1/en not_active Expired - Lifetime
- 1995-12-21 AT AT95309354T patent/ATE206519T1/en not_active IP Right Cessation
Patent Citations (4)
| Publication number | Priority date | Publication date | Assignee | Title |
|---|---|---|---|---|
| JPS58140636A (en) * | 1982-02-16 | 1983-08-20 | Asahi Chem Ind Co Ltd | Measuring method of electric potential of erythrocyte membrane |
| JPH02167446A (en) * | 1988-09-01 | 1990-06-27 | Konica Corp | Analysis of liquid sample |
| JPH02227639A (en) * | 1989-02-28 | 1990-09-10 | Shimadzu Corp | Biochemical analysis |
| EP0606950A2 (en) * | 1993-01-13 | 1994-07-20 | Johnson & Johnson Clinical Diagnostics, Inc. | A method for reaction rate determination of analytes |
Non-Patent Citations (3)
| Title |
|---|
| PATENT ABSTRACTS OF JAPAN vol. 007, no. 256 (P-236), 15 November 1983 & JP 58 140636 A (ASAHI KASEI KOGYO KK), 20 August 1983, * |
| PATENT ABSTRACTS OF JAPAN vol. 014, no. 430 (P-1106), 14 September 1990 & JP 02 167446 A (KONICA CORP), 27 June 1990, * |
| PATENT ABSTRACTS OF JAPAN vol. 014, no. 534 (P-1135), 26 November 1990 & JP 02 227639 A (SHIMADZU CORP), 10 September 1990, * |
Also Published As
| Publication number | Publication date |
|---|---|
| JPH08233818A (en) | 1996-09-13 |
| EP0718626B1 (en) | 2001-10-04 |
| DE69523027T2 (en) | 2002-03-14 |
| CA2165935C (en) | 2009-10-20 |
| DE69523027D1 (en) | 2001-11-08 |
| JP3672991B2 (en) | 2005-07-20 |
| US5571682A (en) | 1996-11-05 |
| ATE206519T1 (en) | 2001-10-15 |
| AU4056395A (en) | 1996-06-27 |
| EP0718626A3 (en) | 1998-06-10 |
| CA2165935A1 (en) | 1996-06-23 |
Similar Documents
| Publication | Publication Date | Title |
|---|---|---|
| EP0071934B1 (en) | Method for preparing a color stable chromogenic analytical element | |
| JP4183308B2 (en) | Apparatus and method for obtaining clinically important analyte ratios | |
| EP0918881B1 (en) | Dry reagent test strip comprising benzidine dye precursor and antipyrine compound | |
| CA1290227C (en) | Test device and method of determining concentration of a sample component | |
| CA1114268A (en) | Glucose indicator and method | |
| EP0718626A2 (en) | Calibrating and testing immunoassays to minimize interferences | |
| US5516700A (en) | Automated urinalysis method | |
| EP1460414A1 (en) | Concentration measuring method | |
| US3979262A (en) | Compositions and methods for the determination of oxidizing agents | |
| EP0044775B1 (en) | Dry analytical element having a reaction zone and a reagent zone | |
| JPH0629852B2 (en) | Quantitative analysis method of test substance in liquid sample using biased dry analysis element | |
| US5348889A (en) | Method for correcting a calibration curve | |
| US6306660B1 (en) | Method for improving the accuracy of the semi-quantitative determination of analyte in fluid samples | |
| KR100730900B1 (en) | How to improve the accuracy of quasi-quantitative measurements of analytes in body fluid samples | |
| Mashiba et al. | Measurement of glycated albumin by the nitroblue tetrazolium colorimetric method | |
| US5592290A (en) | Method for correcting instrumental error of spectroscope of optical analyzer | |
| NIshi et al. | Three turbidimetric methods for determining total protein compared. | |
| CA1096281A (en) | Calibrator composition based upon dialyzed blood serum | |
| US5919642A (en) | Competitive binding assays having improved linearity | |
| CA1158966A (en) | Compensated reference liquid | |
| EP0684477A2 (en) | Calibrator matrix | |
| Van Rijn et al. | Is the turbidimetric immunoassay of haptoglobin phenotype-dependent? | |
| US5571723A (en) | Method of testing for diabetes that reduces the effect of interfering substances | |
| Thompson et al. | Homogeneous dry reagent immunoassay strips for the determination of therapeutic drugs in human serum or plasma | |
| Boguslaski et al. | Multilayer film immunoassay |
Legal Events
| Date | Code | Title | Description |
|---|---|---|---|
| PUAI | Public reference made under article 153(3) epc to a published international application that has entered the european phase |
Free format text: ORIGINAL CODE: 0009012 |
|
| AK | Designated contracting states |
Kind code of ref document: A2 Designated state(s): AT BE CH DE DK ES FR GB GR IE IT LI LU MC NL PT SE |
|
| AX | Request for extension of the european patent |
Free format text: SI PAYMENT 960103 |
|
| RAX | Requested extension states of the european patent have changed |
Free format text: SI PAYMENT 960103 |
|
| PUAL | Search report despatched |
Free format text: ORIGINAL CODE: 0009013 |
|
| AK | Designated contracting states |
Kind code of ref document: A3 Designated state(s): AT BE CH DE DK ES FR GB GR IE IT LI LU MC NL PT SE |
|
| AX | Request for extension of the european patent |
Free format text: SI PAYMENT 960103 |
|
| 17P | Request for examination filed |
Effective date: 19981113 |
|
| GRAG | Despatch of communication of intention to grant |
Free format text: ORIGINAL CODE: EPIDOS AGRA |
|
| 17Q | First examination report despatched |
Effective date: 20001211 |
|
| GRAG | Despatch of communication of intention to grant |
Free format text: ORIGINAL CODE: EPIDOS AGRA |
|
| GRAH | Despatch of communication of intention to grant a patent |
Free format text: ORIGINAL CODE: EPIDOS IGRA |
|
| GRAH | Despatch of communication of intention to grant a patent |
Free format text: ORIGINAL CODE: EPIDOS IGRA |
|
| GRAA | (expected) grant |
Free format text: ORIGINAL CODE: 0009210 |
|
| AK | Designated contracting states |
Kind code of ref document: B1 Designated state(s): AT BE CH DE DK ES FR GB GR IE IT LI LU MC NL PT SE |
|
| AX | Request for extension of the european patent |
Free format text: SI PAYMENT 19960103 |
|
| PG25 | Lapsed in a contracting state [announced via postgrant information from national office to epo] |
Ref country code: NL Free format text: LAPSE BECAUSE OF FAILURE TO SUBMIT A TRANSLATION OF THE DESCRIPTION OR TO PAY THE FEE WITHIN THE PRESCRIBED TIME-LIMIT Effective date: 20011004 Ref country code: LI Free format text: LAPSE BECAUSE OF FAILURE TO SUBMIT A TRANSLATION OF THE DESCRIPTION OR TO PAY THE FEE WITHIN THE PRESCRIBED TIME-LIMIT Effective date: 20011004 Ref country code: IT Free format text: LAPSE BECAUSE OF FAILURE TO SUBMIT A TRANSLATION OF THE DESCRIPTION OR TO PAY THE FEE WITHIN THE PRE;WARNING: LAPSES OF ITALIAN PATENTS WITH EFFECTIVE DATE BEFORE 2007 MAY HAVE OCCURRED AT ANY TIME BEFORE 2007. THE CORRECT EFFECTIVE DATE MAY BE DIFFERENT FROM THE ONE RECORDED.SCRIBED TIME-LIMIT Effective date: 20011004 Ref country code: GR Free format text: LAPSE BECAUSE OF NON-PAYMENT OF DUE FEES Effective date: 20011004 Ref country code: CH Free format text: LAPSE BECAUSE OF FAILURE TO SUBMIT A TRANSLATION OF THE DESCRIPTION OR TO PAY THE FEE WITHIN THE PRESCRIBED TIME-LIMIT Effective date: 20011004 Ref country code: BE Free format text: LAPSE BECAUSE OF FAILURE TO SUBMIT A TRANSLATION OF THE DESCRIPTION OR TO PAY THE FEE WITHIN THE PRESCRIBED TIME-LIMIT Effective date: 20011004 Ref country code: AT Free format text: LAPSE BECAUSE OF FAILURE TO SUBMIT A TRANSLATION OF THE DESCRIPTION OR TO PAY THE FEE WITHIN THE PRESCRIBED TIME-LIMIT Effective date: 20011004 |
|
| REF | Corresponds to: |
Ref document number: 206519 Country of ref document: AT Date of ref document: 20011015 Kind code of ref document: T |
|
| REG | Reference to a national code |
Ref country code: CH Ref legal event code: EP |
|
| REF | Corresponds to: |
Ref document number: 69523027 Country of ref document: DE Date of ref document: 20011108 |
|
| REG | Reference to a national code |
Ref country code: IE Ref legal event code: FG4D |
|
| PG25 | Lapsed in a contracting state [announced via postgrant information from national office to epo] |
Ref country code: MC Free format text: LAPSE BECAUSE OF NON-PAYMENT OF DUE FEES Effective date: 20011221 Ref country code: LU Free format text: LAPSE BECAUSE OF NON-PAYMENT OF DUE FEES Effective date: 20011221 Ref country code: IE Free format text: LAPSE BECAUSE OF FAILURE TO SUBMIT A TRANSLATION OF THE DESCRIPTION OR TO PAY THE FEE WITHIN THE PRESCRIBED TIME-LIMIT Effective date: 20011221 |
|
| REG | Reference to a national code |
Ref country code: GB Ref legal event code: IF02 |
|
| PG25 | Lapsed in a contracting state [announced via postgrant information from national office to epo] |
Ref country code: SE Free format text: LAPSE BECAUSE OF FAILURE TO SUBMIT A TRANSLATION OF THE DESCRIPTION OR TO PAY THE FEE WITHIN THE PRESCRIBED TIME-LIMIT Effective date: 20020104 Ref country code: PT Free format text: LAPSE BECAUSE OF FAILURE TO SUBMIT A TRANSLATION OF THE DESCRIPTION OR TO PAY THE FEE WITHIN THE PRESCRIBED TIME-LIMIT Effective date: 20020104 Ref country code: DK Free format text: LAPSE BECAUSE OF FAILURE TO SUBMIT A TRANSLATION OF THE DESCRIPTION OR TO PAY THE FEE WITHIN THE PRESCRIBED TIME-LIMIT Effective date: 20020104 |
|
| ET | Fr: translation filed | ||
| NLV1 | Nl: lapsed or annulled due to failure to fulfill the requirements of art. 29p and 29m of the patents act | ||
| REG | Reference to a national code |
Ref country code: CH Ref legal event code: PL |
|
| PG25 | Lapsed in a contracting state [announced via postgrant information from national office to epo] |
Ref country code: ES Free format text: LAPSE BECAUSE OF FAILURE TO SUBMIT A TRANSLATION OF THE DESCRIPTION OR TO PAY THE FEE WITHIN THE PRESCRIBED TIME-LIMIT Effective date: 20020430 |
|
| PLBE | No opposition filed within time limit |
Free format text: ORIGINAL CODE: 0009261 |
|
| STAA | Information on the status of an ep patent application or granted ep patent |
Free format text: STATUS: NO OPPOSITION FILED WITHIN TIME LIMIT |
|
| 26N | No opposition filed | ||
| REG | Reference to a national code |
Ref country code: IE Ref legal event code: MM4A |
|
| PGFP | Annual fee paid to national office [announced via postgrant information from national office to epo] |
Ref country code: FR Payment date: 20101224 Year of fee payment: 16 |
|
| PGFP | Annual fee paid to national office [announced via postgrant information from national office to epo] |
Ref country code: GB Payment date: 20101215 Year of fee payment: 16 |
|
| PGFP | Annual fee paid to national office [announced via postgrant information from national office to epo] |
Ref country code: DE Payment date: 20101215 Year of fee payment: 16 |
|
| GBPC | Gb: european patent ceased through non-payment of renewal fee |
Effective date: 20111221 |
|
| REG | Reference to a national code |
Ref country code: FR Ref legal event code: ST Effective date: 20120831 |
|
| REG | Reference to a national code |
Ref country code: DE Ref legal event code: R119 Ref document number: 69523027 Country of ref document: DE Effective date: 20120703 |
|
| PG25 | Lapsed in a contracting state [announced via postgrant information from national office to epo] |
Ref country code: DE Free format text: LAPSE BECAUSE OF NON-PAYMENT OF DUE FEES Effective date: 20120703 Ref country code: GB Free format text: LAPSE BECAUSE OF NON-PAYMENT OF DUE FEES Effective date: 20111221 |
|
| PG25 | Lapsed in a contracting state [announced via postgrant information from national office to epo] |
Ref country code: FR Free format text: LAPSE BECAUSE OF NON-PAYMENT OF DUE FEES Effective date: 20120102 |