EP0519595A2 - Image inspection methods and apparatus - Google Patents
Image inspection methods and apparatus Download PDFInfo
- Publication number
- EP0519595A2 EP0519595A2 EP19920304202 EP92304202A EP0519595A2 EP 0519595 A2 EP0519595 A2 EP 0519595A2 EP 19920304202 EP19920304202 EP 19920304202 EP 92304202 A EP92304202 A EP 92304202A EP 0519595 A2 EP0519595 A2 EP 0519595A2
- Authority
- EP
- European Patent Office
- Prior art keywords
- image
- vector
- product
- segment
- sample
- Prior art date
- Legal status (The legal status is an assumption and is not a legal conclusion. Google has not performed a legal analysis and makes no representation as to the accuracy of the status listed.)
- Withdrawn
Links
Images


Classifications
-
- G—PHYSICS
- G06—COMPUTING; CALCULATING OR COUNTING
- G06T—IMAGE DATA PROCESSING OR GENERATION, IN GENERAL
- G06T7/00—Image analysis
- G06T7/0002—Inspection of images, e.g. flaw detection
- G06T7/0004—Industrial image inspection
-
- G—PHYSICS
- G06—COMPUTING; CALCULATING OR COUNTING
- G06F—ELECTRIC DIGITAL DATA PROCESSING
- G06F18/00—Pattern recognition
- G06F18/20—Analysing
- G06F18/21—Design or setup of recognition systems or techniques; Extraction of features in feature space; Blind source separation
-
- G—PHYSICS
- G06—COMPUTING; CALCULATING OR COUNTING
- G06V—IMAGE OR VIDEO RECOGNITION OR UNDERSTANDING
- G06V10/00—Arrangements for image or video recognition or understanding
- G06V10/70—Arrangements for image or video recognition or understanding using pattern recognition or machine learning
-
- G—PHYSICS
- G06—COMPUTING; CALCULATING OR COUNTING
- G06T—IMAGE DATA PROCESSING OR GENERATION, IN GENERAL
- G06T2207/00—Indexing scheme for image analysis or image enhancement
- G06T2207/20—Special algorithmic details
- G06T2207/20076—Probabilistic image processing
-
- G—PHYSICS
- G06—COMPUTING; CALCULATING OR COUNTING
- G06T—IMAGE DATA PROCESSING OR GENERATION, IN GENERAL
- G06T2207/00—Indexing scheme for image analysis or image enhancement
- G06T2207/30—Subject of image; Context of image processing
- G06T2207/30108—Industrial image inspection
- G06T2207/30164—Workpiece; Machine component
Definitions
- This invention relates to methods and apparatus for determining whether or not an image is substantially like other images.
- the present invention aims to provide improved image inspection methods and apparatus.
- it aims to provide image inspection methods and apparatus which can inspect all portions of an image if desired.
- Embodiments of the invention provide image inspection methods and apparatus which can set themselves up to perform image inspections by gathering data from samples of the images to be inspected.
- a preferred embodiment of the invention provides an image inspection system which performs a statistics-based analysis of the images to be inspected.
- This analysis employs normalized statistical functions so that regardless of the images being processed, the criterion used to determine whether an image is acceptable or not can simply be looked up in a standard table of statistical values.
- the system first gathers statistical information from a plurality of sample images.
- the image information in each of a plurality of segments of each sample image is reduced to a single value so that each sample image can be represented as a vector of such values.
- a variance-covariance matrix of all of these vectors is then computed, as is a mean vector of these vectors.
- the Cholesky decomposition matrix of the variance-covariance matrix is then computed for use in normalizing the statistical analysis of the images to be inspected.
- the system is now ready for actual image inspection.
- Each image to be inspected is initially processed in the same way that the processing of sample images begins, i.e., the image information in each segment is reduced to a single value so that the image can be represented by an image vector of these values.
- a product vector is then computed by multiplying the inverse of the Cholesky decomposition matrix by the difference between the image vector and the mean vector.
- the dot product of the product vector with itself is then computed to produce a single value which can be compared to a number taken from a standard statistical table based on the number of image segments employed in the image analysis and the desired probability of false rejection of an actually acceptable image. The relationship between the dot product and the number from the standard statistical table determines whether or not the image is acceptable.
- data for images determined by the practice of the invention to be acceptable can be used to refine the statistical information used to process subsequent images.
- the computed values for unacceptable images can be decomposed to identify the image segments which are making the image unacceptable.
- FIG. 1 An illustrative product inspection system 10 which can incorporate the present invention is shown in Figure 1.
- Products 12 e.g., cigarette packs
- Conveyor 20 Each time a product is properly positioned (at A) in front of camera 24 (as detected by detector 22), processor 26 (which includes conventional imaging hardware) "grabs" the image of the product from camera 24.
- Processor 26 may cause lights 30 to briefly illuminate the product at location A to help sharpen the image received by the processor.
- Processor 26 analyzes each image in accordance with this invention as described in more detail below so that by the time the associated product 12 reaches the controllable branch 20B in conveyor 20, processor 26 has determined whether or not the product has an acceptable appearance.
- processor 26 controls conveyor branch 20B so that the product is directed to conveyor 20A which conveys accepted products 12A away for further processing appropriate to such products.
- processor 26 controls conveyor branch 20B so that the product is directed to conveyor 20R which conveys unacceptable and therefore rejected products 12R away for further processing appropriate to such products.
- Processor 26 is augmented by a display 32 (e.g., a conventional video display) and a data entry device 34 (e.g., a conventional keyboard, mouse, and/or touch screen elements associated with display 32).
- Display 32 may display such information as the product images received from camera 24 and/or messages as to the status of the system, the types of image defects being detected, etc.
- Data entry device 34 may be used to control operation of the system, to enter various operating parameters, etc.
- FIG. 1 suggests that system 10 operates on a single elevational image of products 12, it will be apparent to those skilled in the art that the system could be set up to test multiple images of products 12 taken from different angles and including perspective views so that as many surfaces are inspected as are desired.
- camera 24 can be a conventional NTSC, PAL, SECAM or RGB compatible camera.
- Processor 26 may be a suitably programmed conventional 386 personal computer workstation such a CAT386 workstation available from Comark Corp. of Medfield, Massachusetts, with a conventional IM-1280 imaging hardware system available from Matrox Electronic Systems Limited of Dorval, Quebec, Canada.
- FIG. 2 An illustrative embodiment of the methods of this invention is shown in FIG. 2.
- processor 26 is programmed to perform the steps shown in FIG. 2.
- the first phase of product or other image inspection in accordance with this invention is to gather statistical information about the images to be inspected. This can be done in other ways if desired, but FIG. 2 assumes that the necessary statistical information is derived from a predetermined number of actual product images which are known to be acceptable. Accordingly, in step 102 processor 26 acquires a predetermined number (e.g., 200) of acceptable images (e.g., by passing 200 products 12 of known acceptability through system 10). Processor 26 digitizes each of these images in the conventional way (e.g., by assigning to each pixel a gray scale digital value in the range from 0 through 255 based on the intensity of the corresponding region in the original image). Although the images may have any other size, aspect ratio, or total number of pixels, in the depicted preferred embodiment each image is 256 by 232 pixels.
- a predetermined number e.g. 200
- Processor 26 digitizes each of these images in the conventional way (e.g., by assigning to each pixel a gray scale
- step 104 processor 26 breaks each of the 200 sample images from step 102 down into 64 segments. Although the number, size, and arrangement of these segments could be different if desired, in the preferred embodiment an 8 by 8 arrangement of equally sized segments is used. Also in step 104 the pixel values in each segment of each sample image are combined (e.g., averaged) to produce a single value for each segment. The resulting 64 values for each sample image form a 64-element vector representative of that image.
- step 106 processor 26 computes a variance-covariance matrix V of the 200 64-element vectors from step 104. It is assumed that these vectors have a multivariate normal (i.e., Gaussian) distribution across the 200 sample images.
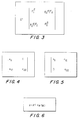
- FIG. 3 shows what is meant by a variance-covariance matrix of two-element vectors, but of course in the case of the 64-element vectors actually used in the preferred embodiment V is a 64 by 64 matrix.
- ⁇ i is the standard deviation of the 200 values for the ith segment from step 104
- ⁇ ij is the correlation coefficient between the values from step 104 for the ith and jth segments.
- step 106 processor 26 computes a 64-element mean vector which is just the segment-by-segment average of the 200 vectors from step 104.
- a lower triangular matrix A is computed such that A times its transpose equals V .
- FIG. 4 illustrates what is meant by a lower triangular matrix in the case of two-by-two matrices.
- FIG. 5 shows the transpose of the matrix shown in FIG. 4.
- A is a 64-by-64 element matrix.
- the construction of A is known as the Cholesky decomposition of the matrix V .
- the matrix A is useful because of the transform shown in FIG. 6.
- a ⁇ 1 is the inverse of A
- y is a 64-element vector similar to any of the vectors discussed above in connection with step 104 but for an image being actually inspected
- ⁇ is the mean vector from step 106.
- z has a standard multivariate normal density function with mean vector 0 and a variance-covariance matrix which is the identity matrix (i.e., a matrix in which the diagonal elements are 1 and all other elements are 0). Because z has a standard multivariate normal distribution, the sum of its squared elements, z ⁇ z , has a central chi-square distribution with degrees of freedom equal to the number of segments per image.
- An exemplary table of the cumulative distribution of central chi-square is Table A5 in Statistical Methods , Snedecor, G.W. and Cochran, W.G., Iowa State University Press, Ames, Iowa, 1967.
- step 120 an image to be inspected is obtained (e.g., by operating elements 24, 26, and 30 in FIG. 1 to obtain the image of the product 12 which is currently in the field of view of camera 24).
- the data for this image is similar to the image data described above in connection with step 102.
- step 122 the image data from step 120 is converted to a vector y in the same way that each of the sample images considered in step 104 is converted to such a vector.
- the image is segmented into the same 64 segments used in step 104, and the pixel values in each segment are combined to produce a single "mean" value for that segment.
- 64 mean values are the elements of vector y .
- step 124 the transformation discussed above in connection FIG. 6 is performed on vector y to produce vector z .
- this transformation standardizes the vector for the inspected image in order to compare it to the known standardized distribution of sample images.
- step 126 the dot product of the vector z with itself is computed.
- a value c is selected by choosing a number ⁇ (the probability that an acceptable image will be falsely rejected) and then finding the associated value of chi-square corresponding to ⁇ with 64 degrees of freedom. This can be done by looking up the appropriate value of chi-square in a published table of the cumulative distribution of chi-square if ⁇ is greater than about .005 (which is typically the limit of published tables).
- the appropriate value of chi-square can be computed using well-known formulas available on conventional calculators and digital computers.
- One such formula is embodied in a computer program known as CHIIN which is part of the well-known International Mathematical and Statistical Library ("IMSL"). This program allows the user to enter the desired probability ⁇ and the number of degrees of freedom, and provides c as an output. For example, if ⁇ is selected to be 10 ⁇ 7 (with 64 degrees of freedom), c is found to be approximately 141.
- step 130 the dot product computed in step 126 is compared to the value c determined in step 128. If the dot product is greater than c, the associated product 12 is rejected as having an unacceptable image. If the dot product is less than or equal to c, the associated product 12 is accepted as having an acceptable image.
- Step 140 is optional and is employed only if it is desired to periodically refine the statistical base against which subsequent product images are tested. If this periodic refinement is desired, then in step 140 the vectors y of selected images which have been determined in step 130 to be acceptable are saved. After such vectors have been accumulated, steps 106 and 108 are performed again on the now-extended acceptable image data base in order to compute new values of V , ⁇ , and A. Thereafter, these new values are used in step 124.
- Step 150 is also optional and is performed if it is desired to have the system provide information as to why it rejected an image in step 130. If included, step 150 is performed when an image has been rejected.
- the elements which are summed to compute the dot product in step 126 are ordered in order to find the largest of these dot product elements. Then the elements of y making the largest contribution to the largest dot product element (through the equation shown in step 124) are identified.
- the image segment or segments associated with these elements of y are identified to the operator of the system (e.g., by an appropriate message on display 32). This tells the operator which image segment or segments are defective or most defective. This in turn may help the operator correct the problem which is causing products 12 to have an unacceptable appearance.
- Step 160 merely makes it clear that steps 120 through 150 are repeated for each new product image.
- steps 102-108 refer to the use of an initial sample of 200 acceptable images, a smaller or larger initial sample can be used if desired.
Abstract
An image is tested to determine whether it is substantially like a plurality of sample images by computing statistical information about the sample images and using that statistical information to analyze the image being tested. The analysis is such that the statistical parameters are standardized so that available tables of the central chi-square distribution function can be used, thereby simplifying the necessary calculations. If desired, images which have been determined by the method of this invention to be good can be used to refine the statistical information used in analyzing subsequent images. When an image is identified as unacceptable by the method of the invention, the data for that image can be decomposed in order to identify the parts of the image which are causing the image to be unacceptable.
Description
- This invention relates to methods and apparatus for determining whether or not an image is substantially like other images.
- Although the principles of this invention are equally applicable in other contexts, the invention will be fully understood from the following explanation of its use in the context of product image inspection.
- Many products such as packaged foods and beverages, cleaning products, paper products, smoking articles, and the like are produced in such large quantities and at such high speeds that some form of automated image inspection is required if the appearance of the product is to be inspected. Such inspection is important because the product may not be saleable if its appearance is defective. In addition, the inspection system should promptly alert those in charge of production if an excessive number of defective-looking products are being produced. If possible, the inspection system should be able to advise those in charge of production where in the image the defect causing rejection is in order to assist in the formulation of corrective action.
- Many prior art image inspection systems inspect only predetermined portions of an image. This has at least two important drawbacks. First, setting up such systems typically requires large amounts of highly skilled operator time, and this process may have to be repeated each time the product to be inspected changes. Second, the system may not detect defects of unexpected kinds or defects in unexpected places.
- In view of the foregoing, the present invention aims to provide improved image inspection methods and apparatus. In particular it aims to provide image inspection methods and apparatus which can inspect all portions of an image if desired.
- The invention is defined by the independent claims to which reference should be made.
- Embodiments of the invention provide image inspection methods and apparatus which can set themselves up to perform image inspections by gathering data from samples of the images to be inspected.
- A preferred embodiment of the invention provides an image inspection system which performs a statistics-based analysis of the images to be inspected. This analysis employs normalized statistical functions so that regardless of the images being processed, the criterion used to determine whether an image is acceptable or not can simply be looked up in a standard table of statistical values.
- The system first gathers statistical information from a plurality of sample images. In particular, the image information in each of a plurality of segments of each sample image is reduced to a single value so that each sample image can be represented as a vector of such values. A variance-covariance matrix of all of these vectors is then computed, as is a mean vector of these vectors. The Cholesky decomposition matrix of the variance-covariance matrix is then computed for use in normalizing the statistical analysis of the images to be inspected. The system is now ready for actual image inspection.
- Each image to be inspected is initially processed in the same way that the processing of sample images begins, i.e., the image information in each segment is reduced to a single value so that the image can be represented by an image vector of these values. A product vector is then computed by multiplying the inverse of the Cholesky decomposition matrix by the difference between the image vector and the mean vector. The dot product of the product vector with itself is then computed to produce a single value which can be compared to a number taken from a standard statistical table based on the number of image segments employed in the image analysis and the desired probability of false rejection of an actually acceptable image. The relationship between the dot product and the number from the standard statistical table determines whether or not the image is acceptable.
- If desired, data for images determined by the practice of the invention to be acceptable can be used to refine the statistical information used to process subsequent images. Also if desired, the computed values for unacceptable images can be decomposed to identify the image segments which are making the image unacceptable.
- Embodiments of the invention will now be described, by way of example, and with reference to the accompanying drawings, in which:
- Figure 1 is a simplified block diagram of an illustrative product inspection system which can be operated in accordance with embodiments of the invention;
- Figures 2a and 2b (referred to collectively as Figure 2) are a flow chart of an illustrative embodiment of the image inspection methods embodying this invention;
- Figures 3-5 show matrices useful in explaining techniques employed in the embodiments of the present invention; and
- Figure 6 shows a mathematical relationship useful in explaining techniques employed in embodiments of the present invention.
- An illustrative
product inspection system 10 which can incorporate the present invention is shown in Figure 1. Products 12 (e.g., cigarette packs) to be inspected are conveyed one after another from left to right as viewed in the Figure byConveyor 20. Each time a product is properly positioned (at A) in front of camera 24 (as detected by detector 22), processor 26 (which includes conventional imaging hardware) "grabs" the image of the product fromcamera 24.Processor 26 may causelights 30 to briefly illuminate the product at location A to help sharpen the image received by the processor.Processor 26 analyzes each image in accordance with this invention as described in more detail below so that by the time the associatedproduct 12 reaches thecontrollable branch 20B inconveyor 20,processor 26 has determined whether or not the product has an acceptable appearance. If the product's appearance is acceptable,processor 26 controlsconveyor branch 20B so that the product is directed toconveyor 20A which conveys acceptedproducts 12A away for further processing appropriate to such products. On the other hand, if the product's appearance is unacceptable,processor 26 controlsconveyor branch 20B so that the product is directed toconveyor 20R which conveys unacceptable and therefore rejectedproducts 12R away for further processing appropriate to such products. -
Processor 26 is augmented by a display 32 (e.g., a conventional video display) and a data entry device 34 (e.g., a conventional keyboard, mouse, and/or touch screen elements associated with display 32).Display 32 may display such information as the product images received fromcamera 24 and/or messages as to the status of the system, the types of image defects being detected, etc.Data entry device 34 may be used to control operation of the system, to enter various operating parameters, etc. - While FIG. 1 suggests that
system 10 operates on a single elevational image ofproducts 12, it will be apparent to those skilled in the art that the system could be set up to test multiple images ofproducts 12 taken from different angles and including perspective views so that as many surfaces are inspected as are desired. Similarly, although the system will be explained in terms of monochrome (e.g., black and white) images, it will be apparent to those skilled in the art how the system can be modified to inspect in full color. Thuscamera 24 can be a conventional NTSC, PAL, SECAM or RGB compatible camera.Processor 26 may be a suitably programmed conventional 386 personal computer workstation such a CAT386 workstation available from Comark Corp. of Medfield, Massachusetts, with a conventional IM-1280 imaging hardware system available from Matrox Electronic Systems Limited of Dorval, Quebec, Canada. - An illustrative embodiment of the methods of this invention is shown in FIG. 2. When this method is performed by apparatus of the type shown in FIG. 1,
processor 26 is programmed to perform the steps shown in FIG. 2. - The first phase of product or other image inspection in accordance with this invention is to gather statistical information about the images to be inspected. This can be done in other ways if desired, but FIG. 2 assumes that the necessary statistical information is derived from a predetermined number of actual product images which are known to be acceptable. Accordingly, in
step 102processor 26 acquires a predetermined number (e.g., 200) of acceptable images (e.g., by passing 200products 12 of known acceptability through system 10).Processor 26 digitizes each of these images in the conventional way (e.g., by assigning to each pixel a gray scale digital value in the range from 0 through 255 based on the intensity of the corresponding region in the original image). Although the images may have any other size, aspect ratio, or total number of pixels, in the depicted preferred embodiment each image is 256 by 232 pixels. - In
step 104processor 26 breaks each of the 200 sample images fromstep 102 down into 64 segments. Although the number, size, and arrangement of these segments could be different if desired, in the preferred embodiment an 8 by 8 arrangement of equally sized segments is used. Also instep 104 the pixel values in each segment of each sample image are combined (e.g., averaged) to produce a single value for each segment. The resulting 64 values for each sample image form a 64-element vector representative of that image. - In
step 106processor 26 computes a variance-covariance matrix V of the 200 64-element vectors fromstep 104. It is assumed that these vectors have a multivariate normal (i.e., Gaussian) distribution across the 200 sample images. FIG. 3 shows what is meant by a variance-covariance matrix of two-element vectors, but of course in the case of the 64-element vectors actually used in the preferred embodiment V is a 64 by 64 matrix. In such matrices (as in FIG. 3) σi is the standard deviation of the 200 values for the ith segment fromstep 104, and ρij is the correlation coefficient between the values fromstep 104 for the ith and jth segments. Also instep 106processor 26 computes a 64-element mean vector which is just the segment-by-segment average of the 200 vectors fromstep 104. - In step 108 a lower triangular matrix A is computed such that A times its transpose equals V. FIG. 4 illustrates what is meant by a lower triangular matrix in the case of two-by-two matrices. FIG. 5 shows the transpose of the matrix shown in FIG. 4. Again, of course, in the preferred embodiment A is a 64-by-64 element matrix. The construction of A is known as the Cholesky decomposition of the matrix V. The matrix A is useful because of the transform shown in FIG. 6. In FIG. 6 A⁻¹ is the inverse of A, y is a 64-element vector similar to any of the vectors discussed above in connection with
step 104 but for an image being actually inspected, and µ is the mean vector fromstep 106. If y is transformed to z as shown in FIG. 6, then z has a standard multivariate normal density function with mean vector 0 and a variance-covariance matrix which is the identity matrix (i.e., a matrix in which the diagonal elements are 1 and all other elements are 0). Because z has a standard multivariate normal distribution, the sum of its squared elements, z·z, has a central chi-square distribution with degrees of freedom equal to the number of segments per image. An exemplary table of the cumulative distribution of central chi-square is Table A5 in Statistical Methods, Snedecor, G.W. and Cochran, W.G., Iowa State University Press, Ames, Iowa, 1967. As discussed in more detail below, there are also well-known formulas and computer programs for computing the cumulative distribution of central chi-square. The image vector y, if it is a random sample from the set of sample images, cannot be assumed to be drawn from a distribution with mean 0 and variance-covariance matrix I (the identity matrix). Consequently, the sum of squared elements, y·y, cannot be assumed to be chi-square distributed, and, in fact, its distribution will be unknown. Standardization using A⁻¹(y-µ) is essential because absent such standardization, computation of a simple inspection index is impossible. Accordingly, standardization of the statistical information as described above greatly simplifies the image inspection process in accordance with this invention. - At the conclusion of
step 108 the system is ready to begin actual image inspection. Accordingly, instep 120 an image to be inspected is obtained (e.g., by operatingelements product 12 which is currently in the field of view of camera 24). The data for this image is similar to the image data described above in connection withstep 102. - In
step 122 the image data fromstep 120 is converted to a vector y in the same way that each of the sample images considered instep 104 is converted to such a vector. In particular, the image is segmented into the same 64 segments used instep 104, and the pixel values in each segment are combined to produce a single "mean" value for that segment. These 64 mean values are the elements of vector y. - In
step 124 the transformation discussed above in connection FIG. 6 is performed on vector y to produce vector z. As described above, this transformation standardizes the vector for the inspected image in order to compare it to the known standardized distribution of sample images. - In
step 126 the dot product of the vector z with itself is computed. - In step 128 a value c is selected by choosing a number α (the probability that an acceptable image will be falsely rejected) and then finding the associated value of chi-square corresponding to α with 64 degrees of freedom. This can be done by looking up the appropriate value of chi-square in a published table of the cumulative distribution of chi-square if α is greater than about .005 (which is typically the limit of published tables). Alternatively, the appropriate value of chi-square can be computed using well-known formulas available on conventional calculators and digital computers. One such formula is embodied in a computer program known as CHIIN which is part of the well-known International Mathematical and Statistical Library ("IMSL"). This program allows the user to enter the desired probability α and the number of degrees of freedom, and provides c as an output. For example, if α is selected to be 10⁻⁷ (with 64 degrees of freedom), c is found to be approximately 141.
- In
step 130 the dot product computed instep 126 is compared to the value c determined instep 128. If the dot product is greater than c, the associatedproduct 12 is rejected as having an unacceptable image. If the dot product is less than or equal to c, the associatedproduct 12 is accepted as having an acceptable image. - Step 140 is optional and is employed only if it is desired to periodically refine the statistical base against which subsequent product images are tested. If this periodic refinement is desired, then in
step 140 the vectors y of selected images which have been determined instep 130 to be acceptable are saved. After such vectors have been accumulated,steps step 124. - Step 150 is also optional and is performed if it is desired to have the system provide information as to why it rejected an image in
step 130. If included,step 150 is performed when an image has been rejected. The elements which are summed to compute the dot product instep 126 are ordered in order to find the largest of these dot product elements. Then the elements of y making the largest contribution to the largest dot product element (through the equation shown in step 124) are identified. The image segment or segments associated with these elements of y are identified to the operator of the system (e.g., by an appropriate message on display 32). This tells the operator which image segment or segments are defective or most defective. This in turn may help the operator correct the problem which is causingproducts 12 to have an unacceptable appearance. - Step 160 merely makes it clear that
steps 120 through 150 are repeated for each new product image. - It will be understood that the foregoing is merely illustrative of the principles of this invention and that various modifications can be made by those skilled in the art without departing from the scope and spirit of the invention. For example, although steps 102-108 refer to the use of an initial sample of 200 acceptable images, a smaller or larger initial sample can be used if desired.
Claims (10)
- The method of determining whether an image is substantially like any of a plurality of sample images, comprising subdividing similarly each sample image into a plurality of segments (104), associating (104) with each segment of each sample image a value representative of the image information in that segment to produce a vector of the values for each sample image, each vector having a number of elements equal to the number of segments in each sample image, computing (106) a variance-covariance matrix (V) of the vectors, computing (106) a mean vector (µ) of said vectors, computing (108) a Cholesky decomposition matrix (A) of said variance-covariance matrix such that the product of the Cholesky decomposition matrix and its transpose matrix is equal to the variance-covariance matrix, subdividing (122) the image into a plurality of segments similar to the segments into which the sample images are subdivided, associating (122) with each segment of the image a value representative of the image in that segment to produce an image vector (y) of the values, the image vector (y) having a number of elements equal to the number of segments in the image, computing (124) a product vector Z equal to the product of the inverse (A⁻¹) of the Cholesky decomposition matrix and the difference between said image vector and the means vector (y - µ), computing (126) the dot product of the product vector (Z) with itself, comparing the dot product (Z . Z) to a predetermined value (130), and, identifying the image as substantially like a random sample of the sample images only if the dot product has a predetermined relationship to the predetermined values (130).
- A method according to claim 1, wherein the predetermined value is selected from a table of the cumulative distribution of central chi-square.
- A method according to claim 1 or 2, comprising recomputing (160) the variance-covariance matrix, the mean vector, and the Cholesky decomposition matrix with an image identified as substantially like a random sample of the sample images added to the plurality of sample images (140).
- A method according to claim 1, 2 or 3 wherein when the dot product (Z . Z) of the product vector with itself does not have the predetermined relationship to the predetermined value, the segment of the image making the largest contribution to said dot product is identified (150).
- A method according to claim 4, wherein the identification of the segment of the image making the largest contribution to the dot product (Z . Z) comprises identifying the largest of the dot product elements which are summed to produce the dot product (Z - Z), and identifying the segment of the image making the largest contribution to the largest of the dot product elements.
- Apparatus for determining whether an image is substantially like any of a plurality of sample images comprising means for subdividing similarly each sample image into a pluralty of segments, means for associating with each segment of each sample image a value representative of the image information in that segment to produce a vector of said values for each sample image, each vector having a number of elements equal to the number of segments in each sample image, means for computing a variance-covariance matrix (V) of the vectors, means for computing a mean vector (µ) of the vectors, means for computing a Cholesky decomposition matrix (A) of the variance-covariance matrix such that the product of the Cholesky decomposition matrix and its transpose matrix (A⁻¹) is equal to the variance-covariance matrix (V), means for subdividing the image into a plurality of segments similar to the segments into which the sample images are subdivided, means for associating with each segment of the image a value representative of the image in that segment to produce an image vector (y) of the values, the image vector having a number of elements equal to the number of segments in the image, means for computing a product vector (Z) equal to the product of the inverse of said Cholesky decomposition matrix (A⁻¹) and the difference between the image vector and said mean vector (y - µ), means for computing the dot product of the product vector with itself (Z . Z) , means for comparing the dot product to a predetermined value, and means for identifying the image as substantially like a random sample of the sample images only if the dot product has a predetermined relationship to the predetermined value.
- Apparatus according to claim 6, wherein the predetermuned value is selected from a table of the cumulative distribution of central chi-square.
- Apparatus according to claim 6 or 7, comprising means for recomputing the variance-covariance matrix, the mean vector, and the Cholesky decomposition matrix with an image identified as substantially like a random sample of the sample images added to the plurality of sample images.
- Apparatus according to claim 6, 7 or 8, comprising means for identifying the segment of the image making the largest contribution to the dot product if the dot product of the product vector with itself does not have the predetermined relationship to the predetermined value.
- Apparatus according to claim 9, wherein the means for identifying the segment of said image making the largest contribution to said dot product comprises means for identifying the largest of the dot product elements which are summed to produce the dot product, and means for identifying the segment of the image making the largest contribution to the largest of the dot product elements.
Applications Claiming Priority (2)
| Application Number | Priority Date | Filing Date | Title |
|---|---|---|---|
| US07/718,781 US5208870A (en) | 1991-06-21 | 1991-06-21 | Image inspection methods and apparatus |
| US718781 | 2003-11-20 |
Publications (1)
| Publication Number | Publication Date |
|---|---|
| EP0519595A2 true EP0519595A2 (en) | 1992-12-23 |
Family
ID=24887510
Family Applications (1)
| Application Number | Title | Priority Date | Filing Date |
|---|---|---|---|
| EP19920304202 Withdrawn EP0519595A2 (en) | 1991-06-21 | 1992-05-11 | Image inspection methods and apparatus |
Country Status (2)
| Country | Link |
|---|---|
| US (1) | US5208870A (en) |
| EP (1) | EP0519595A2 (en) |
Cited By (4)
| Publication number | Priority date | Publication date | Assignee | Title |
|---|---|---|---|---|
| EP0527546A2 (en) * | 1991-08-08 | 1993-02-17 | Philip Morris Products Inc. | Product appearance inspection methods and apparatus employing low variance filter |
| EP0834831A2 (en) * | 1996-10-02 | 1998-04-08 | D.S. Technical Research Co., Ltd. | Image inspection apparatus and method in plate making process |
| US6169600B1 (en) | 1998-11-20 | 2001-01-02 | Acuity Imaging, Llc | Cylindrical object surface inspection system |
| DE102014008846A1 (en) * | 2014-06-20 | 2015-12-24 | Focke & Co. (Gmbh & Co. Kg) | Method and device for applying and checking imprints on cigarette packets |
Families Citing this family (13)
| Publication number | Priority date | Publication date | Assignee | Title |
|---|---|---|---|---|
| US5497314A (en) * | 1994-03-07 | 1996-03-05 | Novak; Jeffrey M. | Automated apparatus and method for object recognition at checkout counters |
| US5822208A (en) * | 1994-04-12 | 1998-10-13 | Bay Instrumentation & Technology Co. | Method and apparatus for predicting errors in a manufacturing process |
| JP3325737B2 (en) * | 1995-03-09 | 2002-09-17 | 本田技研工業株式会社 | Quality control data processing equipment |
| US6345109B1 (en) * | 1996-12-05 | 2002-02-05 | Matsushita Electric Industrial Co., Ltd. | Face recognition-matching system effective to images obtained in different imaging conditions |
| NL1005705C2 (en) * | 1997-04-02 | 1998-10-05 | Koninkl Kpn Nv | Device for deriving position information about box-shaped objects and method in which the device is used. |
| US6075882A (en) * | 1997-06-18 | 2000-06-13 | Philip Morris Incorporated | System and method for optically inspecting cigarettes by detecting the lengths of cigarette sections |
| US5966218A (en) * | 1997-07-11 | 1999-10-12 | Philip Morris Incorporated | Bobbin optical inspection system |
| US6020969A (en) * | 1997-07-11 | 2000-02-01 | Philip Morris Incorporated | Cigarette making machine including band inspection |
| US6198537B1 (en) | 1997-07-11 | 2001-03-06 | Philip Morris Incorporated | Optical inspection system for the manufacture of banded cigarette paper |
| US6862363B2 (en) * | 2000-01-27 | 2005-03-01 | Applied Precision, Llc | Image metrics in the statistical analysis of DNA microarray data |
| US7330588B2 (en) * | 2001-01-25 | 2008-02-12 | Applied Precision, Llc | Image metrics in the statistical analysis of DNA microarray data |
| US6896427B2 (en) * | 2001-10-05 | 2005-05-24 | Shima Seiki Mfg., Ltd. | Automatic printer and pattern connecting position correcting printing method in printing pattern on printing object medium |
| WO2013155039A1 (en) * | 2012-04-10 | 2013-10-17 | Mahle Powertrain, Llc | Color vision inspection system and method of inspecting a vehicle |
Family Cites Families (6)
| Publication number | Priority date | Publication date | Assignee | Title |
|---|---|---|---|---|
| US4053056A (en) * | 1976-07-19 | 1977-10-11 | Amf Incorporated | Cigarette package inspection apparatus |
| IT1207600B (en) * | 1987-01-20 | 1989-05-25 | Gd Spa | METHOD FOR ELECTRIC OPTICAL CONTROL OF PACKAGES |
| US4965840A (en) * | 1987-11-27 | 1990-10-23 | State University Of New York | Method and apparatus for determining the distances between surface-patches of a three-dimensional spatial scene and a camera system |
| JPH01269034A (en) * | 1988-02-26 | 1989-10-26 | R J Reynolds Tobacco Co | Package inspection system |
| US4972494A (en) * | 1988-02-26 | 1990-11-20 | R. J. Reynolds Tobacco Company | Package inspection system |
| US5046111A (en) * | 1989-02-09 | 1991-09-03 | Philip Morris Incorporated | Methods and apparatus for optically determining the acceptability of products |
-
1991
- 1991-06-21 US US07/718,781 patent/US5208870A/en not_active Expired - Lifetime
-
1992
- 1992-05-11 EP EP19920304202 patent/EP0519595A2/en not_active Withdrawn
Cited By (6)
| Publication number | Priority date | Publication date | Assignee | Title |
|---|---|---|---|---|
| EP0527546A2 (en) * | 1991-08-08 | 1993-02-17 | Philip Morris Products Inc. | Product appearance inspection methods and apparatus employing low variance filter |
| EP0527546A3 (en) * | 1991-08-08 | 1994-12-21 | Philip Morris | Product appearance inspection methods and apparatus employing low variance filter |
| EP0834831A2 (en) * | 1996-10-02 | 1998-04-08 | D.S. Technical Research Co., Ltd. | Image inspection apparatus and method in plate making process |
| EP0834831A3 (en) * | 1996-10-02 | 2004-08-11 | D.S. Technical Research Co., Ltd. | Image inspection apparatus and method in plate making process |
| US6169600B1 (en) | 1998-11-20 | 2001-01-02 | Acuity Imaging, Llc | Cylindrical object surface inspection system |
| DE102014008846A1 (en) * | 2014-06-20 | 2015-12-24 | Focke & Co. (Gmbh & Co. Kg) | Method and device for applying and checking imprints on cigarette packets |
Also Published As
| Publication number | Publication date |
|---|---|
| US5208870A (en) | 1993-05-04 |
Similar Documents
| Publication | Publication Date | Title |
|---|---|---|
| US5208870A (en) | Image inspection methods and apparatus | |
| CA2061865C (en) | Methods and apparatus for optically determining the acceptability of products | |
| Silvén et al. | Wood inspection with non-supervised clustering | |
| US4574393A (en) | Gray scale image processor | |
| US7127099B2 (en) | Image searching defect detector | |
| US5189708A (en) | Methods and apparatus for optically determining the acceptability of products | |
| Elster | Detection of cracks in eggs using machine vision | |
| US5335293A (en) | Product inspection method and apparatus | |
| US5537670A (en) | Product appearance inspection methods and apparatus employing low variance filter | |
| US6577775B1 (en) | Methods and apparatuses for normalizing the intensity of an image | |
| Parkot et al. | Development of an automated quality control system of confectionery using a vision system | |
| US6259809B1 (en) | System and method for recognition of image information | |
| Xu et al. | Fiber-image analysis part I: Fiber-image enhancement | |
| Niskanen et al. | Experiments with SOM based inspection of wood | |
| JP3140177B2 (en) | Inspection method of inspection equipment | |
| KR100264374B1 (en) | Apparatus and method for inspecting optical lack of uniformity | |
| US20230316484A1 (en) | Inspection device | |
| Han et al. | Egg shell inspection using global image analysis | |
| JPH03160309A (en) | Image quality testing apparatus | |
| Cavalcante et al. | Automated dead/bright pixel distance measurement system on computer monitors | |
| Radovan et al. | Vision system for finished fabric inspection | |
| Melton et al. | Application of FPA test system technology to commercial inspection/measurement systems | |
| Karkanis et al. | Real-time quality inspection system for textile industries | |
| JPH10206344A (en) | Optical nonuniformity inspecting device and optical nonuniformity inspecting method | |
| Takahashi et al. | Automatic Visual Inspection System for Tape Carrier Package Using Unique Image Processing and Human Visual Support. |
Legal Events
| Date | Code | Title | Description |
|---|---|---|---|
| PUAI | Public reference made under article 153(3) epc to a published international application that has entered the european phase |
Free format text: ORIGINAL CODE: 0009012 |
|
| AK | Designated contracting states |
Kind code of ref document: A2 Designated state(s): AT BE CH DE DK ES FR GB GR IT LI LU MC NL PT SE |
|
| RIN1 | Information on inventor provided before grant (corrected) |
Inventor name: ENNIS, DANIEL M., |
|
| 18W | Application withdrawn |
Withdrawal date: 19940331 |
|
| STAA | Information on the status of an ep patent application or granted ep patent |
Free format text: STATUS: THE APPLICATION HAS BEEN WITHDRAWN |
|
| R18W | Application withdrawn (corrected) |
Effective date: 19940331 |