EP0353619A1 - Process and means for determination of local dye-concentrations and scattering parameters in animal and human tissue - Google Patents
Process and means for determination of local dye-concentrations and scattering parameters in animal and human tissue Download PDFInfo
- Publication number
- EP0353619A1 EP0353619A1 EP89113803A EP89113803A EP0353619A1 EP 0353619 A1 EP0353619 A1 EP 0353619A1 EP 89113803 A EP89113803 A EP 89113803A EP 89113803 A EP89113803 A EP 89113803A EP 0353619 A1 EP0353619 A1 EP 0353619A1
- Authority
- EP
- European Patent Office
- Prior art keywords
- curve
- wavelength range
- remission
- tissue
- hemoglobin
- Prior art date
- Legal status (The legal status is an assumption and is not a legal conclusion. Google has not performed a legal analysis and makes no representation as to the accuracy of the status listed.)
- Granted
Links
Images


Classifications
-
- A—HUMAN NECESSITIES
- A61—MEDICAL OR VETERINARY SCIENCE; HYGIENE
- A61B—DIAGNOSIS; SURGERY; IDENTIFICATION
- A61B5/00—Measuring for diagnostic purposes; Identification of persons
- A61B5/145—Measuring characteristics of blood in vivo, e.g. gas concentration, pH value; Measuring characteristics of body fluids or tissues, e.g. interstitial fluid, cerebral tissue
- A61B5/1455—Measuring characteristics of blood in vivo, e.g. gas concentration, pH value; Measuring characteristics of body fluids or tissues, e.g. interstitial fluid, cerebral tissue using optical sensors, e.g. spectral photometrical oximeters
-
- G—PHYSICS
- G01—MEASURING; TESTING
- G01N—INVESTIGATING OR ANALYSING MATERIALS BY DETERMINING THEIR CHEMICAL OR PHYSICAL PROPERTIES
- G01N21/00—Investigating or analysing materials by the use of optical means, i.e. using sub-millimetre waves, infrared, visible or ultraviolet light
- G01N21/17—Systems in which incident light is modified in accordance with the properties of the material investigated
- G01N21/25—Colour; Spectral properties, i.e. comparison of effect of material on the light at two or more different wavelengths or wavelength bands
- G01N21/31—Investigating relative effect of material at wavelengths characteristic of specific elements or molecules, e.g. atomic absorption spectrometry
- G01N21/314—Investigating relative effect of material at wavelengths characteristic of specific elements or molecules, e.g. atomic absorption spectrometry with comparison of measurements at specific and non-specific wavelengths
Definitions
- the invention relates to a method for determining local dye concentrations in animal and human tissues, in which light of different wavelengths is radiated into a partial area of the tissue, at least a portion of the backscattered light is collected and the remission is determined as a function of the wavelength and the Concentration of dyes is determined from the spectral reflectance.
- “Local” concentration is to be understood here in particular and, for example, the intracapillary area.
- “Dyes” are understood to mean, on the one hand, tissue-specific dyes (pigments), in particular hemoglobin, but also cytochromes, but also added dyes, in which the washing-out kinetics are then examined, for example.
- Light of different wavelengths is usually the mixed light of a lamp (e.g. a xenon high-pressure lamp), but can e.g. B. also be the light of a tunable laser light source.
- the light is usually only spectrally broken down after the remission and the intensity is evaluated as a function of the wavelength, the spectrally different initial intensities being taken into account by calculation.
- a “partial area” is understood to mean an area with a relatively small surface area, typically in the range from 50 to 500 ⁇ m diameter.
- the depth extension in the tissue depends on numerous factors and is (drop to 1 / e) in the order of - 150 ⁇ m.
- the tissue volume from which the remission is obtained is both tissue-specific and device-specific and furthermore also dependent on the hemoglobin concentration.
- the invention therefore provides a method and a device which make it possible to determine the dye concentration and other scattering factors in the tissue, in particular the hemoglobin absolute concentration, much more precisely.
- Basis remission here means the remission of the hemoglobin-free tissue, as can be determined, for example, in the case of a hemoglobin-free perfusion of the tissue.
- tissue-specific is understood to mean the special features that result from the special type of tissue (e.g. rat liver or human skin). “Tissue-specific” refers to values and curves in which the specific measurement of at least one of the two remission curves has already been included, even if it is only due to the selection from a family of curves determined in advance which is influenced by the measurement.
- the solution according to the invention has the particular advantage that the basic remission is relatively undisturbed in the first wavelength range, where the hemoglobin has a window, and the influence of the basic remission in the second wavelength range, where it is generally completely overlaid by the influence of hemoglobin , can be estimated and eliminated accordingly.
- the more precise values obtained in this way can be refined in further process steps.
- a set of tissue-specific standard basic remission curves is obtained in advance on tissue samples of the same tissue type, and the measured remission curve in the first wavelength range, the nearest branch in the first wavelength range from the family of standard basic remission curves and the associated branch of this standard basic remission curve in the second wavelength range selected as the tissue basic standard remission curve.
- Standard basic remission curves are understood to mean basic remission curves that "in advance" on a large number of tissues of the type of tissue to be measured, e.g. B. were measured and stored by hemoglobin-free perfusion.
- curves are determined which, as a family of curves, cover a large range of remissions at one wavelength without the individual curves intersecting. The curve that comes closest to the measured curve in the first wavelength range is now selected from the family and the other branch of this selected (tissue type-specific) standard basic remission curve in the second wavelength range becomes a tissue person-specific (standard) basic remission curve there.
- a standard basic remission curve from the family of previously obtained standard basic remission curves in the first wavelength range is assigned to the measured remission curve in such a way that the standard basic remission curve with the value at a predetermined isosbestic wavelength in the first wavelength range, the same as or next to it measured remission value at this isosbestic wavelength is selected, and the value of the selected standard basic remission curve at a predetermined isosbestic wavelength in the second wavelength range is used as the value for determining the hemoglobin concentration.
- the values at the isosbestic wavelengths are taken because there is no additional error due to the (still unknown) oxygenation of the hemoglobin. However, these values are sufficient for the stated purpose, because the remission value of the remission curve adjusted for the basic remission at an isosbestic wavelength is sufficient to determine the concentration from the remission value with an appropriately calibrated device.
- an averaged tissue type-specific standard remission curve is preferably obtained in advance on tissue samples of the same tissue type, and the measured remission curve in the first wavelength range is related to the averaged standard basic remission curve, and from the ratio obtained and the part of the tissue type-specific averaged standard remission curve in the obtained a tissue-specific standard basic remission curve in the second wavelength range in the second wavelength range.
- a typical curve is now determined from a large number of preliminary dimensions of the basic remission of the tissue (for example by means of hemoglobin-free perfusion) over both wavelength ranges, which is therefore also referred to as the "averaged" standard basic remission curve (although the curves of the Curve family in turn can also have arisen from averaging).
- the averaging of the averaged standard basic remission curve in the first wavelength range to the measured remission curve (in the first wavelength range) is such that the value of the averaged standard basic remission curve in the first wavelength range is at a predetermined isosbestic wavelength in the first wavelength range measured remission value at this isosbestic wavelength is related, and based on the ratio obtained from the value of the average standard remission curve at a predetermined isosbestic wavelength in the second wavelength range, a remission value at this isosbestic wavelength is obtained, which is used as a value for determining the hemoglobin concentration .
- the reflectance value which allows conclusions to be drawn about the hemoglobin concentration, is generally determined by subtracting the value obtained at the isosbestic wavelength in the second wavelength range from the measured reflectance value at this wavelength.
- the measured curve in the first wavelength range is preferably corrected on the basis of the value obtained for the hemoglobin concentration, as a result of which a further, improved approximation for the tissue-specific basic remission in the first wavelength range is obtained.
- the measured remission curve in the first wavelength range which still contained the (however slight) influence of the hemoglobin concentration in the above method, was a "zero approximation" of a tissue-specific basic remission curve in the first wavelength range.
- This zero approximation can now be improved by eliminating the hemoglobin concentration (which in turn is known from the above method steps in a first approximation) from the curve.
- the further approximation obtained in this way is advantageously introduced into the process steps described above instead of the measured remission curve.
- Steps 2 to 4 are therefore particularly preferably carried out with the improved curve instead of the measured remission curve, as a result of which a better approximation for the hemoglobin concentration and a further improved curve are obtained as tissue-specific basic remission in the first wavelength range.
- the above steps 2 to 4 are preferably repeated n times, on the basis of the respectively improved values or curves.
- the range from 630 nm to 100 nm is preferred as the wider first wavelength range.
- the wavelength range from 750 nm to 850 nm is preferred as the narrower first wavelength range. In these areas, hemoglobin has a window, so its influence on remission is minimal.
- the wavelength range from 500 nm to 620 nm is preferred as the wider second wavelength range.
- the range from 550 nm to 570 nm is preferred as the narrower second wavelength range.
- the influence of hemoglobin on tissue emission is great in the latter two areas.
- the invention also relates to a method for determining the oxygenation of hemoglobin, in particular using one or more of the curves from one or more of the above methods.
- the determination of the oxygenation of hemoglobin with high accuracy is also of particular importance when monitoring life processes using spectrophotometry.
- a “pure” hemoglobin curve is obtained from a tissue-specific standard basic remission curve and the measured remission curve in the second wavelength range, with a group of “pure” beforehand by superimposing two pure standard hemoglobin curves, namely for 0% and 100% oxygenation, with different weights "Hemoglobin curves in the range of 0% to 100% oxygenation is obtained, and the" pure "hemoglobin curve, after normalization to 1, is compared with the standard hemoglobin curves of the group, which are also normalized, the most suitable is selected, and their oxygenation as the value of the oxygenation of the measured curve assumed.
- a two-dimensional is carried out beforehand on the basis of a large number of measurements on the same type of tissue, with hemoglobin of different concentration and different oxygenation Generated by comparison curves, the comparison curves with hemoglobin concentrations in the vicinity of the determined concentration are searched over the entire oxygenation range, and the most suitable of the comparison curves provides an assumed value for the oxygenation and an improved value for the concentration.
- the values for the concentration and oxygenation obtained in the manner just described are preferably used in the step described to obtain an improved tissue-specific basic remission curve.
- the measured remission curve from the second wavelength range is normalized to the next matching curve from the two-dimensional family mentioned above, which is used to determine the oxygenation, the difference between the two curves is plotted as a function of the wavelength and as a measure of the distortion to determine the penetration depth of the incident light, ie of the volume V detected by the light.
- this distortion can be used as a measure of the depth of penetration.
- Corresponding previously determined distortion curves are again stored, the corresponding volume is assigned to them, and then the distortion curve obtained by the comparison is assigned to the closest matching curve from the stored distortion curves and the volume is thus determined.
- the Er Weg micro-optical fiber spectrophotometer is particularly preferably used for the above measurements. This is explained in more detail below.
- the interference waveform filter disc used therein preferably has both the first wavelength range and the second wavelength range. As a result, the measured remission curves of the first and the second wavelength range can be obtained in one revolution of the disk.
- the microlight guide spectrophotometer preferably has means for absolute calibration of the illuminating and detecting system. Absolute calibration is particularly important because the preliminary dimensions, which should be carried out with the same device anyway or have to be converted for specific devices, must take place under which defined conditions comparable to the concrete measurement must take place. Such means are in particular a white standard and a normal light source, which will be explained below.
- the invention also relates to a device for determining size changes in tissue particles.
- a device for determining size changes in tissue particles The observation of such changes, e.g. the size change of mitochondria is of particular practical importance since they e.g. enables early detection of brain edema.
- This is achieved by means of a device with a light guide radiating light into the tissue, at least two radially differently spaced light guides receiving the backscattered light, which are preferably arranged linearly on both sides of the illuminating light guide, and an evaluation unit for each of the light guides that determine the temporal Changes in the backscattered intensity relative to the other light guides are detected and evaluated.
- Such an evaluation unit can be constructed analogously to that of the Er Weg microlight guide spectrophotometer. A flattening or other deformation of the backscattering characteristic can then be recognized, which in turn allows conclusions to be drawn about the change in the particle size.
- the invention also relates to a device for determining local dye concentrations in animal and human tissues, with an illuminating device with which light of different wavelengths can be irradiated into a partial area of the tissue, a light-receiving device with which at least part of the backscattered light can be collected is, and an evaluation device that determines the reflectance as a function of the wavelength and determines the concentration of dyes from the spectral reflectance.
- the illuminating device, the light-receiving device and the evaluation device are explained later using examples of possible embodiments.
- the more precise determination of the dye concentrations is achieved in that the illuminating device radiates radiation from a first wavelength range in which the influence of hemoglobin on the reflectance is low in one step and the evaluation device the remission in this (first) wavelength range determines that the illuminating device radiates light from a second wavelength range, in which the remission is dominated by the influence of hemoglobin, into the same partial area of the tissue in a separate step and the evaluation device transmits the remission into This (second) wavelength range determines that the device, based on the remission in the first wavelength range and at least one previously obtained, stored tissue-type-specific standard remission curve for both wavelength ranges, provides a tissue-specific standard basic remission Curve determined for the second wavelength range, and that the device based on the determined tissue-specific standard basic remission curve and the measured remission in the second wavelength range provides a (first) value for the hemoglobin concentration.
- the device has preferably stored a family of tissue-specific standard basic remission curves obtained in advance from tissue samples of the same tissue type, and a computer assigns the measured remission curve in the first wavelength range to the next matching branch in the first wavelength range from the family of standard basic remission curves and selects the associated branch of this standard - Basic remission curve (which has the closest matching branch in the first wavelength range) in the second wavelength range as a tissue-specific standard basic remission curve.
- the computer preferably assigns the device a standard basic remission curve from the family of previously obtained standard basic remission curves in the first wavelength range to the measured remission curve (in the first wavelength range) in such a way that it calculates the standard basic remission curve with the value at a predetermined isosbestic wavelength in the first Select the wavelength range that is equal to or closest to the measured reflectance value at this isosbestic wavelength, and use the value of the selected standard basic remission curve at a predetermined isosbestic wavelength in the second wavelength range as the value for determining the (first) hemoglobin concentration.
- the computer of the device preferably has stored an averaged tissue type-specific standard basic remission curve obtained in advance from tissue samples of the same tissue type and relates the measured remission curve in the first wavelength range to the averaged standard basic remission curve, and forms from the obtained ratio and the part of the tissue type-specific averaged Standard basic remission curve in the second wavelength range a tissue-specific standard basic remission curve in the second wavelength range.
- the computer of the device relates the averaged standard basic remission curve in the first wavelength range to the measured remission curve (in the first wavelength range) in such a way that it measures the value of the averaged standard basic remission curve in the first wavelength range at a predetermined isosbestic wavelength in the first wavelength range
- the remission value at this isosbestic wavelength is related and, based on the ratio obtained from the value of the mean standard basic remission curve at a predetermined isosbestic wavelength in the second wavelength range, provides a remission value at this isosbestic wavelength which is used as a value for determining the (first) hemoglobin concentration .
- the computer of the device is particularly preferably set up and constructed such that it corrects the measured curve in the first wavelength range on the basis of the (first) value obtained for the hemoglobin concentration, as a result of which it provides a further, improved (1st) approximation for the tissue-specific basic remission in the first wavelength range forms ((see p. 19, 3rd paragraph)).
- the computer of the device is preferably set up and constructed in such a way that it uses the improved curve ("(1st) approximation" of the previous paragraph) instead of the measured remission curve to carry out steps 2 to 4 (counting see claims), whereby a better (second) approximation for the hemoglobin concentration and a further improved curve (2nd approximation) than tissue-specific basic remission in the first wavelength range is formed ((see p. 19, 4th paragraph)).
- the device has the computer, which repeats steps 2 to 4 n times, on the basis of the respectively improved values or curves.
- the first wavelength range preferably ranges from 630 nm to 1000 nm.
- the first wavelength range particularly preferably ranges from 750 nm to 850 nm.
- the second wavelength range preferably ranges from 500 nm to 620 nm.
- the second wavelength range particularly preferably ranges from 550 nm to 570 nm.
- the device contains an interference gradient filter disk, which contains the corresponding wavelength ranges, preferably combined in a single disk.
- a selection of certain wavelength ranges can also be made in that, since the evaluation device takes into account the respective position of the interference waveform filter disk, only the desired wavelengths (or the measured values at these wavelengths) are processed by the evaluation device.
- the invention also relates to a device for determining the oxygenation of hemoglobin, in particular one in which one or more of the curves obtained according to the invention by a device as described above are stored.
- a device for determining the oxygenation of hemoglobin in particular one in which one or more of the curves obtained according to the invention by a device as described above are stored.
- the computer of the device forms a "pure" hemoglobin curve from a tissue-specific standard basic remission curve (possibly nth approximation) and the measured remission curve in the second wavelength range, in that the computer beforehand by superimposing two pure standard hemoglobin curves , namely for 0% and 100% oxygenation, with different weighting has formed a group of "pure" hemoglobin curves in the range 0% to 100% oxygenation, and the "pure” hemoglobin curve, after normalization to 1, with the likewise standardized curves of the group compares, selects the next suitable one and supplies its oxygenation as the value of the oxygenation of the measured curve.
- the invention also relates to a device for determining the oxygenation of hemoglobin, in which one of the concentration values (possibly nth approximation) and in particular the curves which were formed by a device according to the invention described above are stored.
- this is characterized in that the device uses a large number of measurements on the same type of tissue, with hemoglobin of different concentration and different oxygenation, to create a two-dimensional set of comparison curves (see FIG.
- the comparison curves with hemoglobin concentrations in the vicinity of the determined concentration is searched over the entire oxygenation range, and from the best-fitting comparison curve forms an assumed value for oxygenation and an improved value (possibly n + 1th approximation) for the concentration.
- the device is particularly preferably set up in such a way that it further uses the values for the concentration (n + 1 th approximation) and the oxygenation to obtain an improved tissue-specific basic remission curve.
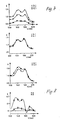
- the device is particularly preferably set up in such a way that it normalizes the measured remission curve (in the second wavelength range) to the closest matching curve from the two-dimensional family (see FIG. 7), and plots the difference between the two curves as a function of wavelength (see FIG. 8). and used as a measure of the distortion to determine the penetration depth of the radiated light, ie the volume V detected by the light ((see p. 21, last paragraph)).
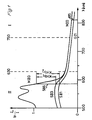
- Fig. 1 shows on the right a first measured curve MI0 (M should measure, I should indicate the wavelength range I (here: 750-850 nm), and the number 0 indicates that it is a curve that is considered the zero approximation of the basic remission curve can be considered).
- I0 / I is used here as a measure of the remission.
- the curve was measured on rat liver using the Er Weg microlight guide spectrophotometer, which u. a. in the dissertation "Optical Scattering on Biological Particles and Cells", Er Weg 1985, of one of the inventors, Frank, is explained in more detail, but was also described below.
- the curve shows only a slight influence of hemoglobin, since hemoglobin has a window in area I.
- Basis remission here means the remission of the hemoglobin-free tissue, as can be determined, for example, in the case of a hemoglobin-free perfusion of the tissue. This basic remission is still tissue-specific, it depends on the redox state of the remaining cell pigments and any added dyes and is also, if only to a small extent, tissue-specific. It is therefore necessary to determine the specific "true" basic remission as precisely as possible in order to be able to determine the concentration, oxygenation and redox state of various pigments / dyes.
- the curve MI0 (viewed systematically in a method step 1.1) represents a (zero) approximation in the method, because it still has an influence of the hemoglobin concentration (KHb) as well as the oxygenation of the, in the selected wavelength range I of 750 to 850 nm Hemoglobin (HbO2 / Hb) is dependent.
- an associated standard basic remission curve in the wavelength range II is selected for the measured basic remission curve MI0.
- the isosbestic wavelength of the hemoglobin (815) nm was selected in the wavelength range I, since the influence of the oxygenation of the hemoglobin on the reflectance in the wavelength range I is greater than the influence of the oxidation of the cytochromes, which influence only with an oxygen partial pressure of less when 5 Torr changes noticeably.
- the choice of the isosbestic wavelength makes one independent of the oxygenation of the hemoglobin (still unknown in this step).
- the error of the zero approximation, the measured curve MI0 only depends on the concentration of the hemoglobin.
- the value of the sequence at the Isosbestes wavelength is selected in the wavelength range I, which is equal to or closest to the measured value at the isosbestic wavelength on the curve MI0 and by means of this Table 2 the associated value of the sequence in the wavelength range II, and thus the entire branch is also assigned to the corresponding standard remission curve in II.
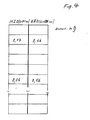
- a single, averaged from all measured standard remissions, "averaged standard remission curve" is formed and there are tables for the differences (or factors) in relation to other remissions at the isosbestic wavelength in the area I (using a A large number of standard basic remission curves running over both wavelength ranges are created, which assign a difference (or a factor) to a difference (or a factor) for wavelengths in the second wavelength range, particularly there again at an isosbestic wavelength.
- the assignment alternatively (step 2.2) the difference (or the ratio) of the remission of the measured curve MI0 and the averaged standard basic remission curve is determined at the isosbestic wavelength, and the averaged standard basic remission curve in the second wavelength range at the the isosbestic wavelength is loaded with the factor or summand associated with the table in order to arrive at a curve, or at least its value, at an isosbestic wavelength in the wavelength range II which is the 0th approximation of the (standard) basic remission in the second wavelength range, II, SII0 , represents.
- an isosbestic wavelength (specifically 586 nm in the exemplary embodiment) is also selected in order to be independent of the still unknown oxygenation.
- the measured curve in the wavelength range II shows in the left half a remission curve obtained in the same passage of an interference filter disc (see below) (measured systematically in a step 1.2.) At the same tissue site.
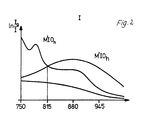
- MII0 the standard basic remission curve SII0 belonging to the measured value determined in the first wavelength range I, which is also available as a table as described above (a section is shown in FIG. 2), or from the comparison of the averaged standard basic remission curve in Area I is drawn with the curve MI0, as is alternatively described above.
- the total remission measured (curve MII0), which is composed of the basic remission (represented in zero approximation by the standard basic remission) and the hemoglobin-dependent remission, is subtracted from the value of the standard basic remission curve SII0 at the concrete isosbestic wavelength (586 nm) from the value of the measured remission curve MII0 the hemoglobin remission and thus a measure of the hemoglobin concentration in a first approximation, KHb1, (in a third step). This gives a first approximation, KHb1, for the concentration of hemoglobin.
- This concentration value KHb1 is used to correct the measured curve in the area I, MI0, and one obtains a corresponding curve of the first, better approximation, GI1, for the basic remission by (in a 4th step) at the 815 nm isosbestic wavelength at this concentration for this wavelength subtracts the (additional) amplitude value of MI0 caused by the hemoglobin concentration.
- the resulting value is used with the help of the table (FIG. 4) (or the alternative method step 2.2) to select a more suitable standard basic remission curve SII1 (see FIG. 1 left), which in turn improves the value of the concentration of the Hemoglobin serves at a KHb2 value.
- This in turn serves to determine an improved base remission curve in the area I, GI2. By inserting it several times in this way, one can finally achieve a greatly improved value for the concentration of hemoglobin, KHbn.
- the oxygenation is determined, if necessary with a simultaneous improvement in the value for the concentration.
- the standard base remission curve corresponding to the last iteration level is subtracted from the measured curve MII0 in order to obtain the "pure" hemoglobin curve, HII0.
- the adjusted measurement curve, HII0 after normalization to 1, is compared with the also normalized curves of this family and the next suitable one is selected (e.g. using the least squares method).
- the degree of oxygenation of the selected curve is assumed to be the degree of oxygenation of the measured curve MII0.
- the measured curve MII0 is now compared with the curves in the table. For example, and preferably the column corresponding to the first approximation of the hemoglobin concentration and one or, in the exemplary embodiment, two neighboring columns each, are searched for all values of the oxygenation.
- the integral of the area under the standard remission curves can be compared with the integral under the measured curve MII0.
- the curves are compared using the least squares method.
- the field of the matrix with the optimally fitting curve gives a concentration value of the hemoglobin, second approximation, KHb2, and an oxygenation level of the hemoglobin, first approximation, KHbO21.
- the method can be continued until a convergence sufficient in terms of the realistic measurement accuracy is achieved.
- the oxygenation of the hemoglobin also suggests the oxidation of the cytochromes. Furthermore, the base remission curve after subtracting the hemoglobin influence allows a more precise determination of other parameters in the tissue.
- Oxygen partial pressures ⁇ 5 Torr which are measured in the tissue, must be based on other basic remission curves, but this does not change the basic process.
- Fig. 2 shows on an enlarged scale the curve MI0 corresponding measured curves from the wavelength range I, once with high oxygenation of the hemoglobin (M'I0 h ) and once with low oxygenation of the hemoglobin (M'I0 n ).
- the 6 schematically shows the illuminating lamp 2, the illuminating light guide 4, the detecting light guide 6 and the photomultiplier 8.
- the volume into which the illuminating light guide 4 shines in the tissue is for a high Hb concentration with Eh and for a low one indicated with En; the volume from which, taking into account the sensitivity of the photomultiplier 8, the detecting light guide 6 can receive light, is denoted by R h or R n .
- the cutting volume, V h or V n is the volume on which the concentration measurement is based. Due to the high luminance, quasi-diffuse lighting is achieved.
- Information about the volume recorded under certain conditions can also be generated in tabular form.
- the corresponding values can be obtained by measurements on sections of the tissue or in scattering chambers with simulation of the tissue.
- concentration values are based on volumes that result from the tables as empirical values. However, the volumes can also be corrected using a special procedure.
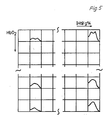
- the distortion of the measured hemoglobin curve MII0 compared to the standard remission curve RSII1 determined from the matrix (table) 2 (see FIG. 5) is used as a measure of the penetration depth and thus the volume measured.
- the measured hemoglobin curve MII0 is normalized to the determined standard curve at the isosbestic wavelength and the difference is plotted depending on the wavelength.
- FIG. 7 shows (schematically) an example of a possible standard remission curve RSII1 with two examples of possible measurement curves MII0 and FIG. 8 the resulting difference or distortion curves.
- the volume can be determined and in turn used as a correction factor for the previously determined values of concentration and oxygenation.
- the invention also enables the change in particle sizes in the tissue to be determined. This provision is of particular practical importance. A change in size of the mitochondria, for example, can be determined with it.
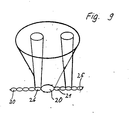
- a preferred embodiment of the device is shown schematically in FIG. 9.
- the device consists of an arrangement of a centrally arranged illuminating light guide 20 with a diameter of approx. 250 ⁇ m and linearly arranged detecting light guides, in the application example with a diameter of approx. 70 ⁇ m.
- This allows, if necessary after calculating the angular distortion resulting from the given arrangement, the distribution of the backscattered light in a cross section of the backscattering volume.
- a comparison of the reflectance values obtained from the various detecting light guides 21 to 30 allows a conclusion to be drawn about the change in the particle size over time.
- 11 graphically shows the change in the distribution of the light, which can also be used in evaluating the relative remissions on the individual or pairs or circles of receiving light guides (here: 21 to 30).
- a central illuminating light guide 20 and an array of, for example, 10 ⁇ 10 receiving light guides is provided (cf. also FIG. 12). This enables the measurement of entire topographies of oxygenation and dye distributions.
- the information coming from the respective individual light guides is first evaluated individually, as described in detail above for a receiving light guide, and the results then result in a topogram of the HB concentration, a topogram of the HbO2 concentration and basic remission topograms.
- the light guide can be queried at the same time, which then requires a corresponding number of the evaluation units described below. If a complete spectrum is short in both wavelength ranges (approx. 1/100 s), the light guides can also be queried in succession, which results in a time difference of approx. One second, which can often be accepted.
- the evaluation of the angle dependency can be used to determine spatial asymmetries.
- illuminating light guides 32-38 are also located on the side edges, in the middle thereof, as a result of which further information about the scattering behavior in the tissue can be obtained.
- the irradiation volume of the central light guide and the volumes detectable by the respective detecting light guides are shown schematically in the drawing using individual examples.
- FIG. 13 shows the basic structure of the Er Weg microlight guide spectrophotometer.
- the light from a xenon high-pressure lamp 40 e.g. XBO 75 W / 2, Osram
- a supply device 42 stabilized power supply unit
- This is combined with the detecting light guide 6 in such a way that the respective end faces lie in one plane and directly next to one another (not shown in FIG. 13).
- the pair of light guides (or the arrangement from FIG. 9 or FIG. 12) is then placed on the tissue surface 46.
- the light reaches an interference curve filter disk 48 via the receiving light guide 6.
- the interference curve filter disks in contrast to the interference curve filter disks previously used for tissue spectrophotometry, it contains the wavelength range from 500 up to 850 nm. It can be seen that the curves are then measured MI0 and MII0 can take place practically simultaneously and the order depends only on the direction of rotation of the filter disc.
- the light of the wavelength range just passed through the interference waveform filter disk 48 (the resolution is approximately 2 nm) is passed via a light guide 50 to a photomultiplier 52. Via an amplifier system 54, the signal is sent to an analog / digital converter 56 and, after digitization, to a computer (also in 56) for further processing.
- a decoding disk 60 is arranged on the shaft of the motor 58 driving the filter disk 48 and outputs the control signals to an EPROM 62.
- the EPROM 62 converts the control signals into trigger signals for the digitization of the measurement signal by the A / D converter 56.
- the decoding disk generates a pulse which marks the start of each disk rotation and which initiates the digitization of the A / D converter.
- the present method works with absolute values of remission. Special attention is therefore paid to the calibration of the entire arrangement.
- the spectral distribution of the light from the xenon arc lamp, the transmission properties of the optical elements (lenses, light guides) and the spectral sensitivity of the photomultiplier result in a wavelength-dependent response function for white light. This can be measured by the spectrum of a white standard, here BaSO4, using the known device shown in FIG. 14.
- the illuminating (4) and the receiving (6) light guide are placed vertically in a drop of immersion liquid 70 (0.9% NaCl) on a glass plate 72 in the arrangement also used for the measurement.
- the glass plate creates a fixed distance from the white standard 74.
- the intersection 76 of the light cone corresponds to the volume V.
- a wavelength-dependent dark curve must be saved.
- an absolute calibration e.g. of the photomultiplier and others
- a normal light source preferably in the form of beta light
- zinc sulfide or another radioluminescent substance is excited by radioactive decay products, in particular beta rays of the tritium.
Abstract
Description
Die Erfindung betrifft ein Verfahren zur Bestimmung von lokalen Farbstoff-Konzentrationen in tierischen und menschlichen Geweben, bei dem Licht unterschiedlicher Wellenlängen in einen Teilbereich des Gewebes eingestrahlt wird, zumindest ein Teil des rückgestreuten Lichtes aufgefangen und die Remission in Abhängigkeit von der Wellenlänge bestimmt wird und die Konzentration von Farbstoffen aus dem spektralen Remissionsgrad bestimmt wird.The invention relates to a method for determining local dye concentrations in animal and human tissues, in which light of different wavelengths is radiated into a partial area of the tissue, at least a portion of the backscattered light is collected and the remission is determined as a function of the wavelength and the Concentration of dyes is determined from the spectral reflectance.
Ein solches Verfahren ist z.B. aus der Dissertation "Bestimmung von Hämoglobin-Oxygenierung und relativer Hämoglobin-Konzentration in biologischen Systemen durch Auswertung von Remissionsspektren mit Hilfe der Kubelka-Munk-Theorie" von Wolfgang Dümmler, Erlangen 1988, bekannt.Such a method is known, for example, from the dissertation "Determination of hemoglobin oxygenation and relative hemoglobin concentration in biological systems by evaluating reflectance spectra with the aid of the Kubelka-Munk theory" by Wolfgang Dümmler, Erlangen 1988.
Unter "lokaler" Konzentration soll hier insbesondere und beispielsweise der intrakapilläre Bereich verstanden werden.“Local” concentration is to be understood here in particular and, for example, the intracapillary area.
Unter "Farbstoffen" sollen einerseits gewebeeigene Farbstoffe (Pigmente), insbesondere Hämoglobin, aber auch Zytochrome, aber auch zugeführte Farbstoffe, bei denen dann bspw. die Auswaschkinetik untersucht wird, verstanden werden.“Dyes” are understood to mean, on the one hand, tissue-specific dyes (pigments), in particular hemoglobin, but also cytochromes, but also added dyes, in which the washing-out kinetics are then examined, for example.
"Licht unterschiedlicher Wellenlängen" ist in der Regel das Mischlicht einer Lampe (z. B. einer Xenon-Hochdrucklampe), kann aber z. B. auch das Licht einer abstimmbaren Laserlichtquelle sein. Das Licht wird meist erst nach der Remission spektral zerlegt und die Intensität in Abhängigkeit von der Wellenlänge ausgewertet, wobei die spektral unterschiedlichen Anfangsintensitäten rechnerisch berücksichtigt werden."Light of different wavelengths" is usually the mixed light of a lamp (e.g. a xenon high-pressure lamp), but can e.g. B. also be the light of a tunable laser light source. The light is usually only spectrally broken down after the remission and the intensity is evaluated as a function of the wavelength, the spectrally different initial intensities being taken into account by calculation.
Unter einem "Teilbereich" wird ein Bereich mit verhältnismäßig kleiner Oberfläche, typischerweise im Bereich von 50 - 500 µm Durchmesser, verstanden. Die Tiefenerstreckung im Gewebe hängt von zahlreichen Faktoren ab und liegt (Abfall auf 1/e) in der Größenordnung von - 150 µm. Wie weiter unten noch ausgeführt werden wird, ist aber das Gewebevolumen, aus dem die Remission erhalten wird, sowohl gewebespezifisch als auch gerätespezifisch und ferner noch abhängig von der Hämoglobin-Konzentration.A “partial area” is understood to mean an area with a relatively small surface area, typically in the range from 50 to 500 μm diameter. The depth extension in the tissue depends on numerous factors and is (drop to 1 / e) in the order of - 150 µm. As will be explained further below, however, the tissue volume from which the remission is obtained is both tissue-specific and device-specific and furthermore also dependent on the hemoglobin concentration.
Wie in der genannten Dissertation von Dümmler näher ausgeführt, stößt jedoch bspw. die Absolutmessung der Hämoglobinkonzentration auf beträchtliche Schwierigkeiten. Die Erfindung schafft daher ein Verfahren und eine Vorrichtung, die es ermöglichen, die Farbstoff-Konzentration und andere Streufaktoren im Gewebe, insbesondere die Hämoglobin-Absolutkonzentration, wesentlich genauer zu bestimmen.As explained in more detail in Dümmler's dissertation, however, the absolute measurement of the hemoglobin concentration encounters considerable difficulties. The invention therefore provides a method and a device which make it possible to determine the dye concentration and other scattering factors in the tissue, in particular the hemoglobin absolute concentration, much more precisely.
Dies wird erfindungsgemäß dadurch erreicht, daß in einem Schritt Strahlung aus einem ersten Wellenlängenbereich, in dem der Einfluß des Hämoglobins auf die Remission gering ist, eingestrahlt und die Remission in diesem Wellenlängenbereich bestimmt wird, daß in einem gesonderten Schritt Licht aus einem zweiten Wellenlängenbereich, in dem die Remission vom Einfluß des Hämoglobins dominiert wird, in den gleichen Teilbereich des Gewebes eingestrahlt wird und die Remission in diesem Wellenlängenbereich bestimmt wird, daß, anhand der Remission im ersten Wellenlängenbereich und mindestens einer vorab gewonnenen gewebeartspezifischen Standard-Grundremissionskurve für beide Wellenlängenbereiche eine gewebepersonenspezifische Standard-Grundremissionskurve für den zweiten Wellenlängenbereich ermittelt wird, und daß anhand der ermittelten gewebepersonenspezifischen Standard-Grundremissionskurve und der gemessenen Remission im zweiten Wellenlängenbereich ein Wert für die Hämoglobinkonzentration gewonnen wird.This is achieved according to the invention in that in one step radiation from a first wavelength range in which the influence of hemoglobin on the remission is small is irradiated and the remission in this wavelength range is determined by in a separate step light from a second wavelength range in where the remission is dominated by the influence of hemoglobin, is irradiated into the same sub-area of the tissue and the remission is determined in this wavelength range that, based on the remission in the first wavelength range and at least one previously obtained tissue-specific standard basic remission curve for both wavelength ranges, a tissue-specific standard - Basic remission curve for the second wavelength range is determined, and that a value for the is determined on the basis of the tissue-specific standard basic remission curve determined and the measured remission in the second wavelength range Hemoglobin concentration is obtained.
Die Einteilung der Schritte, wie sie z. B. der Nummerierung in den Ansprüchen zu entnehmen ist, erfolgte nach systematischen Gesichtspunkten. Ziffern nach Doppelpunkt sollen Alternativen des in der ersten Ziffer angegebenen Schrittes bedeuten, nachfolgende Ziffern ohne Doppelpunkt sind Unterschritte eines Hauptschrittes. Die Lichtmessung in den beiden Wellenlängenbereichen I und II, 1.1. und 1.2. ist zwar systematisch ein unterschiedlicher (Unter-)Schritt, erfolgt aber in der Praxis gleichzeitig, wobei die Reihenfolge nicht von Bedeutung ist. Die Grundmessungen (0. Schritte) erfolgen in aller Regel vor ("vorab") den konkreten Messungen, können im Prinzip aber auch nachfolgend durchgeführt werden, da die konkreten Meßwerte ebenfalls abgespeichert werden können.The classification of the steps, such as. B. the numbering in the claims can be seen from a systematic point of view. Digits after a colon are intended to mean alternatives to the step specified in the first digit, subsequent digits without a colon are sub-steps of a main step. The light measurement in the two wavelength ranges I and II, 1.1. and 1.2. is systematically a different (sub) step, but in practice takes place simultaneously, whereby the order is not important. The basic measurements (0th steps) are usually carried out before ("in advance") the concrete measurements, but in principle can also be carried out afterwards, since the concrete measurement values can also be saved.
Unter "Grundremission" wird hier die Remission des hämoglobinfreien Gewebes verstanden, wie sie bspw. bei einer hämoglobinfreien Perfusion des Gewebes festgestellt werden kann.“Basic remission” here means the remission of the hemoglobin-free tissue, as can be determined, for example, in the case of a hemoglobin-free perfusion of the tissue.
Unter "gewebeartspezifisch" werden die Besonderheiten verstanden, die aus der speziellen Art des Gewebes (z.B. Rattenleber oder menschliche Haut) resultieren. Mit "gewebepersonenspezifisch" werden solche Werte und Kurven bezeichnet, in die die konkrete Messung zumindest einer der beiden Remissionskurven schon eingegangen ist, und sei es nur durch die durch die Messung beeinflußte Auswahl aus einer vorab ermitteln Kurvenschar."Tissue-specific" is understood to mean the special features that result from the special type of tissue (e.g. rat liver or human skin). "Tissue-specific" refers to values and curves in which the specific measurement of at least one of the two remission curves has already been included, even if it is only due to the selection from a family of curves determined in advance which is influenced by the measurement.
Die erfindungsgemäße Lösung hat insbesondere den Vorteil, daß dadurch daß im ersten Wellenlängenbereich, wo das Hämoglobin ein Fenster hat, die Grundremission verhältnismäßig ungestört erkennbar wird, der Einfluß der Grundremission auch im zweiten Wellenlängenbereich, wo sie vom Hämoglobineinfluß in aller Regel völlig überlagert wird, genauer, abgeschätzt und entsprechend eliminiert werden kann. Die so gewonnenen, genaueren Werte können in weiteren Verfahrensschritten noch verfeinert werden.The solution according to the invention has the particular advantage that the basic remission is relatively undisturbed in the first wavelength range, where the hemoglobin has a window, and the influence of the basic remission in the second wavelength range, where it is generally completely overlaid by the influence of hemoglobin , can be estimated and eliminated accordingly. The more precise values obtained in this way can be refined in further process steps.
Bevorzugt wird vorab eine Schar gewebeartspezifischer Standard-Grundremissionskurven an Gewebeproben der gleichen Gewebeart gewonnen, und wird die gemessene Remissionskurve im ersten Wellenlängenbereich, dem nächstpassenden Ast im ersten Wellenlängenbereich aus der Schar der Standard-Grundremissionskurven zugeordnet und der zugehörige Ast dieser Standard-Grundremissionskurve im zweiten Wellenlängenbereich als gewebepersonenspezifische Standard-Grundremissionskurve ausgewählt.Preferably, a set of tissue-specific standard basic remission curves is obtained in advance on tissue samples of the same tissue type, and the measured remission curve in the first wavelength range, the nearest branch in the first wavelength range from the family of standard basic remission curves and the associated branch of this standard basic remission curve in the second wavelength range selected as the tissue basic standard remission curve.
Unter Standard-Grundremissionskurven werden Grundremissionskurven verstanden, die "vorab" an einer großen Zahl von Geweben der zu messenden Gewebeart, z. B. durch hämoglobinfreie Perfusion, gemessen und gespeichert wurden. In dieser Ausführungsform der Erfindung werden Kurven ermittelt, die als Kurvenschar bei einer Wellenlänge einen großen Bereich von Remissionen überdecken, ohne daß sich die einzelnen Kurven schneiden. Aus der Schar wird nun die Kurve ausgewählt, die der gemessenen Kurve im ersten Wellenlängenbereich am nächsten kommt, und der andere Ast dieser ausgewählten (gewebeartspezifischen) Standard-Grundremissionskurve im zweiten Wellenlängenbereich wird durch diese Auswahl dort zur gewebepersonenspezifischen (Standard-)Grundremissionskurve.Standard basic remission curves are understood to mean basic remission curves that "in advance" on a large number of tissues of the type of tissue to be measured, e.g. B. were measured and stored by hemoglobin-free perfusion. In this embodiment of the invention, curves are determined which, as a family of curves, cover a large range of remissions at one wavelength without the individual curves intersecting. The curve that comes closest to the measured curve in the first wavelength range is now selected from the family and the other branch of this selected (tissue type-specific) standard basic remission curve in the second wavelength range becomes a tissue person-specific (standard) basic remission curve there.
Dies hat insbesondere den Vorteil, daß nach der Erstellung einer solchen Kurvenschar auf einfache Weise auf den (an sich unbekannten) Verlauf der im ersten Wellenlängenbereich gemessenen Kurve im zweiten Wellenlängenbereich geschlossen werden kann.This has the particular advantage that, after such a family of curves has been created, the (in itself unknown) course of the curve measured in the first wavelength range can be concluded in the second wavelength range in a simple manner.
Besonders bevorzugt erfolgt dabei die Zuordnung einer Standard-Grundremissionskurve aus der Schar der vorab gewonnenen Standard-Grundremissionskurven im ersten Wellenlängenbereich zu der gemessenen Remissionskurve derart, daß die Standard-Grundremissionskurve mit dem Wert an einer vorbestimmten isosbestschen Wellenlänge im ersten Wellenlängenbereich, der gleich oder nächst dem gemessenen Remissionswert an dieser isosbestschen Wellenlänge ist, ausgewählt wird, und als Wert zur Ermittlung der Hämoglobinkonzentration der Wert der ausgewählten Standard-Grundremissionskurve an einer vorbestimmten isosbestschen Wellenlänge im zweiten Wellenlängenbereich benutzt wird.Particularly preferably, a standard basic remission curve from the family of previously obtained standard basic remission curves in the first wavelength range is assigned to the measured remission curve in such a way that the standard basic remission curve with the value at a predetermined isosbestic wavelength in the first wavelength range, the same as or next to it measured remission value at this isosbestic wavelength is selected, and the value of the selected standard basic remission curve at a predetermined isosbestic wavelength in the second wavelength range is used as the value for determining the hemoglobin concentration.
Die Werte an den isosbestschen Wellenlängen werden genommen, weil sich dort kein zusätzlicher Fehler durch die (ebenfalls noch unbekannte) Oxygenierung des Hämoglobins ergibt. Diese Werte reichen zu dem genannten Zweck aber auch aus, weil schon der um die Grundremission bereinigte Remissionswert der Remissionskurve an einer isosbestschen Wellenlänge ausreicht, um aus dem Remissionswert mit einem entsprechend geeichten Gerät die Konzentration zu bestimmen.The values at the isosbestic wavelengths are taken because there is no additional error due to the (still unknown) oxygenation of the hemoglobin. However, these values are sufficient for the stated purpose, because the remission value of the remission curve adjusted for the basic remission at an isosbestic wavelength is sufficient to determine the concentration from the remission value with an appropriately calibrated device.
Alternativ bevorzugt wird vorab eine gemittelte gewebeartspezifische Standard-Grundremissionskurve an Gewebeproben der gleichen Gewebeart gewonnen, und wird die gemessene Remissionskurve im ersten Wellenlängenbereich zu der gemittelten Standard-Grundremissionskurve ins Verhältnis gesetzt, und aus dem gewonnenen Verhältnis und dem Teil der gewebeartspezifischen gemittelten Standard-Grundremissionskurve im zweiten Wellenlängenbereich eine gewebepersonenspezifische Standard-Grundremissionskurve im zweiten Wellenlängenbereich gewonnen.Alternatively, an averaged tissue type-specific standard remission curve is preferably obtained in advance on tissue samples of the same tissue type, and the measured remission curve in the first wavelength range is related to the averaged standard basic remission curve, and from the ratio obtained and the part of the tissue type-specific averaged standard remission curve in the obtained a tissue-specific standard basic remission curve in the second wavelength range in the second wavelength range.
Im Unterschied zu der vorherigen Alternative wird also jetzt eine typische Kurve aus einer Vielzahl von Vorabmessungen der Grundremission des Gewebes (bspw. durch hämoglobinfreie Perfusion) über beide Wellenlängenbereiche ermittelt, die deswegen auch als "gemittelte" Standard-Grundremissionskurve bezeichnet wird (wiewohl die Kurven der Kurvenschar ihrerseits ebenfalls aus Mittelungen entstanden sein können).In contrast to the previous alternative, a typical curve is now determined from a large number of preliminary dimensions of the basic remission of the tissue (for example by means of hemoglobin-free perfusion) over both wavelength ranges, which is therefore also referred to as the "averaged" standard basic remission curve (although the curves of the Curve family in turn can also have arisen from averaging).
Unter "Ins-Verhältnis-Setzen" soll jedenfalls nicht nur eine mathematische Verhältnisbildung verstanden werden, vielmehr sind zahlreiche Verfahren denkbar, wie aus den Abweichungen des Verlaufs der gemessenen Remissionskurve im ersten Wellenlängenbereich vom Verlauf der gemittelten Standard-Remissionskurve im ersten Wellenlängenbereich über den Verlauf der gemittelten Standard-Remissionskurve im zweiten Wellenlängenbereich auf die gedachte Fortsetzung der gemessenen (in nullter Näherung als Grundremissionskurve betrachteten) Kurve als gewebepersonenspezifische Grundremissionskurve im zweiten Wellenlängenbereich geschlossen werden kann.In any case, "putting into relationship" should not only be understood to mean a mathematical relationship formation, rather numerous methods are conceivable, such as from the deviations of the course of the measured remission curve in the first wavelength range from the course of the averaged standard remission curve in the first wavelength range over the course of the averaged standard remission curve in the second wavelength range can be inferred from the imaginary continuation of the measured curve (considered as the basic remission curve in the zero approximation) as tissue-specific basic remission curve in the second wavelength range.
Besonders bevorzugt erfolgt dabei das Ins-Verhältnis-Setzen der gemittelten Standard-Grundremissionskurve im ersten Wellenlängenbereich zu der gemessenen Remissionskurve (im ersten Wellenlängenbereich) derart, daß der Wert der gemittelten Standard-Grundremissionskurve im ersten Wellenlängenbereich an einer vorbestimmten isosbestschen Wellenlänge im ersten Wellenlängenbereich zu dem gemessenen Remissionswert an dieser isosbestschen Wellenlänge ins Verhältnis gesetzt wird, und anhand des gewonnenen Verhältnisses aus dem Wert der gemittelten Standard-Grundremissionskurve an einer vorbestimmten isosbestschen Wellenlänge im zweiten Wellenlängenbereich ein Remissionswert an dieser isosbestschen Wellenlänge gewonnen wird, der als Wert zur Ermittlung der Hämoglobinkonzentration benutzt wird.Particularly preferably, the averaging of the averaged standard basic remission curve in the first wavelength range to the measured remission curve (in the first wavelength range) is such that the value of the averaged standard basic remission curve in the first wavelength range is at a predetermined isosbestic wavelength in the first wavelength range measured remission value at this isosbestic wavelength is related, and based on the ratio obtained from the value of the average standard remission curve at a predetermined isosbestic wavelength in the second wavelength range, a remission value at this isosbestic wavelength is obtained, which is used as a value for determining the hemoglobin concentration .
Der Vorteil der Verwendung der Werte an isosbestschen Wellenlängen wurde schon erläutert. Der Remissionswert, der den Schluß auf die Hämoglobinkonzentration erlaubt, wird in aller Regel durch Subtraktion des gewonnenen Wertes an der isosbestschen Wellenlänge im zweiten Wellenlängenbereich vom gemessenen Remissionswert an dieser Wellenlänge ermittelt.The advantage of using the values at isosbestic wavelengths has already been explained. The reflectance value, which allows conclusions to be drawn about the hemoglobin concentration, is generally determined by subtracting the value obtained at the isosbestic wavelength in the second wavelength range from the measured reflectance value at this wavelength.
Bevorzugt wird in einer Weiterführung des Verfahrens anhand des für die Hämoglobinkonzentration gewonnenen Wertes die gemessene Kurve im ersten Wellenlängenbereich korrigiert, wodurch eine weitere, verbesserte Näherung für die gewebepersonenspezifische Grundremission im ersten Wellenlängenbereich gewonnen wird.In a further development of the method, the measured curve in the first wavelength range is preferably corrected on the basis of the value obtained for the hemoglobin concentration, as a result of which a further, improved approximation for the tissue-specific basic remission in the first wavelength range is obtained.
Die gemessene Remissionskurve im ersten Wellenlängenbereich, die ja noch den (allerdings dort geringen) Einfluß der Hämoglobinkonzentration enthielt, war im obigen Verfahren eine "nullte Näherung" einer gewebepersonenspezifischen Grundremissionskurve im ersten Wellenlängenbereich. Diese nullte Näherung läßt sich nun verbessern, indem die (ihrerseits aus obigen Verfahrensschritten in ersten Näherung bekannte) Hämoglobinkonzentration aus der Kurve eliminiert wird. Die so erhaltene weitere Näherung wird vorteilhaft in die oben geschilderten Verfahrensschritte anstelle der gemessenen Remissionskurve eingebracht.The measured remission curve in the first wavelength range, which still contained the (however slight) influence of the hemoglobin concentration in the above method, was a "zero approximation" of a tissue-specific basic remission curve in the first wavelength range. This zero approximation can now be improved by eliminating the hemoglobin concentration (which in turn is known from the above method steps in a first approximation) from the curve. The further approximation obtained in this way is advantageously introduced into the process steps described above instead of the measured remission curve.
Es werden also besonders bevorzugt mit der verbesserten Kurve anstelle der gemessenen Remissionskurve die Schritte 2. bis 4. durchgeführt, wodurch ein besserer Näherungswert für die Hämoglobinkonzentration und eine weiter verbesserte Kurve als gewebepersonenspezifische Grundremission im ersten Wellenlängenbereich erhalten werden.
Bevorzugt werden die obigen Schritte 2. bis 4. n-fach, unter Zugrundelegung der jeweils verbesserten Werte bzw. Kurven, wiederholt.The
Als breiterer erster Wellenlängenbereich wird der Bereich von 630 nm bis 100 nm bevorzugt.The range from 630 nm to 100 nm is preferred as the wider first wavelength range.
Als engerer erster Wellenlängenbereich wird der Wellenlängenbereich von 750 nm bis 850 nm bevorzugt. In diesen Bereichen hat das Hämoglobin ein Fenster, ist also sein Einfluß auf die Remission gering.The wavelength range from 750 nm to 850 nm is preferred as the narrower first wavelength range. In these areas, hemoglobin has a window, so its influence on remission is minimal.
Als breiterer zweiter Wellenlängenbereich wird der Wellenlängenbereich von 500 nm bis 620 nm bevorzugt.The wavelength range from 500 nm to 620 nm is preferred as the wider second wavelength range.
Als engerer zweiter Wellenlängenbereich wird der Bereich von 550 nm bis 570 nm bevorzugt. In den letzteren beiden Bereichen ist der Einfluß des Hämoglobins auf die Geweberemission groß.The range from 550 nm to 570 nm is preferred as the narrower second wavelength range. The influence of hemoglobin on tissue emission is great in the latter two areas.
Die Erfindung betrifft auch ein Verfahren zur Bestimmung der Oxygenierung von Hämoglobin, insbesondere unter Verwendung einer oder mehrerer der Kurven aus einem oder mehreren der obigen Verfahren. Die Bestimmung der Oxygenierung des Hämoglobins mit hoher Genauigkeit ist ebenfalls von besonderer Bedeutung bei der Überwachung von Lebensvorgängen mit Hilfe der Spektrophotometrie.The invention also relates to a method for determining the oxygenation of hemoglobin, in particular using one or more of the curves from one or more of the above methods. The determination of the oxygenation of hemoglobin with high accuracy is also of particular importance when monitoring life processes using spectrophotometry.
Dabei wird erfindungsgemäß aus einer gewebepersonenspezifischen Standard-Grundremissionskurve und der gemessenen Remissionskurve im zweiten Wellenlängenbereich eine "reine" Hämoglobinkurve gewonnen, wobei vorab durch Überlagerung zweier reiner Standard-Hämoglobinkurven, nämlich für 0% und 100% Oxygenierung, mit unterschiedlicher Gewichtung eine Schar von "reinen" Hämoglobinkurven im Bereich 0% bis 100% Oxygenierung erhalten wird, und es wird die "reine" Hämoglobinkurve, nach Normierung auf 1, mit den ebenfalls normierten Standard-Hämoglobinkurven der Schar verglichen, die nächstpassende ausgewählt, und deren Oxygenierung als Wert der Oxygenierung der gemessen Kurve angenommen.According to the invention, a “pure” hemoglobin curve is obtained from a tissue-specific standard basic remission curve and the measured remission curve in the second wavelength range, with a group of “pure” beforehand by superimposing two pure standard hemoglobin curves, namely for 0% and 100% oxygenation, with different weights "Hemoglobin curves in the range of 0% to 100% oxygenation is obtained, and the" pure "hemoglobin curve, after normalization to 1, is compared with the standard hemoglobin curves of the group, which are also normalized, the most suitable is selected, and their oxygenation as the value of the oxygenation of the measured curve assumed.
In einem alternativ bevorzugten Verfahren zur Bestimmung der Oxygenierung von Hämoglobin, insbesondere unter Verwendung eines der Konzentrationswerte und insbesondere der Kurven aus einem der eingangs beschriebenen Verfahren wird vorab anhand einer Vielzahl von Messungen an der gleichen Gewebeart, mit Hämoglobin unterschiedlicher Konzentration und unterschiedlicher Oxygenierung, eine zweidimensionale Schar von Vergleichskurven erstellt, werden die Vergleichskurven mit Hämoglobinkonzentrationen in der Umgebung der ermittelten Konzentration über den ganzen Oxygenierungsbereich durchsucht, und liefert die bestpassende der Vergleichskurven einen angenommenen Wert für die Oxygenierung und einen verbesserten Wert für die Konzentration.In an alternative preferred method for determining the oxygenation of hemoglobin, in particular using one of the concentration values and in particular the curves from one of the methods described at the outset, a two-dimensional is carried out beforehand on the basis of a large number of measurements on the same type of tissue, with hemoglobin of different concentration and different oxygenation Generated by comparison curves, the comparison curves with hemoglobin concentrations in the vicinity of the determined concentration are searched over the entire oxygenation range, and the most suitable of the comparison curves provides an assumed value for the oxygenation and an improved value for the concentration.
Auf diese Weise lassen sich wiederum einfach und schnell mit Hilfe der gemessenen Remissionen und vorbekannter Standardwerte zuverlässige Werte für wichtige Parameter gewinnen.In this way, reliable values for important parameters can be obtained simply and quickly with the help of the measured remissions and previously known standard values.
Bevorzugt werden die auf die eben geschilderte Weise gewonnenen Werte für die Konzentration und die Oxygenierung bei dem geschilderten Schritt zur Gewinnung einer verbesserten gewebepersonenspezifischen Grundremissionskurve verwendet.The values for the concentration and oxygenation obtained in the manner just described are preferably used in the step described to obtain an improved tissue-specific basic remission curve.
Besonders bevorzugt wird die gemessene Remissionskurve aus dem zweiten Wellenlängenbereich auf die nächstpassende Kurve aus der oben erwähnten, zur Bestimmung der Oxygenierung dienenden, zweidimensionalen Schar normiert, die Differenz zwischen den beiden Kurven wellenlängenabhängig aufgetragen und als Maß der Verzerrung zur Ermittlung der Eindringtiefe des eingestrahlten Lichtes, d.h. des durch das Licht erfaßten Volumens V, benutzt.Particularly preferably, the measured remission curve from the second wavelength range is normalized to the next matching curve from the two-dimensional family mentioned above, which is used to determine the oxygenation, the difference between the two curves is plotted as a function of the wavelength and as a measure of the distortion to determine the penetration depth of the incident light, ie of the volume V detected by the light.
Es hat sich herausgestellt, daß diese Verzerrung als Maß der Eindringtiefe benutzt werden kann. Entsprechende vorab ermittelte Verzerrungskurven werden wiederum gespeichert, ihnen wird das entsprechende Volumen zugeordnet, und dann wird die durch den Vergleich erhaltene Verzerrungskurve der nächstpassenden Kurve aus den gespeicherten Verzerrungskurven zugeordnet und so das Volumen bestimmt.It has been found that this distortion can be used as a measure of the depth of penetration. Corresponding previously determined distortion curves are again stored, the corresponding volume is assigned to them, and then the distortion curve obtained by the comparison is assigned to the closest matching curve from the stored distortion curves and the volume is thus determined.
Besonders bevorzugt wird zu den obigen Messsungen das Erlanger - Mikro-Lichtleiterspektrophotometer verwendet. Dies wird weiter unten noch näher erläutert. Dabei weist die darin verwendete Interferenz-Verlaufsfilterscheibe bevorzugt sowohl den ersten Wellenlängenbereich als auch den zweiten Wellenlängenbereich auf. Dadurch können die gemessenen Remissionskurven des ersten und des zweiten Wellenlängenbereichs in einem Umlauf der Scheibe erhalten werden.The Erlangen micro-optical fiber spectrophotometer is particularly preferably used for the above measurements. This is explained in more detail below. The interference waveform filter disc used therein preferably has both the first wavelength range and the second wavelength range. As a result, the measured remission curves of the first and the second wavelength range can be obtained in one revolution of the disk.
Bevorzugt weist das Mikrolichtleiterspektrophotometer Mittel zur absoluten Eichung des illuminierenden und detektierenden Systems auf. Die Absoluteichung ist besonders wichtig, da die Vorabmessungen, die ohnehin mit dem gleichen Gerät erfolgen sollten bzw. gerätespezifisch umgerechnet werden müssen, unter zu denen der konkreten Messung vergleichbaren, definierten Bedingungen stattfinden müssen. Solche Mittel sind insbesondere ein Weißstandard und eine Normallichtquelle, die unten noch erläutert werden.The microlight guide spectrophotometer preferably has means for absolute calibration of the illuminating and detecting system. Absolute calibration is particularly important because the preliminary dimensions, which should be carried out with the same device anyway or have to be converted for specific devices, must take place under which defined conditions comparable to the concrete measurement must take place. Such means are in particular a white standard and a normal light source, which will be explained below.
Die Erfindung betrifft auch eine Vorrichtung zur Ermittlung von Größenveränderungen an Gewebepartikeln. Die Beobachtung solcher Veränderungen, z.B. der Größenänderung von Mitochondrien, ist von besonderer praktischer Bedeutung, da sie z.B. ermöglicht, ein Gehirnödem frühzeitig zu erkennen. Dies wird durch eine Vorrichtung mit einem Licht in das Gewebe einstrahlenden Lichtleiter, mindestens zwei davon radial unterschiedlich beabstandeten, das rückgestreute Licht aufnehmenden Lichtleitern, die vorzugsweise linienförmig zu beiden Seiten des beleuchtenden Lichtleiters angeordnet sind, und eine Auswerteinheit für jeden der Lichtleiter, die die zeitliche Änderung der rückgestreuten Intensität relativ zu den anderen Lichtleitern feststellt und auswertet, erreicht.The invention also relates to a device for determining size changes in tissue particles. The observation of such changes, e.g. the size change of mitochondria is of particular practical importance since they e.g. enables early detection of brain edema. This is achieved by means of a device with a light guide radiating light into the tissue, at least two radially differently spaced light guides receiving the backscattered light, which are preferably arranged linearly on both sides of the illuminating light guide, and an evaluation unit for each of the light guides that determine the temporal Changes in the backscattered intensity relative to the other light guides are detected and evaluated.
Eine solche Auswerteinheit kann analog wie die des Erlanger Mikrolichtleiterspektrophotometers aufgebaut sein. Es läßt sich dann bspw. eine Verflachung oder sonstige Verformung der Rückstreucharakteristik erkennen, was wiederum einen Schluß auf die Veränderung der Partikelgröße erlaubt.Such an evaluation unit can be constructed analogously to that of the Erlangen microlight guide spectrophotometer. A flattening or other deformation of the backscattering characteristic can then be recognized, which in turn allows conclusions to be drawn about the change in the particle size.
Die Erfindung betrifft auch eine Vorrichtung zur Bestimmung von lokalen Farbstoff-Konzentrationen in tierischen und menschlichen Geweben, mit einer beleuchtenden Einrichtung, mit der Licht unterschiedlicher Wellenlängen in einen Teilbereich des Gewebes einstrahlbar ist, einer lichtaufnehmenden Einrichtung, mit der zumindest ein Teil des rückgestreuten Lichtes auffangbar ist, und einer Auswert-Einrichtung, die die Remission in Abhängigkeit von der Wellenlänge bestimmt und die Konzentration von Farbstoffen aus dem spektralen Remissionsgrad bestimmt. Eine solche Vorrichtung ist aus der eingangs genannten Dissertation von Dümmler bekannt. Bezüglich der Definitionen, Nachteile des Standes der Technik usw. wird für den hier nachfolgenden Teil der Beschreibungseinleitung ganz allgemein auf die entsprechenden Abschnitte der vorhergehenden Teile verwiesen.The invention also relates to a device for determining local dye concentrations in animal and human tissues, with an illuminating device with which light of different wavelengths can be irradiated into a partial area of the tissue, a light-receiving device with which at least part of the backscattered light can be collected is, and an evaluation device that determines the reflectance as a function of the wavelength and determines the concentration of dyes from the spectral reflectance. Such a device is known from Dümmler's dissertation mentioned at the beginning. With regard to the definitions, disadvantages of the prior art, etc., reference is made in general terms to the corresponding sections of the preceding parts for the following part of the introduction to the description.
Die beleuchtende Einrichtung, die lichtaufnehmende Einrichtung und die Auswert-Einrichtung werden später an Beispielen für mögliche Ausführungsformen erläutert.The illuminating device, the light-receiving device and the evaluation device are explained later using examples of possible embodiments.
Insbesondere die genauere, Absolut-Konzentrationen anzugeben ermöglichende, Bestimmung der Farbstoff-Konzentrationen wird dadurch erreicht, daß die beleuchtende Einrichtung in einem Schritt Strahlung aus einem ersten Wellenlängenbereich, in dem der Einfluß des Hämoglobins auf die Remission gering ist, einstrahlt und die Auswert-Einrichtung die Remission in diesem (ersten) Wellenlängenbereich bestimmt, daß die beleuchtende Einrichtung in einem gesonderten Schritt Licht aus einem zweiten Wellenlängenbereich, in dem die Remission vom Einfluß des Hämoglobins dominiert wird, in den gleichen Teilbereich des Gewebes einstrahlt und die Auswert-Einrichtung die Remission in diesem (zweiten) Wellenlängenbereich bestimmt, daß die Vorrichtung, anhand der Remission im ersten Wellenlängenbereich und mindestens einer vorab gewonnenen, abgespeicherten gewebeartspezifischen Standard-Grundremissionskurve für beide Wellenlängenbereiche eine gewebepersonenspezifische Standard-Grundremissionskurve für den zweiten Wellenlängenbereich ermittelt, und daß die Vorrichtung anhand der ermittelten gewebepersonenspezifischen Standard-Grundremissionskurve und der gemessenen Remission im zweiten Wellenlängenbereich einen (ersten) Wert für die Hämoglobinkonzentration liefert.In particular, the more precise determination of the dye concentrations, which makes it possible to indicate absolute concentrations, is achieved in that the illuminating device radiates radiation from a first wavelength range in which the influence of hemoglobin on the reflectance is low in one step and the evaluation device the remission in this (first) wavelength range determines that the illuminating device radiates light from a second wavelength range, in which the remission is dominated by the influence of hemoglobin, into the same partial area of the tissue in a separate step and the evaluation device transmits the remission into This (second) wavelength range determines that the device, based on the remission in the first wavelength range and at least one previously obtained, stored tissue-type-specific standard remission curve for both wavelength ranges, provides a tissue-specific standard basic remission Curve determined for the second wavelength range, and that the device based on the determined tissue-specific standard basic remission curve and the measured remission in the second wavelength range provides a (first) value for the hemoglobin concentration.
Hiermit erzielte Vorteile sind schon eingangs aufgezählt.The advantages achieved in this way are already listed at the beginning.
Bevorzugt hat die Vorrichtung eine Schar vorab an Gewebeproben der gleichen Gewebeart gewonnener gewebeartspezifischer Standard-Grundremissionskurven gespeichert, und ein Rechner ordnet die gemessene Remissionskurve im ersten Wellenlängenbereich dem nächstpassenden Ast im ersten Wellenlängenbereich aus der Schar der Standard-Grundremissionskurven zu und wählt den zugehörigen Ast dieser Standard-Grundremissionskurve (die den nächstpassenden Ast im ersten Wellenlängenbereich hat) im zweiten Wellenlängenbereich als gewebepersonenspezifische Standard-Grundremissionskurve aus.The device has preferably stored a family of tissue-specific standard basic remission curves obtained in advance from tissue samples of the same tissue type, and a computer assigns the measured remission curve in the first wavelength range to the next matching branch in the first wavelength range from the family of standard basic remission curves and selects the associated branch of this standard - Basic remission curve (which has the closest matching branch in the first wavelength range) in the second wavelength range as a tissue-specific standard basic remission curve.
Die Erläuterungen hierzu sind ebenfalls vorne ((S. 16/17 dieser Anmeldung)) schon gemacht worden.The explanations for this have also been made above ((p. 16/17 of this application)).
Bevorzugt ordnet der Rechner der Vorrichtung eine Standard-Grundremissionskurve aus der Schar der vorab gewonnenen Standard-Grundremissionskurven im ersten Wellenlängenbereich zu der gemessenen Remissionskurve (im ersten Wellenlängenbereich) derart zu, daß er die Standard-Grundremissionskurve mit dem Wert an einer vorbestimmten isosbestschen Wellenlänge im ersten Wellenlängenbereich, der gleich oder nächst dem gemessenen Remissionswert an dieser isosbestschen Wellenlänge ist, auswählt, und als Wert zur Ermittlung der (ersten) Hämoglobinkonzentration den Wert der ausgewählten Standard-Grundremissionskurve an einer vorbestimmten isosbestschen Wellenlänge im zweiten Wellenlängenbereich benutzt.The computer preferably assigns the device a standard basic remission curve from the family of previously obtained standard basic remission curves in the first wavelength range to the measured remission curve (in the first wavelength range) in such a way that it calculates the standard basic remission curve with the value at a predetermined isosbestic wavelength in the first Select the wavelength range that is equal to or closest to the measured reflectance value at this isosbestic wavelength, and use the value of the selected standard basic remission curve at a predetermined isosbestic wavelength in the second wavelength range as the value for determining the (first) hemoglobin concentration.
Die Vorteile dieser Ausgestaltung sind ebenfalls früheren Ausführungen ((vgl. S. 17)) zu entnehmen.The advantages of this configuration can also be found in earlier explanations ((see p. 17)).
Alternativ bevorzugt hat der Rechner der Vorrichtung eine vorab an Gewebeproben der gleichen Gewebeart gewonnene gemittelte gewebeartspezifische Standard-Grundremissionskurve gespeichert und setzt die gemessene Remissionskurve im ersten Wellenlängenbereich zu der gemittelten Standard-Grundremissionskurve ins Verhältnis, und bildet aus dem gewonnenen Verhältnis und dem Teil der gewebeartspezifischen gemittelten Standard-Grundremissionskurve im zweiten Wellenlängenbereich eine gewebepersonenspezifische Standard-Grundremissionskurve im zweiten Wellenlängenbereich.Alternatively, the computer of the device preferably has stored an averaged tissue type-specific standard basic remission curve obtained in advance from tissue samples of the same tissue type and relates the measured remission curve in the first wavelength range to the averaged standard basic remission curve, and forms from the obtained ratio and the part of the tissue type-specific averaged Standard basic remission curve in the second wavelength range a tissue-specific standard basic remission curve in the second wavelength range.
Die Vorteile dieser Ausgestaltung und zugehörige Erläuterungen sind oben ((S. 18, 1. und 2. Abs.)) angegeben.The advantages of this configuration and associated explanations are given above ((p. 18, 1st and 2nd paragraph)).
Dabei setzt der Rechner der Vorrichtung die gemittelte Standard-Grundremissionskurve im ersten Wellenlängenbereich zu der gemessenen Remissionskurve (im ersten Wellenlängenbereich) derart ins Verhältnis, daß er den Wert der gemittelten Standard-Grundremissionskurve im ersten Wellenlängenbereich an einer vorbestimmten isosbestschen Wellenlänge im ersten Wellenlängenbereich zu dem gemessenen Remissionswert an dieser isosbestschen Wellenlänge ins Verhältnis setzt, und anhand des gewonnenen Verhältnisses aus dem Wert der gemittelten Standard-Grundremissionskurve an einer vorbestimmten isosbestschen Wellenlänge im zweiten Wellenlängenbereich einen Remissionswert an dieser isosbestschen Wellenlänge liefert, der als Wert zur Ermittlung der (ersten) Hämoglobinkonzentration benutzt wird.The computer of the device relates the averaged standard basic remission curve in the first wavelength range to the measured remission curve (in the first wavelength range) in such a way that it measures the value of the averaged standard basic remission curve in the first wavelength range at a predetermined isosbestic wavelength in the first wavelength range The remission value at this isosbestic wavelength is related and, based on the ratio obtained from the value of the mean standard basic remission curve at a predetermined isosbestic wavelength in the second wavelength range, provides a remission value at this isosbestic wavelength which is used as a value for determining the (first) hemoglobin concentration .
Erläuterungen hierzu sind oben ((S. 19, 1. Abs.)) schon angegeben.Explanations are already given above ((p. 19, 1st paragraph)).
Besonders bevorzugt ist der Rechner der Vorrichtung so eingerichtet und aufgebaut, daß er anhand des für die Hämoglobinkonzentration gewonnenen (ersten) Wertes die gemessene Kurve im ersten Wellenlängenbereich korrigiert, wodurch er eine weitere, verbesserte (1.) Näherung für die gewebepersonenspezifische Grundremission im ersten Wellenlängenbereich bildet ((vgl. hierzu S. 19, 3. Abs.)).The computer of the device is particularly preferably set up and constructed such that it corrects the measured curve in the first wavelength range on the basis of the (first) value obtained for the hemoglobin concentration, as a result of which it provides a further, improved (1st) approximation for the tissue-specific basic remission in the first wavelength range forms ((see p. 19, 3rd paragraph)).
Bevorzugt ist der Rechner der Vorrichtung so eingerichtet und aufgebaut, daß er mit der verbesserten Kurve ("(1.) Näherung" des vorigen Absatzes) anstelle der gemessenen Remissionskurve die Schritte 2. bis 4. (Zählung s. Ansprüche) durchführt, wodurch ein besserer (zweiter) Näherungswert für die Hämoglobinkonzentration und eine weiter verbesserte Kurve (2. Näherung) als gewebespezifische Grundremission im ersten Wellenlängenbereich gebildet wird ((vgl. hierzu S. 19, 4. Abs.)).The computer of the device is preferably set up and constructed in such a way that it uses the improved curve ("(1st) approximation" of the previous paragraph) instead of the measured remission curve to carry out
Die Vorrichtung weist den Rechner auf, der die Schritte 2. bis 4. n-fach, unter Zugrundelegung der jeweils verbesserten Werte bzw. Kurven, wiederholt.The device has the computer, which repeats
Bevorzugt reicht bei der erfindungsgemäßen Vorrichtung der erste Wellenlängenbereich von 630 nm bis 1000 nm.In the device according to the invention, the first wavelength range preferably ranges from 630 nm to 1000 nm.
Besonders bevorzugt reicht bei der erfindungsgemäßen Vorrichtung der erste Wellenlängenbereich von 750 nm bis 850 nm.In the device according to the invention, the first wavelength range particularly preferably ranges from 750 nm to 850 nm.
Bevorzugt reicht bei der erfindungsgemäßen Vorrichtung der zweite Wellenlängenbereich von 500 nm bis 620 nm.In the device according to the invention, the second wavelength range preferably ranges from 500 nm to 620 nm.
Besonders bevorzugt reicht bei der erfindungsgemäßen Vorrichtung der zweite Wellenlängenbereich von 550 nm bis 570 nm.In the device according to the invention, the second wavelength range particularly preferably ranges from 550 nm to 570 nm.
Wie weiter unten bei der Beschreibung bevorzugter Ausführungsbeispiele noch dargestellt werden wird, enthält die Vorrichtung eine Interferenz-Verlaufsfilterscheibe, die die entsprechenden Wellenlängenbereiche enthält, vorzugsweise in einer einzigen Scheibe vereinigt. Eine Auswahl bestimmter Wellenlängenbereiche kann auch dadurch getroffen werden, daß, da die Auswert-Vorrichtung die jeweilige Stellung der Interferenz-Verlaufsfilterscheibe berücksichtigt, von der Auswert-Vorrichtung nur die gewünschten Wellenlängen (bzw. die gemessenen Werte an diesen Wellenlängen) weiterverarbeitet werden.As will be shown further below in the description of preferred exemplary embodiments, the device contains an interference gradient filter disk, which contains the corresponding wavelength ranges, preferably combined in a single disk. A selection of certain wavelength ranges can also be made in that, since the evaluation device takes into account the respective position of the interference waveform filter disk, only the desired wavelengths (or the measured values at these wavelengths) are processed by the evaluation device.
Die Erfindung betrifft auch eine Vorrichtung zur Bestimmung der Oxygenierung von Hämoglobin, insbesondere eine solche, in der eine oder mehrere der von einer Vorrichtung wie vorher geschildert erfindungsgemäß gewonnenen Kurven gespeichert sind. Diese ist erfindungsgemäß dadurch gekennzeichnet, daß der Rechner der Vorrichtung aus einer gewebepersonenspezifischen Standard-Grundremissionskurve (ggfs. n-ter Näherung) und der gemessenen Remissionskurve im zweiten Wellenlängenbereich eine "reine" Hämoglobinkurve bildet, daß der Rechner vorab durch Überlagerung zweier reiner Standard-Hämoglobinkurven, nämlich für 0% und 100% Oxygenierung, mit unterschiedlicher Gewichtung eine Schar von "reinen" Hämoglobinkurven im Bereich 0% bis 100% Oxygenierung gebildet hat, und die "reine" Hämoglobinkurve, nach Normierung auf 1, mit den ebenfalls normierten Kurven der Schar vergleicht, die nächstpassende auswählt und deren Oxygenierung als Wert der Oxygenierung der gemessenen Kurve liefert.The invention also relates to a device for determining the oxygenation of hemoglobin, in particular one in which one or more of the curves obtained according to the invention by a device as described above are stored. According to the invention, this is characterized in that the computer of the device forms a "pure" hemoglobin curve from a tissue-specific standard basic remission curve (possibly nth approximation) and the measured remission curve in the second wavelength range, in that the computer beforehand by superimposing two pure standard hemoglobin curves , namely for 0% and 100% oxygenation, with different weighting has formed a group of "pure" hemoglobin curves in the
Nähere Erläuterungen hierzu wurden schon oben gegeben ((S. 20)).More detailed explanations have already been given above ((p. 20)).
Die Erfindung betrifft auch eine Vorrichtung zur Bestimmung der Oxygenierung von Hämoglobin, in der einer der Konzentrationswerte (ggfs. n-ter Näherung) und insbesondere die Kurven, die von einer vorher geschilderten erfindungsgemäßen Vorrichtung gebildet wurden, gespeichert sind. Diese ist erfindungsgemäß dadurch gekennzeichnet, daß die Vorrichtung vorab anhand einer Vielzahl von Messungen an der gleichen Gewebeart, mit Hämoglobin unterschiedlicher Konzentration und unterschiedlicher Oxygenierung, eine zweidimensionale Schar von Vergleichskurven (vgl. Fig. 5) erstellt, die Vergleichskurven mit Hämoglobinkonzentrationen in der Umgebung der ermittelten Konzentration (ggfs. n-ter Näherung) über den ganzen Oxygenierungsbereich durchsucht, und aus der bestpassenden der Vergleichskurven einen angenommenen Wert für die Oxygenierung und einen verbesserten Wert (ggfs. n+1-ter Näherung) für die Konzentration bildet.The invention also relates to a device for determining the oxygenation of hemoglobin, in which one of the concentration values (possibly nth approximation) and in particular the curves which were formed by a device according to the invention described above are stored. According to the invention, this is characterized in that the device uses a large number of measurements on the same type of tissue, with hemoglobin of different concentration and different oxygenation, to create a two-dimensional set of comparison curves (see FIG. 5), the comparison curves with hemoglobin concentrations in the vicinity of the determined concentration (possibly nth approximation) is searched over the entire oxygenation range, and from the best-fitting comparison curve forms an assumed value for oxygenation and an improved value (possibly n + 1th approximation) for the concentration.
Nähere Erläuterungen hierzu wurden schon oben gegeben ((S. 21)).More detailed explanations have already been given above ((p. 21)).
Besonders bevorzugt ist die Vorrichtung so eingerichtet, daß sie die Werte für die Konzentration (n+1-ter Näherung) und die Oxygenierung weiter zur Gewinnung einer verbesserten gewebepersonenspezifischen Grundremissionskurve verwendet.The device is particularly preferably set up in such a way that it further uses the values for the concentration (n + 1 th approximation) and the oxygenation to obtain an improved tissue-specific basic remission curve.
Besonders bevorzugt ist die Vorrichtung derart eingerichtet, daß sie die gemessene Remissionskurve (im zweiten Wellenlängenbereich) auf die nächstpassende Kurve aus der zweidimensionalen Schar normiert (vgl. Fig. 7), die Differenz zwischen den beiden Kurven wellenlängenabhängig aufträgt (vgl. Fig. 8) und als Maß der Verzerrung zur Ermittlung der Eindringtiefe des Eingestrahlten Lichtes, d.h. des durch das Licht erfaßten Volumens V, benutzt ((vgl. S. 21, letzter Abs.)).The device is particularly preferably set up in such a way that it normalizes the measured remission curve (in the second wavelength range) to the closest matching curve from the two-dimensional family (see FIG. 7), and plots the difference between the two curves as a function of wavelength (see FIG. 8). and used as a measure of the distortion to determine the penetration depth of the radiated light, ie the volume V detected by the light ((see p. 21, last paragraph)).
Nachfolgend wird die Erfindung anhand bevorzugter Ausführungsbeispiele unter Bezugnahme auf die beigefügten Zeichnungen, auf die wegen ihrer großen Klarheit und Übersichtlichkeit bezüglich der Offenbarung ausdrücklich verwiesen wird, noch näher erläutert.The invention is explained in more detail below on the basis of preferred exemplary embodiments with reference to the accompanying drawings, to which express reference is made because of their great clarity and clarity with regard to the disclosure.
Es zeigen:
- Fig. 1: Eine typische, an Rattenleber gemessene, schon auf Weißlichteinstrahlung korrigierte, Remissionskurve MI0 im Wellenlängenbereich I, sowie die gleiche Kurve nach Berücksichtigung der Hämoglobinkonzentration in erster Näherung, GI1; sowie im Wellenlängenbereich II eine gemessene Remissionskurve MII0, praktisch gleichzeitig mit der Kurve MI0 gemessen, sowie die zur Kurve MI0 gehörende Standard-Grundremissionskurve SI0;
- Fig. 2: Der Kurve MI0 entsprechende Kurven, bei hoher (M′I0h) und niedriger (M′I0n) Hämoglobinoxygenierung; sowie eine zugehörige Grundremissionskurve
- Fig. 3: Auf der perfundierten Rattenleber gemessene Standard-Grundremissionskurven bei hoher (SIIh) bzw. niedriger (SIIn) Oxydation der Atmungsfermente;
- Fig. 4: Eine Wertematrix (Auszug) für die Zuordnung gemessener Remissionen bei der Wellenlänge λ = 815 nm (isosbestsche Wellenlänge des Hämoglobins im Wellenlängenbereich I) zu Standard-Grundremissionswerten bei λ = 586 nm (einer isosbestschen Wellenlänge in II) im Wellenlängenbereich II;
- Fig. 5: Schematisch eine Wertematrix, deren Felder Standard-Hämoglobinspektren der Gewebeart des zu untersuchenden Gewebes enthalten, wobei die Zeilen Kurven mit jeweils unterschiedlicher Konzentration bei gleichem Oxygenierungsgrad und die Spalten Kurven mit jeweils gleicher Konzentration bei unterschiedlichem Oxygenierungsgrad enthalten;
- Fig. 6: Schematisch die Einstrahlung mittels Lichtleiter und die Detektion mittels eines weiteren Lichtleiters und die dadurch erreichten Volumina im Gewebe;
- Fig. 7: Schematisch drei Kurven, die zur Ermittlung der Verzerrung zweier gemessener Kurven dienen;
- Fig. 8: Die sich aus den Kurven der Fig. 7 ergebenden Differenz- oder Verzerrungskurven;
- Fig. 9: Schematisch eine Vorrichtung zur Ermittlung der Veränderung der Größe von Gewebeteilchen;
- Fig. 10: Eine Tabelle, anhand derer die Veränderung der Rückstreung in Abhängigkeit von der Partikelgröße erkennbar ist;
- Fig. 11: Die Veränderung der Form der Rückstreucharakteristik bei der Veränderung der Partikelgröße nach Fig. 10;
- Fig. 12: Eine Anordnung aus mehreren beleuchtenden Lichtleitern und mehreren aufnehmenden Lichtleitern, zur Erstellung einer Topographie von Farbstoffverteilungen;
- Fig. 13: Schematisch das Erlanger Mikrolichtleiter-Spektrophotometer EMPHO, das zu den Messungen verwendet wird;
- Fig. 14: Eine Anordnung zur Eichung des Gerätes aus Fig. 13.
- Fig. 15: Kurven, die Eichkurven und eine gemessene Kurven zeigen.
- Fig. 16: Eine unter Berücksichtigung der Eichkurve korrigierte Meßkurve.
- 1: A typical remission curve MI0 in the wavelength range I, measured on rat liver and already corrected for white light irradiation, and the same curve after taking the hemoglobin concentration into account in a first approximation, GI1; and in the wavelength range II a measured remission curve MII0, measured practically simultaneously with the curve MI0, and the standard basic remission curve SI0 belonging to the curve MI0;
- Fig. 2: curves corresponding to curve MI0, with high (M'I0 h ) and low (M'I0 n ) hemoglobin oxygenation; as well as an associated basic remission curve
- 3: Standard basic remission curves measured on the perfused rat liver at high (SII h ) or low (SII n ) oxidation of the respiratory ferments;
- 4: A value matrix (extract) for the assignment of measured remissions at the wavelength λ = 815 nm (isosbestic wavelength of the hemoglobin in the wavelength range I) to standard basic remission values at λ = 586 nm (an isosbestic wavelength in II) in the wavelength range II;
- 5: Schematic of a value matrix, the fields of which contain standard hemoglobin spectra of the tissue type of the tissue to be examined, the lines containing curves with different concentrations in each case with the same degree of oxygenation and the columns with curves with the same concentration and different degrees of oxygenation;
- 6: Schematic of the irradiation by means of a light guide and the detection by means of a further light guide and the volumes thereby achieved in the tissue;
- 7: Schematic of three curves which serve to determine the distortion of two measured curves;
- 8: The difference or distortion curves resulting from the curves in FIG. 7;
- 9: Schematic of a device for determining the change in the size of tissue particles;
- 10: A table from which the change in backscatter as a function of the particle size can be seen;
- FIG. 11: The change in the shape of the backscattering characteristic when the particle size is changed according to FIG. 10;
- Fig. 12: An arrangement of several illuminating light guides and several receiving light guides to create a topography of dye distributions;
- Fig. 13: Schematic of the Erlangen micro-light guide spectrophotometer EMPHO, which is used for the measurements;
- Fig. 14: An arrangement for calibrating the device from Fig. 13.
- Fig. 15: Curves showing calibration curves and a measured curve.
- Fig. 16: A measurement curve corrected taking the calibration curve into account.
Fig. 1 zeigt rechts eine erste gemessene Kurve MI0 (M soll auf gemessen, I soll auf den Wellenlängenbereich I (hier: 750 - 850 nm) hinweisen, und die Ziffer 0 gibt an, daß es sich um eine Kurve handelt, die als die nullte Näherung der Grundremissionskurve betrachtet werden kann). Als Maß für die Remission wird hier In I₀/I verwendet. Die Kurve wurde an Rattenleber mit dem Erlanger Mikrolichtleiter-Spektrophotometer gemessen, das u. a. in der Dissertation "Optische Streuung an biologischen Partikeln und Zellen", Erlangen 1985, des einen der Erfinder, Frank, näher erläutert ist, aber auch weiter unten noch beschrieben wurden wird.Fig. 1 shows on the right a first measured curve MI0 (M should measure, I should indicate the wavelength range I (here: 750-850 nm), and the
Die Kurve weist nur einen geringen Einfluß des Hämoglobins auf, da Hämoglobin im Bereich I ein Fenster hat.The curve shows only a slight influence of hemoglobin, since hemoglobin has a window in area I.
Unter "Grundremission" wird hier die Remission des hämoglobinfreien Gewebes verstanden, wie sie bspw. bei einer hämoglobinfreien Perfusion des Gewebes festgestellt werden kann. Diese Grundremission ist noch gewebeartspezifisch, sie hängt vom Redoxzustand der verbleibenden Zellpigmente und evtl. zugefügter Farbstoffe ab und ist auch noch, wenn auch nur in geringem Ausmaß, gewebepersonenspezifisch. Deshalb ist es erforderlich, die konkrete "wahre" Grundremission möglichst genau zu bestimmen, um die Konzentration, Oxygenierung und den Redoxzustand verschiedener Pigmente/Farbstoffe ermitteln zu können.“Basic remission” here means the remission of the hemoglobin-free tissue, as can be determined, for example, in the case of a hemoglobin-free perfusion of the tissue. This basic remission is still tissue-specific, it depends on the redox state of the remaining cell pigments and any added dyes and is also, if only to a small extent, tissue-specific. It is therefore necessary to determine the specific "true" basic remission as precisely as possible in order to be able to determine the concentration, oxygenation and redox state of various pigments / dyes.
Die (systematisch betrachtet in einem Verfahrensschritt 1.1) gemessene Kurve MI0 stellt im Verfahren eine (nullte) Näherung dar, weil sie noch von dem, im gewählten Wellenlängenbereich I von 750 bis 850 nm allerdings geringen, Einfluß der Hämoglobinkonzentration (KHb) sowie der Oxygenierung des Hämoglobins (HbO₂/Hb) abhängig ist.The curve MI0 (viewed systematically in a method step 1.1) represents a (zero) approximation in the method, because it still has an influence of the hemoglobin concentration (KHb) as well as the oxygenation of the, in the selected wavelength range I of 750 to 850 nm Hemoglobin (HbO₂ / Hb) is dependent.
In einem weiteren Schritt (2.) wird zu der gemessenen Grundremissionskurve MI0 eine zugehörige Standard-Grundremissionskurve im Wellenlängenbereich II ausgewählt.In a further step (2.), an associated standard basic remission curve in the wavelength range II is selected for the measured basic remission curve MI0.
Zur Ermittlung der daher so genannten "Standard"-Grundremissionskurven wird (sozusagen in einem 0. Verfahrensschritt) an einer großen Zahl (ca. 100) hämoglobinfrei perfundierter in vivo- und in vitro-Proben ermittelt, welche Remissionskurven sich im Bereich II bei bestimmten Remissionen im Bereich I ergeben. Es wird also eine große Menge von Wertescharen ermittelt, wobei die Wertescharen Werte einer Kurve bei den verschiedenen Wellenlängen aus den Wellenlängenbereichen I und II enthalten.In order to determine the so-called "standard" basic remission curves, a large number (approx. 100) of hemoglobin-free perfused in vivo and in vitro samples is used to determine which remission curves can be found in area II for certain remissions result in area I. A large number of sets of values is thus determined, the sets of values containing values of a curve at the different wavelengths from the wavelength ranges I and II.
In der konkreten Tabelle (Fig. 4) ist einer Folge (je ein Wert aus den jeweils eine Kurve bildenden Wertescharen) von Remissionen bei einer (hier "der") isosbestschen Wellenlänge des Hämoglobins im Wellenlängenbereich I eine Folge an einem isosbestschen Punkt des Hämoglobins im Bereich II eindeutig zugeordnet (derart, daß die Werte des Wertepaares auf der selben Standard-Grundremissionskurve liegen). Die Tabelle stellt also einen engsten Ausschnitt aus den jeweiligen Kurven, bei den angegebenen Wellenlängen, dar.In the concrete table (FIG. 4) there is a sequence (one value each from the respective groups of values forming a curve) of remissions at one (here "the") isosbestic wavelength of the hemoglobin in the wavelength range I a sequence at an isosbestic point of the hemoglobin in Area II clearly assigned (such that the values of the pair of values lie on the same standard basic remission curve). The table therefore represents the narrowest section of the respective curves at the specified wavelengths.
Die isosbestsche Wellenlänge des Hämoglobins (815) nm) wurde im Wellenlängenbereich I ausgewählt, da der Einfluß der Oxygenierung des Hämoglobins auf die Remission auf im Wellenlängenbereich I größer ist als der Einfluß der Oxydation der Zytochrome, welcher Einfluß erst bei einem Sauerstoff-Partialdruck von weniger als 5 Torr sich merklich ändert. Durch die Wahl der isosbestschen Wellenlänge wird man von der in diesem Schritt noch unbekannten) Oxygenierung des Hämoglobins unabhängig. Der Fehler der nullten Näherung, der gemessenen Kurve MI0, hängt dort nur noch von der Konzentration des Hämoglobins ab.The isosbestic wavelength of the hemoglobin (815) nm was selected in the wavelength range I, since the influence of the oxygenation of the hemoglobin on the reflectance in the wavelength range I is greater than the influence of the oxidation of the cytochromes, which influence only with an oxygen partial pressure of less when 5 Torr changes noticeably. The choice of the isosbestic wavelength makes one independent of the oxygenation of the hemoglobin (still unknown in this step). The error of the zero approximation, the measured curve MI0, only depends on the concentration of the hemoglobin.
Zur Zuordnung einer Standard-Grundremissionskurve (SII0) nullter Näherung im Wellenlängenbereich II wird also im Wellenlängenbereich I der Wert der Folge an der Isosbestschen Wellenlänge gewählt, der gleich dem oder nächstliegend zu dem gemessenen Wert an der isosbestschen Wellänge auf der Kurve MI0 ist und diesem mittels der Tabelle 2 der zugehörige Wert der Folge im Wellenlängenbereich II, und damit auch der ganze Ast der entsprechenden Standard-Grundremissionskurve in II, zugeordnet.To assign a standard basic remission curve (SII0) of zero approximation in the wavelength range II, the value of the sequence at the Isosbestes wavelength is selected in the wavelength range I, which is equal to or closest to the measured value at the isosbestic wavelength on the curve MI0 and by means of this Table 2 the associated value of the sequence in the wavelength range II, and thus the entire branch is also assigned to the corresponding standard remission curve in II.
Alternativ wird in einem 0.2 Verfahrensschritt eine einzige, aus allen gemessenen Standard-Grundremissionen gemittelte, "gemittelte Standard-Grundremissionskurve" gebildet und es werden zu den Differenzen (oder Faktoren) im Verhältnis zu anderen Remissionen an der isosbestschen Wellenlänge im Bereich I Tabellen (anhand einer Vielzahl über beide Wellenlängenbereiche verlaufender Standard-Grundremissionskurven) erstellt, die einer Differenz (oder einem Faktor) eine Differenz (oder einen Faktor) bei Wellenlängen im 2. Wellenlängenbereich zuorden, insbesondere dort wieder an einer isosbestschen Wellenlänge. Dann wird im zweiten Verfahrensschritt, der Zuordnung, alternativ (Schritt 2.2) die Differenz (oder das Verhältnis) der Remission der gemessenen Kurve MI0 und der gemittelten Standard-Grundremissionskurve an der isosbestschen Wellenlänge festgestellt, und die gemittelte Standard-Grundremissionskurve im zweiten Wellenlängenbereich an der isosbestschen Wellenlänge mit dem aufgrund der Tabelle zugehörigen Faktor oder Summanden beaufschlagt, um zu einer Kurve, oder zumindest ihrem Wert an einer isosbestschen Wellenlänge im Wellenlängenbereich II zu gelangen, die die 0. Näherung der (Standard-)Grundremission im zweiten Wellenlängenbereich, II, SII0, darstellt.Alternatively, in a 0.2 step, a single, averaged from all measured standard remissions, "averaged standard remission curve" is formed and there are tables for the differences (or factors) in relation to other remissions at the isosbestic wavelength in the area I (using a A large number of standard basic remission curves running over both wavelength ranges are created, which assign a difference (or a factor) to a difference (or a factor) for wavelengths in the second wavelength range, particularly there again at an isosbestic wavelength. Then in the second method step, the assignment, alternatively (step 2.2) the difference (or the ratio) of the remission of the measured curve MI0 and the averaged standard basic remission curve is determined at the isosbestic wavelength, and the averaged standard basic remission curve in the second wavelength range at the the isosbestic wavelength is loaded with the factor or summand associated with the table in order to arrive at a curve, or at least its value, at an isosbestic wavelength in the wavelength range II which is the 0th approximation of the (standard) basic remission in the second wavelength range, II, SII0 , represents.
Im Bereich II wird ebenfalls eine isosbestsche Wellenlänge (im Ausführungsbeispiel konkret 586 nm) gewählt, um von der noch unbekannten Oxygenierung unabhängig zu sein.In area II, an isosbestic wavelength (specifically 586 nm in the exemplary embodiment) is also selected in order to be independent of the still unknown oxygenation.
Fig. 1 zeigt in der linken Hälfte eine im gleichen Durchgang einer Interferenz-Verlaufsfilterscheibe (s. u. Fig.13 ) gewonnene, (systematisch betrachtet in einem Schritt 1.2.) gemessene Remissionskurve an der gleichen Gewebestelle. Diese wird, als gemessene Kurve im Wellenlängenbereich II und nullte Näherung, als MII0 bezeichnet. Ferner ist in Fig. 1 links die zum im ersten Wellenlängenbereich I ermittelten Meßwert gehörende Standard-Grundremissionskurve SII0, die ebenfalls wie oben geschildert als Tabelle vorliegt (ein Ausschnitt ist in Fig. 2 gezeigt), oder aus dem Vergleich der gemittelten Standard-Grundremissionskurve im Bereich I mit der Kurve MI0, wie oben alternativ geschildert, ermittelt wird, eingezeichnet. An der isosbestschen Wellenlänge wird aus der gemessenen Gesamtremission (Kurve MII0), die sich aus der (in nullter Näherung durch die Standard-Grundremission vertretenen) Grundremission und der hämoglobinabhängigen Remission zusammensetzt, durch Subtraktion des Wertes der Standard-Grundremissionskurve SII0 an der konkreten isosbestschen Wellenlänge (586 nm) von dem Wert der gemessenen Remissionkurve MII0 die Hämoglobin-Remission und damit ein Maß für die Hämoglobin-Konzentration in erster Näherung, KHb1, (in einem 3. Schritt) gewonnen. Damit wird ein erster Näherungswert, KHb1, für die Konzentration des Hämoglobins erhalten.1 shows in the left half a remission curve obtained in the same passage of an interference filter disc (see below) (measured systematically in a step 1.2.) At the same tissue site. This is referred to as the measured curve in the wavelength range II and the zero approximation as MII0. 1 is the standard basic remission curve SII0 belonging to the measured value determined in the first wavelength range I, which is also available as a table as described above (a section is shown in FIG. 2), or from the comparison of the averaged standard basic remission curve in Area I is drawn with the curve MI0, as is alternatively described above. At the isosbestic wavelength, the total remission measured (curve MII0), which is composed of the basic remission (represented in zero approximation by the standard basic remission) and the hemoglobin-dependent remission, is subtracted from the value of the standard basic remission curve SII0 at the concrete isosbestic wavelength (586 nm) from the value of the measured remission curve MII0 the hemoglobin remission and thus a measure of the hemoglobin concentration in a first approximation, KHb1, (in a third step). This gives a first approximation, KHb1, for the concentration of hemoglobin.
Dieser Konzentrationswert KHb1 wird zur Korrektur der gemessenen Kurve im Bereich I, MI0, benutzt, und man gelangt für die Grundremission zu einer entsprechenden Kurve erster, besserer Näherung, GI1, indem man (in einem 4. Schritt) an der isosbestschen Wellenlänge 815 nm den bei dieser Konzentration für diese Wellenlänge durch die Hämoglobinkonzentration hervorgerufenen (zusätzlichen) Amplitudenwert von MI0 abzieht. Der sich daraus ergebende Wert wird mit Hilfe der Tabelle (Fig. 4) (oder des alternativen Verfahrensschrittes 2.2) zur Auswahl einer besser passenden Standard-Grundremissionskurve SII1 (s. Fig. 1 links) verwendet, die wiederum zur Verbesserung des Wertes der Konzentration des Hämoglobins zu einem Wert KHb2 dient. Dieser dient wiederum in der geschilderten Weise zur Ermittlung einer verbesserten Grundremissionskurve im Bereich I, GI2. Durch mehrfaches derartiges Einsetzen kann man schließlich einen stark verbesserten Wert für die Konzentration des Hämoglobins, KHbn, erreichen.This concentration value KHb1 is used to correct the measured curve in the area I, MI0, and one obtains a corresponding curve of the first, better approximation, GI1, for the basic remission by (in a 4th step) at the 815 nm isosbestic wavelength at this concentration for this wavelength subtracts the (additional) amplitude value of MI0 caused by the hemoglobin concentration. The resulting value is used with the help of the table (FIG. 4) (or the alternative method step 2.2) to select a more suitable standard basic remission curve SII1 (see FIG. 1 left), which in turn improves the value of the concentration of the Hemoglobin serves at a KHb2 value. This in turn serves to determine an improved base remission curve in the area I, GI2. By inserting it several times in this way, one can finally achieve a greatly improved value for the concentration of hemoglobin, KHbn.
In einem weiteren Schritt wird die Oxygenierung bestimmt, ggfs. unter gleichzeitiger Verbesserung des Wertes für die Konzentration.In a further step, the oxygenation is determined, if necessary with a simultaneous improvement in the value for the concentration.
Zuerst wird die der letzten Iterationsstufe entsprechende Standard-Grundremissionskurve von der gemessenen Kurve MII0 abgezogen, um die "reine" Hämoglobinkurve, HII0, zu erhalten.First, the standard base remission curve corresponding to the last iteration level is subtracted from the measured curve MII0 in order to obtain the "pure" hemoglobin curve, HII0.
Durch Überlagerung zweier reiner Standard-Hämoglobinkurven, nämlich für 0 % und für 100 % Oxygenierung, mit unterschiedlicher Gewichtung wird eine Schar von "reinen" Hämoglobinkurven im Bereich 0 - 100 % Oxygenierung erhalten.By superimposing two pure standard hemoglobin curves, namely for 0% and for 100% oxygenation, with different weights, a group of "pure" hemoglobin curves in the range 0-100% oxygenation is obtained.
Sodann wird die bereinigte Meßkurve, HII0, nach Normierung auf 1, mit den ebenfalls normierten Kurven dieser Schar verglichen und die nächstpassende ausgewählt (z. B. nach der Methode der kleinsten Quadrate).Then the adjusted measurement curve, HII0, after normalization to 1, is compared with the also normalized curves of this family and the next suitable one is selected (e.g. using the least squares method).
Der oxygenierungsgrad der ausgewählten Kurve wird als Oxygenierungsgrad der gemessenen Kurve MII0 angenommen.The degree of oxygenation of the selected curve is assumed to be the degree of oxygenation of the measured curve MII0.
Alternativ wurden vor Beginn der konkreten Messung anhand einer sehr großen Zahl von Messungen an der gleichen Gewebeart, die mit Hämoglobin unterschiedlicher Konzentration (von 0 bis 20 %) und unterschiedlicher Oxygenierung (0 bis 100 %) perfundiert wurde, Standard-Remissionskurven mit dem gleichen Gerät, mit dem die konkrete Messung durchgeführt wird, ermittelt. Die Standard-Remissionskurven, die ihrerseits für je eine bestimmte Konzentration und Oxygenierung aus einer großen Zahl von Messungen gemittelt sind, sind in einer Tabelle oder Matrix angeordnet, derart, daß z. B. die Zeilen die verschiedenen Konzentrationen bei gleicher Oxygenierung und die Spalten die verschiedenen Oxygenierungen bei gleicher Konzentration enthalten. Dies ist schematisch in Fig. 5 dargestellt.Alternatively, prior to the start of the specific measurement, a very large number of measurements were carried out on the same tissue type, which was perfused with hemoglobin of different concentrations (from 0 to 20%) and different oxygenations (0 to 100%), using standard remission curves with the same device with which the concrete measurement is carried out. The standard remission curves, which in turn are averaged for a certain concentration and oxygenation from a large number of measurements, are arranged in a table or matrix such that, for. B. the rows contain the different concentrations at the same oxygenation and the columns contain the different oxygenations at the same concentration. This is shown schematically in FIG. 5.
Die gemessene Kurve MII0 wird nun mit den Kurven in der Tabelle verglichen. Dabei werden bspw. und bevorzugt die der ersten Näherung der Hämoglobinkonzentration entsprechende Spalte und je eine oder im Ausführungsbeispiel je zwei Nachbarspalten durchsucht, zu sämtlichen Werten der Oxygenierung.The measured curve MII0 is now compared with the curves in the table. For example, and preferably the column corresponding to the first approximation of the hemoglobin concentration and one or, in the exemplary embodiment, two neighboring columns each, are searched for all values of the oxygenation.
Zum Vergleich der Kurven kann in einer Ausführung des Verfahrens das Integral der Fläche unter den Standard-Remissionskurven mit dem Integral unter der gemessenen Kurve MII0 verglichen werden.To compare the curves, in one embodiment of the method the integral of the area under the standard remission curves can be compared with the integral under the measured curve MII0.
Alternativ werden die Kurven nach der Methode der kleinsten Quadrate verglichen.Alternatively, the curves are compared using the least squares method.
Das Feld der Matrix mit der optimal passenden Kurve ergibt einen Konzentrationswert des Hämoglobins, zweiter Näherung, KHb2, und einen Oxygenierungsgrad des Hämoglobins, erster Näherung, KHbO₂1.The field of the matrix with the optimally fitting curve gives a concentration value of the hemoglobin, second approximation, KHb2, and an oxygenation level of the hemoglobin, first approximation, KHbO₂1.
Diese Werte werden nun bspw. wiederum verwandt, um verbesserte Werte für die Grundremissionskurve und die Konzentration zu gewinnen.These values are now used again, for example, in order to obtain improved values for the basic remission curve and the concentration.
Auch hier ist ersichtlich, daß das Verfahren fortgesetzt werden kann, bis eine in Bezug auf die realistische Meßgenauigkeit hinreichende Konvergenz erreicht wird.Here, too, it can be seen that the method can be continued until a convergence sufficient in terms of the realistic measurement accuracy is achieved.
Die Oxygenierung des Hämoglobins läßt gleichzeitig auf die Oxydation der Zytochrome schließen. Ferner erlaubt die Grundremissionskurve nach Abzug des Hämoglobineinflusses eine genauere Bestimmung anderer Parameter im Gewebe.The oxygenation of the hemoglobin also suggests the oxidation of the cytochromes. Furthermore, the base remission curve after subtracting the hemoglobin influence allows a more precise determination of other parameters in the tissue.
Bei sehr niedriger Oxygenierung, d. h. Sauerstoff-Partialdrucken < 5 Torr, die im Gewebe gemessen werden, müssen andere Grundremissionskurven zugrundegelegt werden, was aber am grundsätzlichen Verfahren nichts ändert.At very low oxygenation, i.e. H. Oxygen partial pressures <5 Torr, which are measured in the tissue, must be based on other basic remission curves, but this does not change the basic process.
Fig. 2 zeigt in vergrößertem Maßstab der Kurve MI0 entsprechende gemessene Kurven aus dem Wellenlängenbereich I, einmal bei hoher Oxygenierung des Hämoglobins (M′I0h) und einmal bei niedriger Oxygenierung des Hämoglobins (M′I0n).Fig. 2 shows on an enlarged scale the curve MI0 corresponding measured curves from the wavelength range I, once with high oxygenation of the hemoglobin (M'I0 h ) and once with low oxygenation of the hemoglobin (M'I0 n ).
Fig. 3 zeigt in vergrößertem Maßstab den Kurven SII entsprechende Standard-Grundremissionskurven, einmal bei hoher (SIIh) und einmal bei niedriger (SIIn) Oxydation der Atmungsfermente.3 shows, on an enlarged scale, standard basic remission curves corresponding to curves SII, once with high (SII h ) and once with low (SII n ) oxidation of the respiratory ferments.
Genauere Angaben über eine "Konzentration" lassen sich nur unter Berücksichtigung des durch die Messung erfaßten (Mikro-)Volumens des Gewebes machen.More precise information about a "concentration" can only be given taking into account the (micro) volume of the tissue detected by the measurement.
Das erfaßte Volumen hängt von folgenden Parametern ab:
- 1. der jeweils verwendeten Wellenlänge und ganz allgemein den Eigenschaften der verwendeten Lichtquelle (Leuchtfelddichte, Intensität, Stabilität)
- 2. den Übertragungseigenschaften des in das Gewebe einstrahlenden Lichtleiters (Akzeptanzwinkel α , Länge L, Durchmesser d, Material)
- 3. der Streucharakteristik des Gewebes und dem absorptionsverhalten des bzw. der Farbstoff(e)(s)
- 4. den Übertragungseigenschaften des das rückgestreute Licht aufnehmenden (detektierenden) Lichtleiters (Akzeptanzwinkel α , Länge L, Durchmesser d, Material) und des nachfolgenden Detektionssystems
- 5. der Empfindlichkeit des lichtmessenden Systems, bspw. des Photomultipliers.
- 1. the wavelength used in each case and in general the properties of the light source used (luminous field density, intensity, stability)
- 2. the transmission properties of the light guide radiating into the tissue (acceptance angle α, length L, diameter d, material)
- 3. the scattering characteristics of the fabric and the absorption behavior of the dye (s) (s)
- 4. the transmission properties of the backscattered light-receiving (detecting) light guide (acceptance angle α, length L, diameter d, material) and the subsequent detection system
- 5. the sensitivity of the light-measuring system, for example the photomultiplier.
Fig. 6 zeigt schematisch die beleuchtende Lampe 2, den illuminierenden Lichtleiter 4, den detektierenden Lichtleiter 6 und den Photovervielfacher 8. Das Volumen, in den der beleuchtende Lichtleiter 4 im Gewebe einstrahlt, ist für eine hohe Hb-Konzentration mit Eh und für eine niedrige mit En angedeutet; das Volumen, aus dem, unter Berücksichtigung der Empfindlichkeit des Photovervielfachers 8, der detektierende Lichtleiter 6 Licht empfangen kann, ist mit Rh bzw. Rn bezeichnet. Das Schnittvolumen, Vh bzw. Vn, ist das der Konzentrationsmessung zugrundeliegende Volumen. Durch hohe Leuchtdichte wird eine quasi diffuse Beleuchtung erreicht.6 schematically shows the illuminating
Es wird davon ausgegangen, daß das zur Erstellung der benutzten Tabellen (Matrizen) verwendete Gerät jeweils das selbe wie das zur konkreten Messung verwendete ist, so daß insofern keine Änderung des Volumens eintritt, oder daß nur Faktoren geändert werden, die herausgerechnet werden können.It is assumed that the device used to create the tables (matrices) used is the same as the one used for the specific measurement, so that there is no change in volume or that only factors that can be eliminated are changed.
Informationen über das unter bestimmten Verhältnissen erfaßte Volumen sind ebenfalls in Tabellenform erzeugbar. Die entsprechenden Werte können durch Messungen an Schnitten des Gewebes oder in Streukammern unter Simulation des Gewebes gewonnen werden.Information about the volume recorded under certain conditions can also be generated in tabular form. The corresponding values can be obtained by measurements on sections of the tissue or in scattering chambers with simulation of the tissue.
Den oben erwähnten Konzentrationswerten werden Volumina zugrundegelegt, die sich aus den Tabellen als Erfahrungswerte ergeben. Mit Hilfe eines besonderen Verfahrens lassen sich jedoch auch die Volumina korrigieren.The above-mentioned concentration values are based on volumes that result from the tables as empirical values. However, the volumes can also be corrected using a special procedure.
Erfindungsgemäß wird als Maß für die Eindringtiefe und damit das erfaßte Volumen die Verzerrung der gemessenen Hämoglobinkurve MII0 gegenüber der aus der Matrix (Tabelle) 2 (s. Fig. 5) ermittelten Standard-Remissionskurve RSII1 verwendet. Dazu wird die gemessene Hämoglobinkurve MII0 auf die ermittelte Standardkurve an der isosbestschen Wellenlänge normiert und die Differenz wellenlängenabhängig aufgetragen.According to the invention, the distortion of the measured hemoglobin curve MII0 compared to the standard remission curve RSII1 determined from the matrix (table) 2 (see FIG. 5) is used as a measure of the penetration depth and thus the volume measured. For this purpose, the measured hemoglobin curve MII0 is normalized to the determined standard curve at the isosbestic wavelength and the difference is plotted depending on the wavelength.
Fig. 7 zeigt (schematisch) ein Beispiel einer möglichen Standard-Remissionskurve RSII1 mit zwei Beispielen für mögliche Meßkurven MII0 und Fig. 8 die sich daraus jeweils ergebenden Differenz- oder Verzerrungskurven.FIG. 7 shows (schematically) an example of a possible standard remission curve RSII1 with two examples of possible measurement curves MII0 and FIG. 8 the resulting difference or distortion curves.
Wiederum in entsprechenden Vor-Messungen mit dem gleichen Gerät wurde eine Matrix solcher Verzerrungskurven erstellt und jedes Feld der Matrix einem erfaßten Volumen V (s. Fig. 6) zugeordnet. Diese Matrix ist hier nicht gezeigt.Again in corresponding preliminary measurements with the same device, a matrix of such distortion curves was created and each field of the matrix was assigned to a recorded volume V (see FIG. 6). This matrix is not shown here.
Auf diese Weise läßt sich das Volumen bestimmen und wiederum als Korrekturfaktor für die bisher ermittelten Werte der Konzentration und der Oxygenierung verwenden.In this way, the volume can be determined and in turn used as a correction factor for the previously determined values of concentration and oxygenation.
Die Erfindung ermöglicht mit einer in Fig. 9 gezeigten Lichtleiteranordnung und deren Verwendung in einem besonderen Verfahren auch die Bestimmung der Veränderung von Partikelgrößen im Gewebe. Diese Bestimmung ist von besonderer praktischer Bedeutung. Man kann damit bspw. eine Größenveränderung der Mitochondrien feststellen. Eine bevorzugte Ausführungsform der Vorrichtung ist in Fig. 9 schematisch gezeigt.With a light guide arrangement shown in FIG. 9 and its use in a special method, the invention also enables the change in particle sizes in the tissue to be determined. This provision is of particular practical importance. A change in size of the mitochondria, for example, can be determined with it. A preferred embodiment of the device is shown schematically in FIG. 9.
Die Vorrichtung besteht aus einer Anordnung eines mittig angeordneten beleuchtenden Lichtleiters 20 mit ca. 250 µm Durchmesser und linienförmig angeordneten detektierenden Lichtleitern, im Anwendungsbeispiel mit ca. 70 µm Durchmesser. Damit läßt sich, ggfs. nach Herausrechnen der sich durch die gegebene Anordnung ergebenden Winkelverzwerrung, die Verteilung des rückgestreuten Lichts in einem Querschnitt des Rückstreu-Volumens ermitteln. Da sich die Verteilung und Intensität des Lichtes in diesem Rückstreu-Volumen jedoch deutlich mit der Partikelgröße ändern, läßt ein Vergleich der aus den verschiedenen detektierenden Lichtleitern 21 bis 30 gewonnenen Remissionswerte im zeitlichen Verlauf einen Rückschluß auf die Änderung der Partikelgröße zu.The device consists of an arrangement of a centrally arranged illuminating
Bei Annahme von radialsymmetrischen Verhältnissen ist es auch bevorzugt, statt eines oder zweier Lichtleiter zu je einem bestimmten Abstand (und damit (Kegel-)Winkel) einen Kreis vom Radius des Abstandes aus Lichtleitern vorzusehen. Damit kann die zu einem bestimmten Abstand gehörende empfangene Lichtleistung erhöht werden, was durch Zusammenschalten der jeweils auf einem Kreis liegenden Lichtleiter und deren gemeinsame Auswertung nutzbar gemacht werden kann.When assuming radially symmetrical relationships, it is also preferred to provide a circle instead of one or two light guides at a certain distance (and thus (cone) angle) from the radius of the distance from light guides. In this way, the received light output belonging to a certain distance can be increased, which can be used by interconnecting the respective light guides lying on a circle and evaluating them together.
Fig. 10 zeigt die starke Veränderung der Intensität des rückgestreuten (180°) Lichtes in Abhängigkeit von der Partikelgröße (0,1 - 2 µm). Die Erfassung dieser Veränderung durch die Überwachung der zeitlichen Veränderung, insbesondere der relativen an den verschiedenen empfangenden Lichtleitern, ermöglicht daher eine sichere Überwachung der Veränderung z.B. der Größe der Mitochondrien und damit z.B. eine rechtzeitige Warnung bei der Entwicklung von Gehirnödemen.10 shows the strong change in the intensity of the backscattered (180 °) light as a function of the particle size (0.1-2 μm). The detection of this change by monitoring the change over time, in particular the relative one at the different receiving light guides, therefore enables reliable monitoring of the change, e.g. the size of the mitochondria and thus e.g. a timely warning when developing brain edema.
Fig. 11 zeigt graphisch die Änderung der Verteilung des Lichtes, die ebenfalls bei der Auswertung der relativen Remissionen auf die einzelnen bzw. Paare oder Kreise von empfangenden Lichtleitern (hier: 21 bis 30) genutzt werden kann.11 graphically shows the change in the distribution of the light, which can also be used in evaluating the relative remissions on the individual or pairs or circles of receiving light guides (here: 21 to 30).
Bei einer anderen, besonders bevorzugten Ausführungsform ist ein zentraler beleuchtender Lichtleiter 20 und ein Feld von bspw. 10 x 10 empfangenden Lichtleitern vorgesehen (vgl. auch Fig. 12). Dies ermöglicht die Messung ganzer Topographien von Oxygenierungs- und Farbstoffverteilungen.In another, particularly preferred embodiment, a central illuminating
Die aus den jeweiligen einzelnen Lichtleitern kommenden Informationen werden zunächst einzeln ausgewertet, wie oben für einen empfangenden Lichtleiter im Einzelnen geschildert und die Ergebnisse ergeben dann ein Topogramm der HB-Konzentration, ein Topogramm der HbO₂-Konzentration und Grundremissionstopogramme.The information coming from the respective individual light guides is first evaluated individually, as described in detail above for a receiving light guide, and the results then result in a topogram of the HB concentration, a topogram of the HbO₂ concentration and basic remission topograms.
Die Abfrage der Lichtleiter kann gleichzeitig sein, was dann eine entsprechende Anzahl der unten geschilderten Auswerteinheiten nötig macht. Bei der Kürze der Aufnahme eines vollständigen Spektrums in beiden Wellenlängenbereichen (ca. 1/100 s), können die Lichtleiter aber auch aufeinanderfolgend abgefragt werden, was einen Zeitunterschied von ca. einer sekunde ergibt, der häufig in Kauf genommen werden kann.The light guide can be queried at the same time, which then requires a corresponding number of the evaluation units described below. If a complete spectrum is short in both wavelength ranges (approx. 1/100 s), the light guides can also be queried in succession, which results in a time difference of approx. One second, which can often be accepted.
Der zeitliche Verlauf im Zusammenhang mit dem winkelabhängigen, korrigierten räumlichen Remissionsdiagramm, das durch die Anordnung erhalten wird, erlaußt wieder einen Rückschluß auf die Änderung der Teilchengröße.The time course in connection with the angle-dependent, corrected spatial remission diagram, which is obtained by the arrangement, again allows conclusions to be drawn about the change in particle size.
Die Auswertung der Winkelabhängigkeit sowohl was den Abstand vom beleuchtenden Lichtleiter als auch den Umfang von Kreisen um den beleuchtenden Lichtleiter betrifft, kann zur Feststellung von räumlichen Asymmetrien genutzt werden.The evaluation of the angle dependency, both in terms of the distance from the illuminating light guide and the scope of circles around the illuminating light guide, can be used to determine spatial asymmetries.
In einer weiteren Ausführungsform, die konkret in Fig. 12 dargestellt ist, befinden sich auch noch an den Seitenrändern, in deren Mitte, beleuchtende Lichtleiter 32 - 38, wodurch weitere Informationen über das Streuverhalten im Gewebe erhalten werden können. Das Einstrahlvolumen des zentralen Lichtleiters sowie die von den jeweiligen detektierenden Lichtleitern erfaßbaren Volumina werden an Einzelbeispielen in der Zeichnung schematisch dargestellt.In a further embodiment, which is shown concretely in FIG. 12, illuminating light guides 32-38 are also located on the side edges, in the middle thereof, as a result of which further information about the scattering behavior in the tissue can be obtained. The irradiation volume of the central light guide and the volumes detectable by the respective detecting light guides are shown schematically in the drawing using individual examples.
In Fig. 13 ist der Grundaufbau des Erlanger Mikrolichtleiter-Spektralphotometers gezeigt. Das Licht einer Xenon-Hochdrucklampe 40 (z.B. XBO 75 W/2, Osram) die von einer Versorgungseinrichtung 42 (stabilisiertes Netzgerät) gespeist wird, wird über ein optisches System 44 in den beleuchtenden Lichtleiter 4 eingestrahlt. Dieser ist mit dem detektierenden Lichtleiter 6 so zusammengefaßt, daß die jeweiligen Endflächen in einer Ebene und unmittelbar nebeneinander liegen (in Fig. 13 nicht gezeigt). Das Lichtleiterpaar (bzw. die Anordnung aus Fig. 9 oder Fig. 12) wird dann auf die Gewebeoberfläche 46 aufgesetzt. Über den aufnehmenden Lichtleiter 6 gelangt das Licht an eine Interferenzverlaufsfilterscheibe 48. Diese enthält in der Erfindung, im Gegensatz zu den bisher für die Gewebespektrophotometrie verwendeten Interferenzverlaufsfilterscheiben, den Wellenlängenbereich von 500 bis hinauf zu 850 nm. Es ist ersichtlich, daß dann die Messung der Kurven MI0 und MII0 praktisch gleichzeitig erfolgen kann und die Reihenfolge nur von der Drehrichtung der Filterscheibe abhängt. Das Licht des von der Interferenzverlaufsfilterscheibe 48 gerade durchgelassenen Wellenlängenbereichs (die Auflösung beträgt ca. 2 nm) wird über einen Lichtleiter 50 an einen Photovervielfacher 52 gegeben. Über ein Verstärkersystem 54 gelangt das Signal zu einem Analog/Digital-Wandler 56 und nach der Digitalisierung zu einem Rechner (auch in 56) zur weiteren Verarbeitung.13 shows the basic structure of the Erlangen microlight guide spectrophotometer. The light from a xenon high-pressure lamp 40 (e.g. XBO 75 W / 2, Osram), which is fed by a supply device 42 (stabilized power supply unit), is radiated into the illuminating
Um welche Wellenlänge es sich jeweils handelt, wird dadurch ermittelt, daß an der Welle des die Filterscheibe 48 antreibenden Motors 58 eine Dekodierscheibe 60 angeordnet ist, und die Steuersignale an eine EPROM 62 abgibt. Der EPROM 62 wandelt die Steuersignale in Triggersignale für die Digitalisierung des Meßsignals durch den A/D-Wandler 56. Ferner erzeugt die Dekodierscheibe noch einen Impuls, der den Beginn jeder Scheibendrehung markiert und welcher die Digitalisierung des A/D-Wandlers initialisiert.Which wavelength is involved is determined in that a
Das vorliegende Verfahren arbeitet mit Absolutwerten der Remission. Daher wird der Eichung der gesamten Anordnung besondere Aufmerksamkeit geschenkt.The present method works with absolute values of remission. Special attention is therefore paid to the calibration of the entire arrangement.
Fig. 14 zeigt die Einrichtung zur Festlegung eines weißen Spektrums. Die spektrale Verteilung des Lichtes der Xenon-Bogenlampe, die Übertragungseigenschaften der optischen Elemente (Linsen, Lichtleiter) und die spektrale Empfindlichkeit des Photovervielfachers ergeben eine wellenlängenabhängige Antwortfunktion für weißes Licht. Diese kann durch das Spektrum eines Weißstandards, hier BaSO₄, unter Verwendung der in Fig. 14 gezeigten, an sich bekannten Vorrichtung gemessen werden.14 shows the device for determining a white spectrum. The spectral distribution of the light from the xenon arc lamp, the transmission properties of the optical elements (lenses, light guides) and the spectral sensitivity of the photomultiplier result in a wavelength-dependent response function for white light. This can be measured by the spectrum of a white standard, here BaSO₄, using the known device shown in FIG. 14.
Der beleuchtende (4) und der aufnehmende (6) Lichtleiter werden in der auch bei der Messung verwendeten Anordnung in einen Tropfen Immersionsflüssigkeit 70 (0,9 % NaCl) auf eine Glasplatte 72 senkrecht aufgesetzt. Die Glasplatte schafft einen festen Abstand zum Weißnormal 74. Der Schnittbereich 76 der Lichtkegel entspricht dem Volumen V. Um den Intensitätsbereich festzulegen, muß eine wellenlängenabhängige Dunkelkurve abgespeichert werden.The illuminating (4) and the receiving (6) light guide are placed vertically in a drop of immersion liquid 70 (0.9% NaCl) on a
Die Korrektur der spektrophotometrischen Messungen wird in vier Schritten durchgeführt. Hierzu wird auf Fig. 15 und 16 Bezug genommen.
- 1. Das aufgezeichnete, gemessene Spektrum RS wird von der Dunkelkurve DC abgezogen.
- 2. Das Spektrum des BaSo₄-Weißnormals (BaSt) wird ebenfalls von der Dunkelkurve (DC) abgezogen (DC-BaSt = TF).
- 3. Die Division (DC-RS)/(DC-BaSt) ergibt das korrigierte Spektrum CS - (Fig. 16).
- 4. Zur Darstellung wird das korrigierte Spektrum mit -1 multipliziert.
- 1. The recorded, measured spectrum RS is subtracted from the dark curve DC.
- 2. The spectrum of the BaSo₄ white standard (BaSt) is also subtracted from the dark curve (DC) (DC-BaSt = TF).
- 3. The division (DC-RS) / (DC-BaSt) gives the corrected spectrum CS - (Fig. 16).
- 4. For the display, the corrected spectrum is multiplied by -1.
Zur Gewinnung von Absolutwerten der Konzentration, und da die Messungen der Kurven MI0 und MII0 einerseits und die Messung der Standard-Grundremissionskurven und anderer der geschilderten Vergleichskurven andererseits durchaus zu verschiedenen Zeiten durchgeführt werden kann, ist eine Absoluteichung bspw. des Photovervielfachers und anderer ggfs. verwendeter Lichtmeßeinrichtungen besonders wichtig. Hierzu wird eine Normallichtquelle, bevorzugt in Form eines Beta-Lichts, verwendet, bei welcher Zinksulfid oder ein anderer radiolumineszierender Stoff durch radioaktive Zerfallsprodukte, insbesondere Beta-Strahlen des Tritiums, angeregt wird. Dies ist näher in der älteren deutschen Patentanmeldung "Normallichtquelle" des gleichen Anmelders und der gleichen Erfinder, amtl. Aktenzeichen P 38 16 489.2 33 beschrieben, auf die ausdrücklich verwiesen wird.In order to obtain absolute values of the concentration, and since the measurements of the curves MI0 and MII0 on the one hand and the measurement of the standard basic remission curves and other of the comparison curves described on the other hand can be carried out at different times, an absolute calibration, e.g. of the photomultiplier and others, may be used Light measuring devices particularly important. For this purpose, a normal light source, preferably in the form of beta light, is used, in which zinc sulfide or another radioluminescent substance is excited by radioactive decay products, in particular beta rays of the tritium. This is described in more detail in the older German patent application "Normallichtquelle" by the same applicant and the same inventor, official
Claims (32)
bei dem Licht unterschiedlicher Wellenlängen in einen Teilbereich des Gewebes eingestrahlt wird,
zumindest ein Teil des rückgestreuten Lichtes aufgefangen und die Remission in Abhängigkeit von der Wellenlänge bestimmt wird und die Konzentration von Farbstoffen aus dem spektralen Remissionsgrad bestimmt wird,
dadurch gekennzeichnet,
daß in einem Schritt (1.1.) Strahlung aus einem ersten Wellenlängenbereich (I), in dem der Einfluß des Hämoglobins (Hb) auf die Remission gering ist, eingestrahlt und die Remission (MI0) in diesem Wellenlängenbereich (I) bestimmt wird,
daß in einem gesonderten Schritt (1.2.),Licht aus einem zweiten Wellenlängenbereich (II), in dem die Remission vom Einfluß des Hämoglobins dominiert wird, in den gleichen Teilbereich des Gewebes eingestrahlt wird und die Remission (MII0) in diesem Wellenlängenbereich (II) bestimmt wird,
daß (2.), anhand der Remission (MI0) im ersten Wellenlängenbereich (I) und mindestens einer vorab (0.) gewonnenen gewebeartspezifischen Standard-Grundremissionskurve für beide Wellenlängenbereiche eine gewebepersonenspezifische Standard-Grundremissionskurve (SI0) für den zweiten Wellenlängenbereich (II) ermittelt wird, und
daß (3.) anhand der ermittelten gewebepersonenspezifischen Standard-Grundremissionskurve (S110) und der gemessenen Remission (MI0) im zweiten Wellenlängenbereich (I) ein Wert für die Hämoglobinkonzentration (KHb1) gewonnen wird.1. method for determining local dye concentrations in animal and human tissues,
in which light of different wavelengths is radiated into a partial area of the tissue,
at least part of the backscattered light is collected and the reflectance is determined as a function of the wavelength and the concentration of dyes is determined from the spectral reflectance,
characterized,
that in a step (1.1.) radiation from a first wavelength range (I) in which the influence of hemoglobin (Hb) on the remission is small is irradiated and the remission (MI0) is determined in this wavelength range (I),
that in a separate step (1.2.), light from a second wavelength range (II), in which the remission is dominated by the influence of hemoglobin, is radiated into the same part of the tissue and the remission (MII0) in this wavelength range (II) is determined
that (2.), based on the reflectance (MI0) in the first wavelength range (I) and at least one previously obtained (0.) tissue-specific standard basic remission curve for both wavelength ranges, determines a tissue-specific standard basic remission curve (SI0) for the second wavelength range (II) will, and
that (3.) a value for the hemoglobin concentration (KHb1) is obtained on the basis of the standard basic remission curve (S110) determined and the remission (MI0) measured in the second wavelength range (I).
und daß (2.:1.) die gemessene Remissionskurve im ersten Wellenlängenbereich, (MI0), dem nächstpassenden Ast im ersten Wellenlängenbereich (I) aus der Schar der Standard-Grundremissionskurven zugeordnet wird und der zugehörige Ast dieser Standard-Grundremissionskurve im zweiten Wellenlängenbereich (I) als gewebepersonenspezifische Standard-Grundremissionskurve (SII0) ausgewählt wird.2. The method according to claim 1, characterized in that a group of tissue-specific standard basic remission curves is obtained beforehand (0.:1.) On tissue samples of the same tissue type,
and that (2.:1.) the measured remission curve in the first wavelength range, (MI0), is assigned to the next matching branch in the first wavelength range (I) from the family of standard basic remission curves and the associated branch of this standard basic remission curve in the second wavelength range ( I) is selected as the tissue basic standard remission curve (SII0).
und daß (2.:2.) die gemessene Remissionskurve im ersten Wellenlängenbereich, (MI0), zu der gemittelten Standard-Grundremissionskurve ins Verhältnis gesetzt wird, und aus dem gewonnenen Verhältnis und dem Teil der gewebeartspezifischen gemittelten Standard-Grundremissionskurve im zweiten Wellenlängenbereich (II) eine gewebepersonenspezifische Standard-Grundremissionskurve (SII0) im zweiten Wellenlängenbereich (II) gewonnen wird.4. The method according to claim 1, characterized in that an averaged tissue type-specific standard basic remission curve on tissue samples of the same tissue type is obtained beforehand (0.:2.),
and that (2.:2.) the measured remission curve in the first wavelength range, (MI0), is related to the averaged standard basic remission curve, and from the ratio obtained and the part of the tissue-specific averaged standard basic remission curve in the second wavelength range (II ) a tissue-specific standard basic remission curve (SII0) in the second wavelength range (II) is obtained.
dadurch gekennzeichnet, daß
(4.) anhand des für die Hämoglobinkonzentration gewonnenen Wertes (KHb1) die gemessene Kurve (MI0) im ersten Wellenlängenbereich (I) korrigiert wird, wodurch eine weitere, verbesserte Näherung für die gewebepersonenspezifische Grundremission im ersten Wellenlängenbereich, GI1, gewonnen wird.6. The method according to any one of claims 1 to 5,
characterized in that
(4.) the measured curve (MI0) in the first wavelength range (I) is corrected on the basis of the value (KHb1) obtained for the hemoglobin concentration, whereby a further, improved approximation for the tissue-specific basic remission in the first wavelength range, GI1, is obtained.
dadurch gekennzeichnet, daß
die Schritte 2.bis 4.n-fach, unter Zugrundelegung der jeweils verbesserten Werte bzw. Kurven, wiederholt werden.8. The method according to claim 6 or 7,
characterized in that
Repeat steps 2 to 4 n times, based on the respectively improved values or curves.
dadurch gekennzeichnet,
daß der erste Wellenlängenbereich (I) der Bereich von 630 nm bis 1000 nm ist.9. Method according to one of claims 1 to 8,
characterized,
that the first wavelength range (I) is the range from 630 nm to 1000 nm.
dadurch gekennzeichnet,
daß der erste Wellenlängenbereich (I) der Bereich von 750 nm bis 850 nm ist.10. The method according to any one of claims 1 to 8,
characterized,
that the first wavelength range (I) is the range from 750 nm to 850 nm.
dadurch gekennzeichnet,
daß der zweite Wellenlängenbereich (II) der Bereich von 500 nm bis 620 nm ist.11. The method according to any one of claims 1 to 10,
characterized,
that the second wavelength range (II) is the range from 500 nm to 620 nm.
dadurch gekennzeichnet,
daß der zweite Wellenlängenbereich (II) der Bereich von 550 nm bis 570 nm ist.12. The method according to any one of claims 1 to 10,
characterized,
that the second wavelength range (II) is the range from 550 nm to 570 nm.
dadurch gekennzeichnet, daß
(5.:1.) aus einer gewebepersonenspezifischen Standard-Grundremissionskurve (S11n) und der gemessenen Remissionskurve (MII0) im zweiten Wellenlängenbereich eine "reine" (II) Hämoglobinkurve (HII0) gewonnen wird,
daß vorab (6.:1.) durch Überlagerung zweier reiner Standard-Hämoglobinkurven, nämlich für 0% und 100% Oxygenierung, mit unterschiedlicher Gewichtung eine Schar von "reinen" Hämoglobinkurven im Bereich 0% bis 100% Oxygenierung erhalten wird, und
daß (7.:1.) die "reine" Hämoglobinkurve (HII0), nach Normierung auf 1, mit den ebenfalls normierten Kurven der Schar verglichen wird, die nächstpassende ausgewählt wird und deren Oxygenierung als Wert der Oxygenierung der gemessenen Kurve (MII0) angenommen wird.13. A method for determining the oxygenation of hemoglobin, in particular using one or more of the curves from one of the methods according to one or more of claims 1 to 12,
characterized in that
(5.:1.) A "pure" (II) hemoglobin curve (HII0) is obtained from a tissue-specific standard basic remission curve (S11n) and the measured remission curve (MII0) in the second wavelength range,
that a group of "pure" hemoglobin curves in the range 0% to 100% oxygenation is obtained beforehand (6.:1.) by superimposing two pure standard hemoglobin curves, namely for 0% and 100% oxygenation, with different weights, and
that (7.:1.) the "pure" hemoglobin curve (HII0), after normalization to 1, is compared with the likewise normalized curves of the group, the next most suitable is selected and its oxygenation is taken as the value of the oxygenation of the measured curve (MII0) becomes.
dadurch gekennzeichnet, daß
vorab (6.:2.) anhand einer Vielzahl von Messungen an der gleichen Gewebeart, mit Hämoglobin unterschiedlicher Konzentration und unterschiedlicher Oxygenierung, eine zweidimensionale Schar von Vergleichskurven (Fig. 5) erstellt wird,
daß (7.:2.) die Vergleichskurven mit Hämoglobinkonzentrationen in der Umgebung der ermittelten (3.) Konzentration (KHbn) über den ganzen Oxygenierungsbereich durchsucht werden, und die bestpassende der Vergleichskurven einen angenommenen Wert für die Oxygenierung und einen verbesserten Wert (KHbn+1) für die Konzentration liefert.14. A method for determining the oxygenation of hemoglobin using one of the concentration values (KHb n ) and in particular the curves from one of the methods according to one or more of claims 1 to 12,
characterized in that
a two-dimensional set of comparison curves (FIG. 5) is created beforehand (6.:2.) on the basis of a large number of measurements on the same type of tissue, with hemoglobin of different concentration and different oxygenation,
that (7.:2.) the comparison curves with hemoglobin concentrations in the vicinity of the determined (3rd) concentration (KHb n ) are searched over the entire oxygenation range, and the most suitable of the comparison curves an assumed value for oxygenation and an improved value (KHb n + 1 ) for the concentration.
dadurch gekennzeichnet, daß die Werte für die Konzentration (KHbn+1) und die Oxygenierung im vierten Schritt (4.) zur Gewinnung einer verbesserten gewebepersonenspezifischen Grundremissionskurve (GIn+1) verwendet werden.15. The method according to any one of claims 13 or 14,
characterized in that the values for the concentration (KHb n + 1 ) and the oxygenation in the fourth step (4th) are used to obtain an improved tissue-specific basic remission curve (GI n + 1 ).
dadurch gekennzeichnet, daß die gemessene Remissionskurve (MII0) auf die nächstpassende Kurve aus der zweidimensionalen Schar normiert wird (Fig.7), die Differenz zwischen den beiden Kurven wellenlängenabhängig aufgetragen wird (Fig.8) und als Maß der Verzerrung zur Ermittlung der Eindringtiefe des eingestrahlten Lichtes, d.h. des durch das Licht erfaßten Volumens V, benutzt wird.16. The method according to claim 14,
characterized in that the measured remission curve (MII0) is normalized to the closest matching curve from the two-dimensional array (Fig. 7), the difference between the two curves is plotted as a function of wavelength (Fig. 8) and as a measure of the distortion for determining the penetration depth of the radiated light, ie the volume V detected by the light, is used.
dadurch gekennzeichnet,
daß die Interferenz-Verlaufsfilterscheibe (48) sowohl den ersten Wellenlängenbereich (I) als auch den zweiten Wellenlängenbereich - (II) aufweist.17. Use of the Erlangen micro-optical fiber spectrophotometer for determining the local dye concentration by a method according to one of the preceding claims,
characterized,
that the interference waveform filter disk (48) has both the first wavelength range (I) and the second wavelength range - (II).
gekennzeichnet durch
einen Licht in das Gewebe einstrahlenden Lichtleiter (20), mindestens zwei davon radial unterschiedlich beabstandete, das rückgestreute Licht aufnehmende Lichtleiter (21, 22, ..., 30), die vorzugsweise linienförmig zu beiden Seiten des beleuchtenden Lichtleiters (20) angeordnet sind, und eine Auswerteinheit für jeden der Lichtleiter, die die zeitliche Änderung der rückgestreuten Intensität relativ zu den anderen Lichtleitern feststellt und auswertet.19. Device for determining size changes in tissue particles,
marked by
a light guide (20) radiating into the tissue, at least two light guides (21, 22,..., 30) radially differently spaced therefrom and receiving the backscattered light, which are preferably arranged in a line on both sides of the illuminating light guide (20), and an evaluation unit for each of the light guides, which determines and evaluates the temporal change in the backscattered intensity relative to the other light guides.
mit einer beleuchtenden Einrichtung (4), mit der Licht unterschiedlicher Wellenlängen in einen Teilbereich des Gewebes einstrahlbar ist,
einer lichtaufnehmenden Einrichtung (6), mit der zumindest ein Teil des rückgestreuten Lichtes auffangbar ist,
und einer Auswert-Einrichtung (48, 52, 54, 56), die die Remission in Abhängigkeit von der Wellenlänge bestimmt
und die Konzentration von Farbstoffen aus dem spektralen Remissionsgrad bestimmt,
dadurch gekennzeichnet,
daß die beleuchtende Einrichtung (4) in einem Schritt (1.1.) Strahlung aus einem ersten Wellenlängenbereich (I), in dem der Einfluß des Hämoglobins (Hb) auf die Remission gering ist, einstrahlt und die Auswert-Einrichtung (48, 52, 54, 56) die Remission (MI0) in diesem Wellenlängenbereich (I) bestimmt, daß die beleuchtende Einrichtung (4) in einem gesonderten Schritt (1.2.) Licht aus einem zweiten Wellenlängenbereich (II), in dem die Remission vom Einfluß des Hämoglobins dominiert wird, in den gleichen Teilbereich des Gewebes einstrahlt und die Auswert-Einrichtung (48, 52, 54, 56) die Remission (MII0) in diesem Wellenlängenbereich (II) bestimmt,
daß (2.) die Vorrichtung, anhand der Remission (MI0) im ersten Wellenlängenbereich (I) und mindestens einer vorab (0.) gewonnenen, abgespeicherten gewebeartspezifischen Standard-Grundremissionskurve für beide Wellenlängenbereiche eine gewebepersonenspezifische Standard-Grundremissionskurve (SII0) für den zweiten Wellenlängenbereich (II) ermittelt (56), und
daß (3.) die Vorrichtung anhand der ermittelten gewebepersonenspezifischen Standard-Grundremissionskurve (SII0) und der gemessenen Remission (MII0) im zweiten Wellenlängenbereich (II) einen Wert für die Hämoglobinkonzentration (KHb1) liefert.20. Device for determining local dye concentrations in animal and human tissues,
with an illuminating device (4) with which light of different wavelengths can be radiated into a partial area of the tissue,
a light-receiving device (6) with which at least part of the backscattered light can be caught,
and an evaluation device (48, 52, 54, 56) which determines the reflectance as a function of the wavelength
and determines the concentration of dyes from the spectral reflectance,
characterized,
that the illuminating device (4) radiates in a step (1.1.) radiation from a first wavelength range (I) in which the influence of the hemoglobin (Hb) on the remission is small, and the evaluation device (48, 52, 54 , 56) the remission (MI0) in this wavelength range (I) determines that the illuminating device (4) in a separate step (1.2.) Light from a second wavelength range (II) in which the remission is dominated by the influence of hemoglobin radiates into the same part of the tissue and the evaluation device (48, 52, 54, 56) determines the remission (MII0) in this wavelength range (II),
that (2.) the device, based on the reflectance (MI0) in the first wavelength range (I) and at least one previously obtained (0.) tissue-specific standard basic remission curve for both wavelength ranges, a tissue-specific standard basic remission curve (SII0) for the second wavelength range (II) determined (56), and
that (3.) the device provides a value for the hemoglobin concentration (KHb1) based on the tissue-specific standard basic remission curve (SII0) and the measured remission (MII0) in the second wavelength range (II).
eine Schar vorab (0.:1.) an Gewebeproben der gleichen Gewebeart gewonnener gewebeartspezifischer Standard-Grundremissionskurven gespeichert hat,
und daß (2.:1. ein Rechner (56) die gemessene Remissionskurve im ersten Wellenlängenbereich, (MI0), dem nächstpassenden Ast im ersten Wellenlängenbereich (I) aus der Schar der Standard-Grundremissionskurven zuordnet und den zugehörigen Ast dieser Standard-Grundremissionskurve im zweiten Wellenlängenbereich (II) als gewebepersonenspezifische Standard-Grundremissionskurve (SII0) auswählt.21. The apparatus according to claim 20, characterized in that it
has saved a group in advance (0.:1.) of tissue type-specific standard basic remission curves obtained from tissue samples of the same tissue type,
and that (2.:1. a computer (56) assigns the measured remission curve in the first wavelength range, (MI0), the next matching branch in the first wavelength range (I) from the family of standard basic remission curves and the associated branch to this standard basic remission curve in second wavelength range (II) as tissue-specific standard basic remission curve (SII0).
und daß (2.:2.) er (56) die gemessene Remissionskurve im ersten Wellenlängenbereich, (MI0), zu der gemittelten Standard-Grundremissionskurve ins Verhältnis setzt, und aus dem gewonnenen Verhältnis und dem Teil der gewebeartspezifischen gemittelten Standard-Grundremissionskurve im zweiten Wellenlängenbereich (II) eine gewebepersonenspezifische Standard-Grundremissionskurve (S110) im zweiten Wellenlängenbereich (II) bildet.23. The device according to claim 20, characterized in that a computer (56) has stored an average tissue type-specific standard remission curve obtained beforehand (0.:2.) On tissue samples of the same tissue type,
and that (2.:2.) he (56) relates the measured remission curve in the first wavelength range, (MI0), to the averaged standard basic remission curve, and from the ratio obtained and the part of the tissue-specific averaged standard basic remission curve in the second Wavelength range (II) forms a tissue-specific standard basic remission curve (S110) in the second wavelength range (II).
dadurch gekennzeichnet, daß
der Rechner (56) (4.) anhand des für die Hämoglobinkonzentration gewonnenen Wertes (KHb1) die gemessene Kurve (MI0) im ersten Wellenlängenbereich (I) korrigiert, wodurch er (56) eine weitere, verbesserte Näherung für die gewebepersonenspezifische Grundremission im ersten Wellenlängenbereich, GI1, bildet.25. The device according to one of claims 20 to 24,
characterized in that
the computer (56) (4.) corrects the measured curve (MI0) in the first wavelength range (I) on the basis of the value (KHb1) obtained for the hemoglobin concentration, whereby it (56) provides a further, improved approximation for the tissue-specific basic remission in the first wavelength range , GI1, forms.
dadurch gekennzeichnet, daß
der Rechner (56) die Schritte 2. bis 4. n-fach, unter Zugrundelegung der jeweils verbesserten Werte bzw. Kurven, wiederholt.27. The apparatus of claim 25 or 26,
characterized in that
the computer (56) repeats steps 2 to 4 n times, on the basis of the respectively improved values or curves.
dadurch gekennzeichnet,
daß der erste Wellenlängenbereich (I) der Bereich von 630 nm bis 1000 nm, besonders bevorzugt der Bereich von 750 nm bis 850 nm, ist, und
daß der zweite Wellenlängenbereich (I) der Bereich von 500 nm bis 620 nm, besonders bevorzugt der Bereich von 550 nm bis 570 nm, ist.28. Device according to one of claims 20 to 27,
characterized,
that the first wavelength range (I) is the range from 630 nm to 1000 nm, particularly preferably the range from 750 nm to 850 nm, and
that the second wavelength range (I) is the range from 500 nm to 620 nm, particularly preferably the range from 550 nm to 570 nm.
dadurch gekennzeichnet, daß
(5.:1.) der Rechner (56) der Vorrichtung aus einer gewebepersonenspezifischen Standard-Grundremissionskurve (SIIn) und der gemessenen Remissionskurve (MII0) im zweiten Wellenlängenbereich eine "reine" (II) Hämoglobinkurve (HII0) bildet,
daß der Rechner vorab (6.:1.) durch Überlagerung zweier reiner Standard-Hämoglobinkurven, nämlich für 0% und 100% Oxygenierung, mit unterschiedlicher Gewichtung eine Schar von "reinen" Hämoglobinkurven im Bereich 0% bis 100% Oxygenierung gebildet hat, und (7.:1.) die "reine" Hämoglobinkurve (HII0), nach Normierung auf 1, mit den ebenfalls normierten Kurven der Schar vergleicht, die nächstpassende auswählt und deren Oxygenierung als Wert der Oxygenierung der gemessenen Kurve (MII0) liefert.29. Device for determining the oxygenation of hemoglobin, in particular one in which one or more of the curves obtained by a device according to one or more of claims 20 to 28 are stored,
characterized in that
(5.:1.) The computer (56) of the device forms a “pure” (II) hemoglobin curve (HII0) from a tissue-specific standard basic remission curve (SIIn) and the measured remission curve (MII0) in the second wavelength range,
that the computer has previously (6.:1.) formed a group of "pure" hemoglobin curves in the range 0% to 100% oxygenation by superimposing two pure standard hemoglobin curves, namely for 0% and 100% oxygenation, with different weights, and (7.:1.) Compares the "pure" hemoglobin curve (HII0), after normalization to 1, with the likewise normalized curves of the group, selects the next suitable curve and delivers its oxygenation as the value of the oxygenation of the measured curve (MII0).
dadurch gekennzeichnet, daß
die Vorrichtung vorab (6.:2.) anhand einer Vielzahl von Messungen an der gleichen Gewebeart, mit Hämoglobin unterschiedlicher Konzentration und unterschiedlicher Oxygenierung, eine zweidimensionale Schar von Vergleichskurven (Fig. 5) erstellt, (7.:2.) die Vergleichskurven mit Hämoglobinkonzentrationen in der Umgebung der ermittelten (3.) Konzentration (KHbn) über den ganzen Oxygenierungsbereich durchsucht, und aus der bestpassenden der Vergleichskurven einen angenommenen Wert für die Oxygenierung und einen verbesserten Wert (KHbn+1) für die Konzentration bildet.30. Device for determining the oxygenation of hemoglobin, in which one of the concentration values (KHb n ) and in particular the curves which are formed by a device according to one or more of claims 20 to 28, are stored,
characterized in that
the device in advance (6.:2.) based on a large number of measurements on the same type of tissue, with different hemoglobin Concentration and different oxygenation, a two-dimensional set of comparison curves (Fig. 5) created, (7.:2.) The comparison curves with hemoglobin concentrations in the vicinity of the determined (3rd) concentration (KHb n ) searched over the entire oxygenation range, and out the best fitting of the comparison curves forms an assumed value for the oxygenation and an improved value (KHb n + 1 ) for the concentration.
dadurch gekennzeichnet, daß sie die Werte für die Konzentration (KHnn+1) und die Oxygenierung im vierten Schritt (4.) zur Gewinnung einer verbesserten gewebepersonenspezifischen Grundremissionskurve (GIn+1) verwendet.31. Device according to one of claims 29 or 30,
characterized in that it uses the values for the concentration (KHn n + 1 ) and the oxygenation in the fourth step (4th) to obtain an improved tissue-specific basic remission curve (GI n + 1 ).
dadurch gekennzeichnet, daß sie die gemessene Remissionskurve (M110) auf die nächstpassende Kurve aus der zweidimensionalen Schar normiert (Fig.7), die Differenz zwischen den beiden Kurven wellenlängenabhängig aufträgt (Fig.8) und als Maß der Verzerrung zur Ermittlung der Eindringtiefe des eingestrahlten Lichtes, d.h. des durch das Licht erfaßten Volumens V, benutzt.32. Device according to claim 30,
characterized in that it normalizes the measured remission curve (M110) to the closest matching curve from the two-dimensional family (Fig. 7), plots the difference between the two curves depending on the wavelength (Fig. 8) and as a measure of the distortion for determining the penetration depth of the irradiated Light, ie the volume V detected by the light, is used.
Applications Claiming Priority (2)
| Application Number | Priority Date | Filing Date | Title |
|---|---|---|---|
| DE3825352 | 1988-07-26 | ||
| DE3825352A DE3825352A1 (en) | 1988-07-26 | 1988-07-26 | METHOD AND DEVICE FOR DETERMINING LOCAL DYE CONCENTRATIONS AND SPREADING PARAMETERS IN ANIMAL AND HUMAN TISSUES |
Publications (2)
| Publication Number | Publication Date |
|---|---|
| EP0353619A1 true EP0353619A1 (en) | 1990-02-07 |
| EP0353619B1 EP0353619B1 (en) | 2001-12-12 |
Family
ID=6359575
Family Applications (1)
| Application Number | Title | Priority Date | Filing Date |
|---|---|---|---|
| EP89113803A Expired - Lifetime EP0353619B1 (en) | 1988-07-26 | 1989-07-26 | Process for determination of local dye-concentrations in animal and human tissue |
Country Status (5)
| Country | Link |
|---|---|
| US (1) | US5645061A (en) |
| EP (1) | EP0353619B1 (en) |
| JP (2) | JPH067828B2 (en) |
| AT (1) | ATE210406T1 (en) |
| DE (2) | DE3825352A1 (en) |
Cited By (3)
| Publication number | Priority date | Publication date | Assignee | Title |
|---|---|---|---|---|
| EP0442011A1 (en) * | 1990-02-15 | 1991-08-21 | Hewlett-Packard GmbH | Sensor, apparatus and method for non-invasive measurement of oxygen saturation |
| DE4393335D2 (en) * | 1992-11-09 | 1994-07-21 | Boehringer Mannheim Gmbh | Method and device for analyzing glucose in a biological matrix |
| DE4337570A1 (en) * | 1993-11-04 | 1995-05-11 | Boehringer Mannheim Gmbh | Method for the analysis of glucose in a biological matrix |
Families Citing this family (11)
| Publication number | Priority date | Publication date | Assignee | Title |
|---|---|---|---|---|
| DE9110757U1 (en) * | 1991-08-30 | 1992-02-13 | Klein, Rainer, 5840 Schwerte, De | |
| JP2586278B2 (en) * | 1992-03-30 | 1997-02-26 | 株式会社島津製作所 | Absorbance origin standard of light measurement device |
| US20050245850A1 (en) * | 1994-03-30 | 2005-11-03 | Freyre Carlos V | Method and apparatus for inhibiting the growth of and shrinking cancerous tumors |
| DE19512478C2 (en) * | 1994-08-10 | 2001-05-31 | Bernreuter Peter | Method for determining arterial oxygen saturation |
| CA2210791A1 (en) * | 1997-07-18 | 1999-01-18 | The University Of Manitoba | Diagnosis of edema |
| US6850656B1 (en) | 1998-10-07 | 2005-02-01 | Ecole Polytechnique Federale De Lausanne | Method and apparatus for measuring locally and superficially the scattering and absorption properties of turbid media |
| US6615068B1 (en) * | 2000-01-20 | 2003-09-02 | The Research Foundation Of Cuny | Technique for examining biological materials using diffuse reflectance spectroscopy and the kubelka-munk function |
| FR2806609B1 (en) * | 2000-03-24 | 2002-10-11 | Medick S A | METHOD AND DEVICE FOR NON-INVASIVE MEASUREMENT OF TISSUE AND IN PARTICULAR OF THE BILIRUBIN LEVEL OF THE SKIN |
| EP1860995A1 (en) * | 2005-03-01 | 2007-12-05 | Masimo Laboratories, Inc. | Multiple wavelength sensor substrate |
| US20090312646A1 (en) * | 2007-09-13 | 2009-12-17 | The Regents Of The University Of California | Optical detection of seizure, a pre-seizure state, and cerebral edema and optical fiber detection of the same |
| DE102009043523A1 (en) * | 2009-09-30 | 2011-04-07 | Siemens Aktiengesellschaft | endoscope |
Citations (2)
| Publication number | Priority date | Publication date | Assignee | Title |
|---|---|---|---|---|
| DE3008651A1 (en) * | 1979-03-07 | 1980-10-16 | Hiroshi Abe | METHOD OF MEASUREMENT OF PNEUSIS FUNCTION |
| EP0046601A2 (en) * | 1980-08-26 | 1982-03-03 | Hellige GmbH | Method and device for the colorimetric determination of the concentration of a chemical substance, especially the partial pressure of a blood-dissolved gas |
Family Cites Families (21)
| Publication number | Priority date | Publication date | Assignee | Title |
|---|---|---|---|---|
| US455179A (en) * | 1891-06-30 | Horse-detacher | ||
| US455579A (en) | 1891-07-07 | Hand-car | ||
| US3612689A (en) * | 1967-04-10 | 1971-10-12 | American Standard Inc | Suspended particle concentration determination using polarized light |
| US3830568A (en) * | 1973-05-25 | 1974-08-20 | Texas Instruments Inc | Multiple detection volume laser doppler velocimeter |
| US3916197A (en) * | 1973-11-28 | 1975-10-28 | Particle Technology Inc | Method and apparatus for classifying biological cells |
| US4114604A (en) * | 1976-10-18 | 1978-09-19 | Shaw Robert F | Catheter oximeter apparatus and method |
| US4281645A (en) * | 1977-06-28 | 1981-08-04 | Duke University, Inc. | Method and apparatus for monitoring metabolism in body organs |
| US4463762A (en) * | 1977-10-18 | 1984-08-07 | Institute Of Applied Biology Special Cancer Research Project | Apparatus for obtaining an objective determination of the rate of oxygen utilization in peripheral tissue |
| JPS54123084A (en) * | 1978-03-16 | 1979-09-25 | Aroozu Kk | Optical mechanism |
| US4178917A (en) * | 1979-01-03 | 1979-12-18 | Shapiro Howard M | Method and system for non-invasive detection of zinc protoporphyrin in erythrocytes |
| FR2448145A2 (en) * | 1979-02-05 | 1980-08-29 | Oreal | APPARATUS FOR TRACKING THE QUANTITY OF SEBUM SECRETED BY A SKIN |
| DE3019234C2 (en) * | 1980-05-20 | 1984-08-30 | Duke University Inc., Durham, N.C. | Device for in vivo blood measurement |
| ATE23752T1 (en) * | 1980-08-21 | 1986-12-15 | Oriel Scient Ltd | OPTICAL ANALYZER. |
| JPS57175345A (en) * | 1981-04-22 | 1982-10-28 | Sumitomo Electric Industries | Sensor for live body organ spectrum analyser |
| JPS57199943A (en) * | 1981-06-03 | 1982-12-08 | Hitachi Ltd | Measuring device for wetness of steam |
| DE3134124A1 (en) * | 1981-08-28 | 1983-03-10 | Erwin Braun Institut, 6390 Engelberg | Method and device for monitoring the oxygen saturation of the blood in vivo |
| DE3581325D1 (en) * | 1984-06-30 | 1991-02-21 | Toshiba Kawasaki Kk | APPARATUS FOR MEASURING THE DIMENSIONS OF PARTICLES. |
| US4718417A (en) * | 1985-03-22 | 1988-01-12 | Massachusetts Institute Of Technology | Visible fluorescence spectral diagnostic for laser angiosurgery |
| DE3512602A1 (en) * | 1985-04-06 | 1986-10-09 | Richard Wolf Gmbh, 7134 Knittlingen | ENDOSCOPE FOR DETERMINING OBJECT SIZES IN CAVITIES |
| DE3629447A1 (en) * | 1985-08-30 | 1987-04-09 | Criticare Systems Inc | Method and device for oxymetry |
| DE3700577A1 (en) * | 1987-01-10 | 1988-07-21 | Helge Eichholz | Method and examination device for examining human or animal tissue or human or animal body fluid to determine whether it contains a specific substance |
-
1988
- 1988-07-26 DE DE3825352A patent/DE3825352A1/en active Granted
-
1989
- 1989-07-26 EP EP89113803A patent/EP0353619B1/en not_active Expired - Lifetime
- 1989-07-26 AT AT89113803T patent/ATE210406T1/en not_active IP Right Cessation
- 1989-07-26 DE DE58909882T patent/DE58909882D1/en not_active Expired - Fee Related
- 1989-07-26 JP JP1191593A patent/JPH067828B2/en not_active Expired - Lifetime
-
1993
- 1993-05-10 JP JP5108184A patent/JP2886031B2/en not_active Expired - Lifetime
-
1994
- 1994-09-01 US US08/299,816 patent/US5645061A/en not_active Expired - Fee Related
Patent Citations (2)
| Publication number | Priority date | Publication date | Assignee | Title |
|---|---|---|---|---|
| DE3008651A1 (en) * | 1979-03-07 | 1980-10-16 | Hiroshi Abe | METHOD OF MEASUREMENT OF PNEUSIS FUNCTION |
| EP0046601A2 (en) * | 1980-08-26 | 1982-03-03 | Hellige GmbH | Method and device for the colorimetric determination of the concentration of a chemical substance, especially the partial pressure of a blood-dissolved gas |
Non-Patent Citations (1)
| Title |
|---|
| PHYSICS IN MEDICINE & BIOLOGY Band 33, Nr. 6, Juni 1988, Seiten 711-722, Bristol, GB; J.W. FEATHER et al. "A portable reflectometer for the rapid quantification of cutaneous haemoglobin and melanin" * |
Cited By (12)
| Publication number | Priority date | Publication date | Assignee | Title |
|---|---|---|---|---|
| EP0442011A1 (en) * | 1990-02-15 | 1991-08-21 | Hewlett-Packard GmbH | Sensor, apparatus and method for non-invasive measurement of oxygen saturation |
| US5188108A (en) * | 1990-02-15 | 1993-02-23 | Hewlett-Packard Company | Sensor, apparatus and method for non-invasive measurement of oxygen saturation |
| US5285783A (en) * | 1990-02-15 | 1994-02-15 | Hewlett-Packard Company | Sensor, apparatus and method for non-invasive measurement of oxygen saturation |
| EP0613652A2 (en) * | 1990-02-15 | 1994-09-07 | Hewlett-Packard GmbH | Apparatus and method for non-invasive measurement of oxygen saturation |
| EP0613653A2 (en) * | 1990-02-15 | 1994-09-07 | Hewlett-Packard GmbH | Method for non-invasive measurement of oxygen saturation |
| EP0613653A3 (en) * | 1990-02-15 | 1994-11-23 | Hewlett Packard Gmbh | Method for non-invasive measurement of oxygen saturation. |
| EP0613652A3 (en) * | 1990-02-15 | 1994-12-07 | Hewlett Packard Gmbh | Apparatus and method for non-invasive measurement of oxygen saturation. |
| DE4393335D2 (en) * | 1992-11-09 | 1994-07-21 | Boehringer Mannheim Gmbh | Method and device for analyzing glucose in a biological matrix |
| US5551422A (en) * | 1992-11-09 | 1996-09-03 | Boehringer Mannheim Gmbh | Method and apparatus for analytical determination of glucose in a biological matrix |
| US5676143A (en) * | 1992-11-09 | 1997-10-14 | Boehringer Mannheim Gmbh | Apparatus for analytical determination of glucose in a biological matrix |
| DE4337570A1 (en) * | 1993-11-04 | 1995-05-11 | Boehringer Mannheim Gmbh | Method for the analysis of glucose in a biological matrix |
| US5692504A (en) * | 1993-11-04 | 1997-12-02 | Boehringer Mannheim Gmbh | Method and apparatus for the analysis of glucose in a biological matrix |
Also Published As
| Publication number | Publication date |
|---|---|
| EP0353619B1 (en) | 2001-12-12 |
| US5645061A (en) | 1997-07-08 |
| JPH067828B2 (en) | 1994-02-02 |
| JPH0698892A (en) | 1994-04-12 |
| DE3825352A1 (en) | 1990-02-01 |
| JPH02257930A (en) | 1990-10-18 |
| DE58909882D1 (en) | 2002-01-24 |
| ATE210406T1 (en) | 2001-12-15 |
| DE3825352C2 (en) | 1990-09-27 |
| JP2886031B2 (en) | 1999-04-26 |
Similar Documents
| Publication | Publication Date | Title |
|---|---|---|
| DE4239016C2 (en) | Method for determining the concentration of free ions within a cell using a fluorescent indicator dye | |
| DE3031249C2 (en) | Device for detecting caries and using this device | |
| DE10133451B4 (en) | Device for detecting caries, plaque, concrements or bacterial infestation of teeth | |
| DE2902776C2 (en) | ||
| DE2613617C2 (en) | Methods for analyzing samples, e.g. urine | |
| EP0353619B1 (en) | Process for determination of local dye-concentrations in animal and human tissue | |
| DE2049716C3 (en) | Method and device for measuring absorption in blood | |
| DE60037437T2 (en) | OPTIMIZING A LIGHTING PROBE FOR SPECTROSCOPIC MEASUREMENTS | |
| DE2134910C2 (en) | Blood analysis method | |
| EP3051272B1 (en) | Method and automatic analyzer for assaying lipids and other interferents in body fluid samples | |
| EP1635164B1 (en) | Method for calibration of a photoluminescence measuring system | |
| AT403412B (en) | DEVICE AND METHOD FOR DETERMINING THE CONCENTRATION OF HEMOGLOBIN DERIVATIVES IN AN UNDILINED, UNHEMOLYZED WHOLE BLOOD SAMPLE | |
| DE2944113C2 (en) | ||
| EP0818682A2 (en) | Method and device for the optical measurement of the total hemoglobin concentration | |
| DE4128458A1 (en) | METHOD AND DEVICE FOR QUANTITATIVELY DETERMINING OPTICALLY ACTIVE SUBSTANCES | |
| EP0215772A2 (en) | Method and device for diagnosing tumours using sera | |
| EP0774658A2 (en) | Method and apparatus for obtaining analytical data on the interior of a scattering medium | |
| DE2340252A1 (en) | METHOD AND EQUIPMENT FOR COUNTING BIOLOGICAL PARTICLES | |
| DE3542167C2 (en) | ||
| DE10222359B4 (en) | Method for the spectrally differentiating, imaging measurement of fluorescent light | |
| DE4325529C2 (en) | Device for determining the concentration of substances in the blood | |
| DE3844651A1 (en) | Device for determining variations in size of tissue particles | |
| DE3734588C2 (en) | ||
| WO1995013739A1 (en) | Method and device for the non-invasive transcutanean determination of the concentrations of substances in human body fluids or tissues | |
| DE1598420B2 (en) | METHOD AND DEVICE FOR DETERMINING THE AMOUNT OF FREE UNDISOLATED WATER IN A LIQUID |
Legal Events
| Date | Code | Title | Description |
|---|---|---|---|
| PUAI | Public reference made under article 153(3) epc to a published international application that has entered the european phase |
Free format text: ORIGINAL CODE: 0009012 |
|
| AK | Designated contracting states |
Kind code of ref document: A1 Designated state(s): AT BE CH DE ES FR GB IT LI NL SE |
|
| 17P | Request for examination filed |
Effective date: 19900727 |
|
| 17Q | First examination report despatched |
Effective date: 19930202 |
|
| APAB | Appeal dossier modified |
Free format text: ORIGINAL CODE: EPIDOS NOAPE |
|
| APAA | Appeal reference recorded |
Free format text: ORIGINAL CODE: EPIDOS REFN |
|
| APAD | Appeal reference recorded |
Free format text: ORIGINAL CODE: EPIDOS REFNE |
|
| APAB | Appeal dossier modified |
Free format text: ORIGINAL CODE: EPIDOS NOAPE |
|
| GRAG | Despatch of communication of intention to grant |
Free format text: ORIGINAL CODE: EPIDOS AGRA |
|
| RTI1 | Title (correction) |
Free format text: PROCESS FOR DETERMINATION OF LOCAL DYE-CONCENTRATIONS IN ANIMAL AND HUMAN TISSUE |
|
| GRAG | Despatch of communication of intention to grant |
Free format text: ORIGINAL CODE: EPIDOS AGRA |
|
| GRAH | Despatch of communication of intention to grant a patent |
Free format text: ORIGINAL CODE: EPIDOS IGRA |
|
| GRAH | Despatch of communication of intention to grant a patent |
Free format text: ORIGINAL CODE: EPIDOS IGRA |
|
| GRAA | (expected) grant |
Free format text: ORIGINAL CODE: 0009210 |
|
| AK | Designated contracting states |
Kind code of ref document: B1 Designated state(s): AT BE CH DE ES FR GB IT LI NL SE |
|
| PG25 | Lapsed in a contracting state [announced via postgrant information from national office to epo] |
Ref country code: IT Free format text: LAPSE BECAUSE OF FAILURE TO SUBMIT A TRANSLATION OF THE DESCRIPTION OR TO PAY THE FEE WITHIN THE PRESCRIBED TIME-LIMIT;WARNING: LAPSES OF ITALIAN PATENTS WITH EFFECTIVE DATE BEFORE 2007 MAY HAVE OCCURRED AT ANY TIME BEFORE 2007. THE CORRECT EFFECTIVE DATE MAY BE DIFFERENT FROM THE ONE RECORDED. Effective date: 20011212 Ref country code: NL Free format text: LAPSE BECAUSE OF FAILURE TO SUBMIT A TRANSLATION OF THE DESCRIPTION OR TO PAY THE FEE WITHIN THE PRESCRIBED TIME-LIMIT Effective date: 20011212 |
|
| REF | Corresponds to: |
Ref document number: 210406 Country of ref document: AT Date of ref document: 20011215 Kind code of ref document: T |
|
| RIN1 | Information on inventor provided before grant (corrected) |
Inventor name: KESSLER, MANFRED, PROF. DR. MED. Inventor name: FRANK, KLAUS, DR. |
|
| REG | Reference to a national code |
Ref country code: CH Ref legal event code: EP |
|
| REG | Reference to a national code |
Ref country code: GB Ref legal event code: IF02 |
|
| REF | Corresponds to: |
Ref document number: 58909882 Country of ref document: DE Date of ref document: 20020124 |
|
| PG25 | Lapsed in a contracting state [announced via postgrant information from national office to epo] |
Ref country code: SE Free format text: LAPSE BECAUSE OF FAILURE TO SUBMIT A TRANSLATION OF THE DESCRIPTION OR TO PAY THE FEE WITHIN THE PRESCRIBED TIME-LIMIT Effective date: 20020312 |
|
| GBT | Gb: translation of ep patent filed (gb section 77(6)(a)/1977) |
Effective date: 20020308 |
|
| ET | Fr: translation filed | ||
| NLV1 | Nl: lapsed or annulled due to failure to fulfill the requirements of art. 29p and 29m of the patents act | ||
| PG25 | Lapsed in a contracting state [announced via postgrant information from national office to epo] |
Ref country code: ES Free format text: LAPSE BECAUSE OF FAILURE TO SUBMIT A TRANSLATION OF THE DESCRIPTION OR TO PAY THE FEE WITHIN THE PRESCRIBED TIME-LIMIT Effective date: 20020627 |
|
| PG25 | Lapsed in a contracting state [announced via postgrant information from national office to epo] |
Ref country code: AT Free format text: LAPSE BECAUSE OF NON-PAYMENT OF DUE FEES Effective date: 20020726 |
|
| PGFP | Annual fee paid to national office [announced via postgrant information from national office to epo] |
Ref country code: GB Payment date: 20020726 Year of fee payment: 14 |
|
| PGFP | Annual fee paid to national office [announced via postgrant information from national office to epo] |
Ref country code: DE Payment date: 20020730 Year of fee payment: 14 |
|
| PG25 | Lapsed in a contracting state [announced via postgrant information from national office to epo] |
Ref country code: LI Free format text: LAPSE BECAUSE OF NON-PAYMENT OF DUE FEES Effective date: 20020731 Ref country code: BE Free format text: LAPSE BECAUSE OF NON-PAYMENT OF DUE FEES Effective date: 20020731 Ref country code: CH Free format text: LAPSE BECAUSE OF NON-PAYMENT OF DUE FEES Effective date: 20020731 |
|
| PGFP | Annual fee paid to national office [announced via postgrant information from national office to epo] |
Ref country code: FR Payment date: 20020819 Year of fee payment: 14 |
|
| PLBE | No opposition filed within time limit |
Free format text: ORIGINAL CODE: 0009261 |
|
| STAA | Information on the status of an ep patent application or granted ep patent |
Free format text: STATUS: NO OPPOSITION FILED WITHIN TIME LIMIT |
|
| 26N | No opposition filed | ||
| BERE | Be: lapsed |
Owner name: *KESSLER MANFRED Effective date: 20020731 |
|
| REG | Reference to a national code |
Ref country code: CH Ref legal event code: PL |
|
| NLV1 | Nl: lapsed or annulled due to failure to fulfill the requirements of art. 29p and 29m of the patents act | ||
| PG25 | Lapsed in a contracting state [announced via postgrant information from national office to epo] |
Ref country code: GB Free format text: LAPSE BECAUSE OF NON-PAYMENT OF DUE FEES Effective date: 20030726 |
|
| PG25 | Lapsed in a contracting state [announced via postgrant information from national office to epo] |
Ref country code: DE Free format text: LAPSE BECAUSE OF NON-PAYMENT OF DUE FEES Effective date: 20040203 |
|
| GBPC | Gb: european patent ceased through non-payment of renewal fee |
Effective date: 20030726 |
|
| PG25 | Lapsed in a contracting state [announced via postgrant information from national office to epo] |
Ref country code: FR Free format text: LAPSE BECAUSE OF NON-PAYMENT OF DUE FEES Effective date: 20040331 |
|
| REG | Reference to a national code |
Ref country code: FR Ref legal event code: ST |
|
| APAH | Appeal reference modified |
Free format text: ORIGINAL CODE: EPIDOSCREFNO |