EP0337423B1 - Process control method and control system - Google Patents
Process control method and control system Download PDFInfo
- Publication number
- EP0337423B1 EP0337423B1 EP89106504A EP89106504A EP0337423B1 EP 0337423 B1 EP0337423 B1 EP 0337423B1 EP 89106504 A EP89106504 A EP 89106504A EP 89106504 A EP89106504 A EP 89106504A EP 0337423 B1 EP0337423 B1 EP 0337423B1
- Authority
- EP
- European Patent Office
- Prior art keywords
- qualitative
- amount
- change
- control
- evaluation
- Prior art date
- Legal status (The legal status is an assumption and is not a legal conclusion. Google has not performed a legal analysis and makes no representation as to the accuracy of the status listed.)
- Expired - Lifetime
Links
Images


Classifications
-
- G—PHYSICS
- G06—COMPUTING; CALCULATING OR COUNTING
- G06N—COMPUTING ARRANGEMENTS BASED ON SPECIFIC COMPUTATIONAL MODELS
- G06N7/00—Computing arrangements based on specific mathematical models
- G06N7/02—Computing arrangements based on specific mathematical models using fuzzy logic
- G06N7/04—Physical realisation
-
- G—PHYSICS
- G05—CONTROLLING; REGULATING
- G05B—CONTROL OR REGULATING SYSTEMS IN GENERAL; FUNCTIONAL ELEMENTS OF SUCH SYSTEMS; MONITORING OR TESTING ARRANGEMENTS FOR SUCH SYSTEMS OR ELEMENTS
- G05B13/00—Adaptive control systems, i.e. systems automatically adjusting themselves to have a performance which is optimum according to some preassigned criterion
- G05B13/02—Adaptive control systems, i.e. systems automatically adjusting themselves to have a performance which is optimum according to some preassigned criterion electric
- G05B13/0265—Adaptive control systems, i.e. systems automatically adjusting themselves to have a performance which is optimum according to some preassigned criterion electric the criterion being a learning criterion
- G05B13/0275—Adaptive control systems, i.e. systems automatically adjusting themselves to have a performance which is optimum according to some preassigned criterion electric the criterion being a learning criterion using fuzzy logic only
-
- Y—GENERAL TAGGING OF NEW TECHNOLOGICAL DEVELOPMENTS; GENERAL TAGGING OF CROSS-SECTIONAL TECHNOLOGIES SPANNING OVER SEVERAL SECTIONS OF THE IPC; TECHNICAL SUBJECTS COVERED BY FORMER USPC CROSS-REFERENCE ART COLLECTIONS [XRACs] AND DIGESTS
- Y10—TECHNICAL SUBJECTS COVERED BY FORMER USPC
- Y10S—TECHNICAL SUBJECTS COVERED BY FORMER USPC CROSS-REFERENCE ART COLLECTIONS [XRACs] AND DIGESTS
- Y10S706/00—Data processing: artificial intelligence
- Y10S706/90—Fuzzy logic
-
- Y—GENERAL TAGGING OF NEW TECHNOLOGICAL DEVELOPMENTS; GENERAL TAGGING OF CROSS-SECTIONAL TECHNOLOGIES SPANNING OVER SEVERAL SECTIONS OF THE IPC; TECHNICAL SUBJECTS COVERED BY FORMER USPC CROSS-REFERENCE ART COLLECTIONS [XRACs] AND DIGESTS
- Y10—TECHNICAL SUBJECTS COVERED BY FORMER USPC
- Y10S—TECHNICAL SUBJECTS COVERED BY FORMER USPC CROSS-REFERENCE ART COLLECTIONS [XRACs] AND DIGESTS
- Y10S706/00—Data processing: artificial intelligence
- Y10S706/902—Application using ai with detail of the ai system
- Y10S706/903—Control
- Y10S706/906—Process plant
Definitions
- This invention relates to a process control method according to the preamble of claim 1 using the fuzzy therory.
- the transition of the amount of a process to be controlled after lapse of unit time is predicted by the observation of the past trend of time-sequential change of different amount of process and by the method of least squares and used to determine the amount of control for the amount of process.
- another conventional process control is proposed which employs the fuzzy theory for inferring the situations of process and determining the amount of control by evaluating the measured values from different process-amount sensors on the basis of operator's transcendental information.
- the former conventional process control only makes the next prediction in a time-sequential manner, and the latter conventional process control determines the amount of control by the evaluation based on the transcendental information relative to absolute amount. Therefore, these conventional process control methods have the drawback that the control cannot follow an abrupt change of local primary factors associated with the process action.
- the process to solve a qualitative equation is the qualitative inference and comprises an operation called propagation for assigning a qualitative value to the qualitative variable at a time point and an operation called a prediction for determining the next condition.
- the qualitative values of the qualitative variable take three or more intervals relative to some constants called landmark.
- the qualitative variable is expressed by [X] Q , and takes the following values.
- JP-A-63-62001 discloses a fuzzy-inference-based control method according to the preamble of claim 1 wherein a plurality of process information variables are input, the input variables are qualitatively evaluated using membership functions, and the results of the quantitative evaluation are then subjected to first and second fuzzy inference operations without an intermediate conversion of the results of the first inference operation into a quantitative value. Finally, the results of the first and second stages of fuzzy inference operations are converted into a quantitative value for controlling the process.
- a process control and control system which handle the actions of process or local actions of process as qualitative models and apply qualitative fuzzy theory to these models.
- different quantative or qualitative process information including intermediate inferred values
- qualitative evaluation of the amount of time displacement resulting from differentiating this process information with respect to time is previously evaluated qualitatively on the basis of fuzzy amount to produce appropriate values of membership function
- a set of qualitative evaluation appropriate values of future (unit time later) control target process information is experientially inferred on the basis of the qualitative evaluation of the appropriate values
- the amount of the process control is determined by centroid computation of the membership function and the set of qualitative evaluation appropriate values of the control target information.
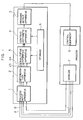
- Fig. 1 is a block diagram of one embodiment of a control system of this invention.
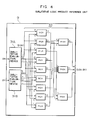
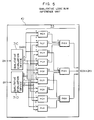
- Figs. 2 to 5 are detailed diagrams of elements of Figs. 1, wherein Fig. 2 shows the differentiation apparatus, Fig. 3 shows the qualitative inference apparatus, Fig. 4 shows the qualitative logic product inference apparatus and Fig. 5 shows the qualitative logical sum inference apparatus.
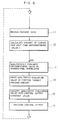
- Fig. 6 is a flow chart showing the order of all operations according to this invention.
- Fig. 7 is a graph showing the change of amount of process with respect to time.
- Fig. 8 shows the membership function evaluated by the fuzzy amount for the qualitative evaluation of the amount of process or the amount of change of process with respect to time.
- Fig. 9 shows a table of definitions of qualitative logic product inference rule.
- Fig. 10 shows a table of definitions of qualitative logic sum inference rule.
- Fig. 11 is a graph showing the control operation amount conversion characteristics of centroid arithmetic apparatus.
- Fig. 12 is graphs showing the effects of this invention.
- Fig. 13 is a block diagram of another embodiment of this invention.
- Fig. 14 is a detailed diagram of the identification apparatus in Fig. 13.
- Fig. 15 is a flow chart for the operation of Fig. 3.
- Figs. 16 to 19 are diagrams useful for explaining still another embodiment of this invention.
- Fig. 16 shows the differentiation apparatus for tunnel ventilation process amount
- Fig. 17 shows the qualitative inference apparatus for pollution within tunnel
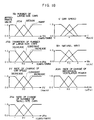
- Fig. 18 shows the membership function relative to qualitative variable of process
- Fig. 19 shows graphs illustrating characteristics for explaining the effects of this embodiment.
- Figs. 20 and 21 are inference rule matrix diagrams useful for the idea of qualitative inference.
- FIG. 1 One embodiment of this invention is shown in Fig. 1.
- a control equipment 8 for controlling processes and a great number of different sensors 7 for measuring the amounts of different processes The control equipment 8 and the sensors 7 are provided to control related processes.
- the sensors 7 produce many different measured values, but for convenience of explanation, two different measured values A and B are handled here.
- the different measured values A and B of process amount are supplied to a process input apparatus 1 and then to a differentiation apparatus 2.
- the differentiation apparatus 2 has a memory for storing the amounts of process, and calculates the amount of change of A, B per unit time (t i - t i-1 ) on this memory.
- the amounts of change with respect to time are represented by ⁇ A, ⁇ B, respectively.
- Shown at 3 is a qualitative inference apparatus 3 receives the differentiated values ⁇ A and ⁇ B (amounts of change with respect to time) of the measured values A and B, evaluates their appropriate values on the basis of the membership function resulting from previously evaluating the amount of change ⁇ A and ⁇ B stored in a memory 6 on the fuzzy amount, and infers the appropriate values of control target process amount after unit time t i+1 from those appropriate values.
- Shown at 4 is a centroid arithmetic apparatus for determining the amount of control on the basis of the inferred appropriate values and transcendental control amount evaluation information which is stored in the memory 6 and supplied to the control equipment 8. The determined control amount is supplied from a process output unit 5 to the control equipment 8. Such a control operation is performed at every unit times to control processes.
- Fig. 2 shows the construction of one example of the differentiation apparatus 2.
- reference character X i indicates the amount of process (A or B) measured by the sensor 7 at time i.
- the differential apparatus 2 receives the measured value X i and produces the first-order differentiated value ⁇ X i , second-order differentiated value ⁇ 2X i , ... n th -order differentiated value ⁇ n X i , where ⁇ n X represents the amount of change of ⁇ n-1 X with respect to time.
- the differentiation apparatus 2 has n differentiation units 21, 22, ... 2n connected in cascade with memories 201, 202, ... 20n in order to produce nth-order differentiated value.
- the storage makes shift register operation and stores the value ⁇ n X i-1 calculated at time i-1 and the value ⁇ n X i calculated at time i in each differentiation unit.
- Fig. 3 shows the construction of the qualitative inference apparatus 3.
- the qualitative inference apparatus 3 comprises a qualitative logic product inference unit 9 for the process simulating qualitative differentiation equations of which the qualitative variables have a product relation and a qualitative logic sum inference unit 10 for the qualitative variables having a sum relation.
- Fig. 3 shows the case where the control target process amount is inferred by the differentiated value ⁇ A, ⁇ B, ⁇ C of different process amounts A, B, C measured by the sensors 7.
- the qualitative logic product inference unit is constructed as shown in Fig. 4.
- the amounts of change ⁇ X, ⁇ Y are the differentiated values of process amounts X, Y measured by the sensors 7.
- the qualitative logic product inference unit 9 comprises appropriate value qualitative evaluation devices 31A, 31B which receive the amounts of change ⁇ X, ⁇ Y and evaluate the degrees of the changes qualitatively, and a qualitative product inference device 32 employing the min-max method of fuzzy theory, and produces a qualitative product evaluation set S ( ⁇ X ⁇ ⁇ Y) of the amounts of change ⁇ X, ⁇ Y.
- the qualitative logic sum inference unit 10 is constructed as shown in Fig. 5.
- the qualitative logic sum inference unit 10 comprises appropriate value qualitative evaluation devices 31C, 31D and a qualitative sum inference device 33, and produces a qualitative sum evaluation set S( ⁇ X + ⁇ Y) of the amounts of change ⁇ X, ⁇ Y.
- the amounts of different processes necessary for the control are supplied to the process input apparatus 1 and processed:
- the differentiation apparatus 2 calculates the amounts of change of processes per unit time which were stored at step 11.
- Fig. 7 graphically shows the processing in the differentiation apparatus 2.
- Fig. 7a shows the change of the process amount X with respect to time, in which the ordinate indicates the absolute amount of the process amount X, and abscissa is time.
- Fig. 7a shows, for example, that the process amount X is changed from 5 to 25 relative to time t i-5 through time t i .
- the present time is represented by t i and thus unit time before the present time is t i-1 .
- the process amount X at time t i is denoted by X i and the amount of change is ⁇ X i
- Fig. 7b shows the transition of the amount of change ⁇ X relative to time. In this figure, ⁇ X i is negative, and the process amount X is reduced by absolute amount of 10 at time t i .
- steps 13 and 14 follows in turn, where the qualitative inference apparatus 3 performs inference.
- the appropriate value qualitative evaluation devices 31A to 31D make evaluation processing as shown in Figs. 4 and 5.
- Fig. 8 shows the three stage evaluation of decrease (-), no change (0) and increase (+) of process amount X relative to the differentiated value (amount of change) ⁇ X.
- the evaluation stages may be two different stages of, for example, decrease and increase or five different stages of decrease, slight decrease, no change, slight increase, and increase. The number of stages is arbitrary depending on the density of empirical information.
- the ordinate is the appropriate value defined as 0.0 to 1.0 for qualitative evaluation degree and the abscissa is the amount of change X.
- the range of the amount of change ⁇ X is from -20 to 20, and when the amount of change ⁇ X is -20, the appropriate value of decrease is 1.0. This qualitatively implies that if the process amount X is decreased by 20, the process amount X is decreased definitely. However, when the amount of change ⁇ X is 5, the process amount is not always decreased, and thus the appropriate value of decrease is set to 0.0. When the amount of change ⁇ X is in the range from -20 to 5, the appropriate value is set to a value between 0.0 and 1.0 because such decision as above cannot be made. Since the amount of change ⁇ X i shown in Fig. 7 is -10, the appropriate value is 0.8 from the intersection in the decrease evaluation graph.
- the evaluation graph of no change is in a form of mountain in which the appropriate value is 1.0 when the amount of change ⁇ X is around 0 and it is 0.0 when the amount of change is ⁇ 17. When the amount of change ⁇ X is -10, the appropriate value of no change is 0.2.
- the evaluation graph of increase is such a form that the appropriate value is 1.0 for 20 of amount of change ⁇ X and 0.0 for -7 of amount of change ⁇ X. When the amount of change ⁇ X i is -10, the appropriate value of increase is 0.0. This is not said to increase from qualitative viewpoint.
- the qualitative evaluation is expressed by the set, S defined by the following equation.
- ⁇ +( ⁇ X) indicates the appropriate value of increase
- ⁇ 0( ⁇ X) is the appropriate value of no change
- ⁇ -( ⁇ X) is the appropriate value of decrease.
- the differentiated value ⁇ X is inputted and the qualitative evaluation set is produced at the output.
- the inference processing is carried out by the qualitative product inference device 32 and the qualitative sum inference device 33.
- the qualitative evaluation appropriate value set of the control target process amount after unit time t i+1 is inferred on the basis of the qualitative evaluation set relative to the differentiated value (amount of change) ⁇ X of different process amounts produced at step 13 by the rule based on the empirical information.
- Fig. 9 shows the rule in the qualitative product inference.
- the differentiated values (amount of change) ⁇ X, ⁇ Y of two different process amounts X, Y are inputted, the process amounts inferred from the product thereof, or the appropriate values of amounts of change ⁇ X, ⁇ Y can be found by the following way.
- the decrease is indicated by -, the no change by 0 and the increase by +.
- Fig. 9 shows the following 9 different rules made on the basis of the experience rules.
- the rule 9 for example, can be explained by, such a qualitative way as "if the process amounts X and Y are both increasing, the process amount of product X ⁇ Y increases".
- the qualitative product inference device 32 carries out the above rule as follows.
- the process amount X tends to decrease, and the process amount Y is most probably not changed.
- the qualitative product inference device 32 when supplied with these values, carries out all the 9 different rules.
- the increase appropriate value ⁇ +( ⁇ X ⁇ Y) of the amount of change ⁇ X ⁇ Y is the smaller one of the increase appropriate value of the amount of change ⁇ X and the increase appropriate value of the amount of change ⁇ Y.
- similarly the increase appropriate value of the amount of change ⁇ X ⁇ Y is inferred.
- the amount of change ⁇ X ⁇ Y is decided to be "considserable increase" by the experiential observation of the process action from the two different viewpoints.
- the rule 9 is useful to infer that when two different measured values X, Y both increase, the amount of change ⁇ X ⁇ Y increases, while the rule 1 can infer that when two different measured values X, Y both decrease, the amount of change ⁇ X ⁇ Y increases. In this way, the qualitative evaluation set S( ⁇ X ⁇ Y) of the amount of change ⁇ X ⁇ Y is produced from the qualitative logic product inference apparatus 9.
- Fig. 10 shows the inference rules which the qualitative sum inference device 32 carries out.
- This qualitative sum inference apparatus 33 is different from the qualitative product inference device 32 in rules.
- the operations performed in accordance with the rules are the same.
- the reason why the qualitative logic product inference apparatus 9 and the qualitative logic sum inference apparatus 10 are separately provided is that the qualitative differential equation which simulates the transition of the process state is determined by the qualitative logic sum and qualitative logic product of the differentiated values of different process amounts. Thus, either apparatus may be used depending on the process.
- the amount of change ⁇ a of the control target process amount a after unit time is determined by the differentiated values of different process amounts A, B, C and expressed by the following qualitative differential equation.
- ⁇ a ⁇ A ⁇ B + ⁇ C
- dot " ⁇ " indicate the qualitative product and "+” indicates the qualitative sum.
- the equation (3) can be explained qualitatively as "the rate ⁇ a of change of the process amount a after unit time is determined by the sum of the product of the rate of change ⁇ A of the process amount A and the rate of change ⁇ B of the process amount B, and the rate ⁇ C of change of the process amount C".
- the "rate of change” is indicated by the qualitative evaluation appropriate value or the set.
- the qualitative inference apparatus 3 comprises the qualitative logic product inference apparatus 9 which receives ⁇ A and ⁇ B and produces the qualitative product evaluation set S( ⁇ A ⁇ B) of ⁇ A ⁇ B and the qualitative logic sum inference apparatus 10 which receives S( ⁇ A ⁇ B) and ⁇ C.
- the qualitative inference apparatus produces the qualitative evaluation set of the rate of change of the control target process amount a after unit time, or S( ⁇ A ⁇ B + ⁇ C).
- the amount of control is determined by the centroid arithmetic apparatus 4.
- the centroid arithmetic apparatus 4 receives the qualitative evaluation set inferred by the qualitative inference apparatus 3, and determines the amount of control on the basis of the transcendental information thereto.
- Fig. 11 shows the evaluation graph (membership function) of the amounts of control produced on the basis of experiential knowledge.
- the amount of increase and decrease from the present amount of control, or the amount of control is evaluated qualitatively.
- the ordinate indicates the appropriate values in the range from 0.0 to 1.0 and the abscissa is the amount of control.
- the amount of control is evaluated in three stages of decrease, no change and increase.
- the evaluation of "decrease” is the monotonous decrease type in which the appropriate value is 1.0 for amount of control of -40 and 0.0 for amount of control of 0
- the evaluation of "no change” is the mountain type in which the appropriate value is 1.0 for the amount of control of 0 and 0.0 for the amount of control of -30 and +30
- the evaluation of "increase” is the monotonous increase type in which the appropriate value is 1.0 for the amount of control of 40 and 0.0 for the amount of control of 0.
- the centroid arithmetic apparatus 4 refers to the control amount evaluation graph, shown in Fig. 11, stored in the storage 6 and determines the amount of control as follows.
- each value of this set is employed as the evaluation to the respective amount of control, and as shown in Fig. 11, the area surrounded by each evaluation graph curve, appropriate values 0.0, 1.0, and control amounts -45, +45 is cut by each appropriate evaluation straight line.
- the shaded effective evaluation area can be obtained as illustrated.
- This shaded area indicates the degree of effectiveness in each evaluation stage.
- the centroid arithmetic apparatus 4 calculates the centroid G having the same mass as that of the shaded area, and the coordinate of the centroid G relative to the control amount axis. In this example, it is -16.
- This value is the amount of control operation.
- the above processing can be explained qualitatively as "since the control target process amount a is most probably decreased after unit time, the amount of control should be decreased by 16 from the present value". In this way, at step 15 the amount of control operation is determined by the qualitative evaluation value of the control target process amount after unit time.
- step 16 the amount of control operation determined as above is supplied to the process.
- a sequence of the processings is repeated at every unit time which is determined by the time constant of the process to be controlled, so as to control the process.
- Fig. 12 shows characteristic curves useful for explaining the effect of this invention.
- Fig. 12a shows the transition of the control target process amount a relative to time.
- the amount of change ⁇ a of the process amount a unit time t i+1 after the present time t i is determined by the amounts of change of different process amounts A, B at time t i as described above.
- Fig. 12b shows the transition of the process amount A relative to time.
- Fig. 12c shows the transition of the amount of change per unit time ⁇ A of the process amount A relative to time
- Fig. 12d shows the transition of the process amount B relative to time
- Fig. 12e shows the transition of the amount of change per unit ⁇ B time of the process amount B relative to time.
- the process amounts A, B are both predicted to increase from the observation of the past time-sequential data as indicated by the crosses small circles with cross x in Fig. 12.
- the control target process amount a is also predicted to increase after unit time t i+1 as indicated by the small circles with cross x .
- the process amount B is suddenly decreased and the actual control target process amount a is indicated by double small circles o .
- the prediction as indicated by the double small circles can be achieved.
- the amount of control operation can be correctly determined. As a result, the control can follow the local sudden change.
- the number of processes is of course not limited to two.
- Fig. 13 shows another embodiment of this invention.
- the embodiment in Fig. 13 is different from that in Fig. 1 in that the feedback identification apparatus 20 is provided.
- the contents to be processed in the centroid arithmetic apparatus 4 are also somewhat changed.
- the feature of the embodiment of Fig. 13 is that the amount of control is fed back to repeat a sequence of processings until the control target process amount a inferred is within the control target allowable range.
- the same processing as in the embodiment shown in Fig. 1 is performed to calculate the amount-of-change qualitative evaluation set of the control target process amount.
- the centroid arithmetic apparatus 4 determines the amount of control operation and the amount of change of the control target process from the empirical information.
- Fig. 14 shows the construction of the feedback identification apparatus 20.
- the feedback identification apparatus 20 receives the amount of displacement ⁇ a i of the control target information a predicted at time i and absolute amount a i at time i from the centroid arithmetic apparatus 4.
- a comparator 301 adds a i and ⁇ a i to calculate a predicted absolute value and compares it with the control target value b. If the difference is smaller than the allowable error C, or much satisfactory, the comparator actuates the process output apparatus 5, and produces the absolute value as a control amount to the control equipment.
- a control amount arithmetic unit 303 is actuated.
- the unit 303 calculates the amount of control relative to the difference and replaces the amount of operation of the control equipment supplied from the process by this value, thereby actuating the differentiation apparatus 2 recurrently.
- Fig. 15 shows a flow chart of the above operations.
- Figs. 16 and 17 show still another embodiment for the application to the pollution predicting system within a road tunnel.
- ⁇ C (([N b ] + ⁇ N b ) + [V]) + ⁇ (( ⁇ N s + ⁇ N b ) + ([V] + ⁇ V)) + [W n ] ⁇ + ⁇ U m
- the qualitative inference apparatus 3 receives the membership function to each qualitative variable, from the storage 6 and the above-given qualitative variables as shown in Fig. 18, and infers qualitatively in accordance with the equation (4). The inference is made in steps and finally the appropriate degree set S ( ⁇ C) of ⁇ C is produced. Although the elements of the equation (4) are absolutely different in unit from the physical standpoint, this system is able to make total prediction.
- Fig. 19 shows the control by the conventional quantitative type model and the control by the invention using fuzzy for the comparison therebetween.
- the control in both system is the predicted situations of the pollution value of the air within a tunnel.
- the abscissa is the measured pollution value VI, and the ordinate is the predicted value obtained by each control system. From Fig. 19 it will be seen that the conventional model has a wide distribution, while the system of this invention provides extremely excellent correlation and high-precision prediction.
Description
- This invention relates to a process control method according to the preamble of
claim 1 using the fuzzy therory. - In the conventional process control, the transition of the amount of a process to be controlled after lapse of unit time is predicted by the observation of the past trend of time-sequential change of different amount of process and by the method of least squares and used to determine the amount of control for the amount of process. Also, as is disclosed in, for example, Japanese Patent Laid-open Gazette No. 204707/1984 and No. 234405/1986, another conventional process control is proposed which employs the fuzzy theory for inferring the situations of process and determining the amount of control by evaluating the measured values from different process-amount sensors on the basis of operator's transcendental information.
- The former conventional process control only makes the next prediction in a time-sequential manner, and the latter conventional process control determines the amount of control by the evaluation based on the transcendental information relative to absolute amount. Therefore, these conventional process control methods have the drawback that the control cannot follow an abrupt change of local primary factors associated with the process action.
- On the other hand, the qualitative inference researched by J. de Kleen et al. has recently been given attention as one method of providing a model for human to understand the phenomena in the natural world (see "Qualitative Physics Based on Confluences" J. de Kleer and J. S. Brown, Artificial Intelligence 24, 1, pp. 7-83, 1984). In this qualitative inference, three values of +, 0, - called qualitative values, not quantative values are used. The variable is called as the qualitative variable designated by [X]. Also, the differentiation dx/dt to be used for expressing the action of a system is represented by ∂X and takes three values +, 0, - as does the variable [X]. Since a quantative equation is normally given, it must be converted into a qualitative equation.
- For example, the amount of flow, Q from the outlet of a tube having a cross-section A and an outflow coefficient C is expressed as

where P is the pressure and ρ is the volume density of liquid. If C and ρ are constants, the differentiation of this equation is given as
These two quantative equations are converted into the following qualitative equations.

When P or A makes absolute displacement relative to a constant (landmark, which will be described later) to achieve a qualitative value, this equation becomes a differential equation. In this example, however, since P and A can be considered to be constants having positive qualitative values, the expression of
can be obtained. - The process to solve a qualitative equation is the qualitative inference and comprises an operation called propagation for assigning a qualitative value to the qualitative variable at a time point and an operation called a prediction for determining the next condition. In most cases, the qualitative values of the qualitative variable take three or more intervals relative to some constants called landmark. When a set of intervals covering real number space (I₀, I₁, I₃ ... Im) is represented by Q, the qualitative variable is expressed by [X]Q, and takes the following values.

- When the landmark is only a,

When a = 0, the affix is omitted as
"+" can be considered as the name of the interval, X > 0. For realization of system, in most cases, states for each landmark are considered, or the form of [X-a] is reduced to and three values (+, 0, -) are used in calculation. - The method of calculation using qualitative values (+, 0, -) is shown in Figs. 20 and 21. The propagation is made by determining the valuable within the qualitative equation on the basis of the figures. The prediction is performed on the basis of

It is uncertain how many times ∂X of "+" is added to one having qualitative value "-" to reach "0" or "+". Thus, the individual problems must be considered for the determination. - This qualitative reasoning is still at the research stage, and no approaches are established in many aspects such as way to make equations, control of inference and execution of computation. Therefore, it is difficult for the qualitative inference to be applied to practical models.
- JP-A-63-62001 discloses a fuzzy-inference-based control method according to the preamble of
claim 1 wherein a plurality of process information variables are input, the input variables are qualitatively evaluated using membership functions, and the results of the quantitative evaluation are then subjected to first and second fuzzy inference operations without an intermediate conversion of the results of the first inference operation into a quantitative value. Finally, the results of the first and second stages of fuzzy inference operations are converted into a quantitative value for controlling the process. - Accordingly, it is an object of this invention to provide a process control method and control system which are able to control with high precision even under sudden changes in local factors of process.
- It is another object of this invention to provide an approach for inferential control of qualitative differential equations of which the actions of process are simulated.
- These objects are met by the invention according to
claim 1. - According to this invention, there is provided a process control and control system which handle the actions of process or local actions of process as qualitative models and apply qualitative fuzzy theory to these models. In this process control and control system, different quantative or qualitative process information (including intermediate inferred values) or qualitative evaluation of the amount of time displacement resulting from differentiating this process information with respect to time is previously evaluated qualitatively on the basis of fuzzy amount to produce appropriate values of membership function, a set of qualitative evaluation appropriate values of future (unit time later) control target process information is experientially inferred on the basis of the qualitative evaluation of the appropriate values, and the amount of the process control is determined by centroid computation of the membership function and the set of qualitative evaluation appropriate values of the control target information.
- Thus, since the appropriate values are evenly evaluated according to the empirical information such as the membership function and experimential rules even is different kinds of information and the amount of change with respect to time have different dimensions, the actions of the amount of process after unit time can be inferred. Consequently, it is possible to treat even the local and sudden changes of process, and thus to improve the accuracy of prediction to a great extend so that the amount of control can be determined to be an optimum value.
- Fig. 1 is a block diagram of one embodiment of a control system of this invention.
- Figs. 2 to 5 are detailed diagrams of elements of Figs. 1, wherein Fig. 2 shows the differentiation apparatus, Fig. 3 shows the qualitative inference apparatus, Fig. 4 shows the qualitative logic product inference apparatus and Fig. 5 shows the qualitative logical sum inference apparatus.
- Fig. 6 is a flow chart showing the order of all operations according to this invention.
- Fig. 7 is a graph showing the change of amount of process with respect to time.
- Fig. 8 shows the membership function evaluated by the fuzzy amount for the qualitative evaluation of the amount of process or the amount of change of process with respect to time.
- Fig. 9 shows a table of definitions of qualitative logic product inference rule.
- Fig. 10 shows a table of definitions of qualitative logic sum inference rule.
- Fig. 11 is a graph showing the control operation amount conversion characteristics of centroid arithmetic apparatus.
- Fig. 12 is graphs showing the effects of this invention.
- Fig. 13 is a block diagram of another embodiment of this invention.
- Fig. 14 is a detailed diagram of the identification apparatus in Fig. 13.
- Fig. 15 is a flow chart for the operation of Fig. 3.
- Figs. 16 to 19 are diagrams useful for explaining still another embodiment of this invention; Fig. 16 shows the differentiation apparatus for tunnel ventilation process amount, Fig. 17 shows the qualitative inference apparatus for pollution within tunnel, Fig. 18 shows the membership function relative to qualitative variable of process, and Fig. 19 shows graphs illustrating characteristics for explaining the effects of this embodiment.
- Figs. 20 and 21 are inference rule matrix diagrams useful for the idea of qualitative inference.
- One embodiment of this invention is shown in Fig. 1.
- Referring to Fig. 1, there are shown a
control equipment 8 for controlling processes and a great number ofdifferent sensors 7 for measuring the amounts of different processes. Thecontrol equipment 8 and thesensors 7 are provided to control related processes. Thesensors 7 produce many different measured values, but for convenience of explanation, two different measured values A and B are handled here. The different measured values A and B of process amount are supplied to aprocess input apparatus 1 and then to adifferentiation apparatus 2. Thedifferentiation apparatus 2 has a memory for storing the amounts of process, and calculates the amount of change of A, B per unit time (ti - ti-1) on this memory. The amounts of change with respect to time are represented by ∂A, ∂B, respectively. Shown at 3 is aqualitative inference apparatus 3 receives the differentiated values ∂A and ∂B (amounts of change with respect to time) of the measured values A and B, evaluates their appropriate values on the basis of the membership function resulting from previously evaluating the amount of change ∂A and ∂B stored in amemory 6 on the fuzzy amount, and infers the appropriate values of control target process amount after unit time ti+1 from those appropriate values. Shown at 4 is a centroid arithmetic apparatus for determining the amount of control on the basis of the inferred appropriate values and transcendental control amount evaluation information which is stored in thememory 6 and supplied to thecontrol equipment 8. The determined control amount is supplied from aprocess output unit 5 to thecontrol equipment 8. Such a control operation is performed at every unit times to control processes. - Fig. 2 shows the construction of one example of the
differentiation apparatus 2. In Fig. 2, reference character Xi indicates the amount of process (A or B) measured by thesensor 7 at time i. Thedifferential apparatus 2 receives the measured value Xi and produces the first-order differentiated value ∂Xi, second-order differentiated value ∂²Xi, ... nth-order differentiated value ∂nXi, where ∂nX represents the amount of change of ∂n-1X with respect to time. Thedifferentiation apparatus 2 hasn differentiation units memories - Fig. 3 shows the construction of the
qualitative inference apparatus 3. Thequalitative inference apparatus 3 comprises a qualitative logicproduct inference unit 9 for the process simulating qualitative differentiation equations of which the qualitative variables have a product relation and a qualitative logicsum inference unit 10 for the qualitative variables having a sum relation. Fig. 3 shows the case where the control target process amount is inferred by the differentiated value ∂A, ∂B, ∂C of different process amounts A, B, C measured by thesensors 7. The qualitative logic product inference unit is constructed as shown in Fig. 4. The amounts of change ∂X, ∂Y are the differentiated values of process amounts X, Y measured by thesensors 7. The qualitative logicproduct inference unit 9 comprises appropriate valuequalitative evaluation devices product inference device 32 employing the min-max method of fuzzy theory, and produces a qualitative product evaluation set S (∂X · ∂Y) of the amounts of change ∂X, ∂Y. The qualitative logicsum inference unit 10 is constructed as shown in Fig. 5. The qualitative logicsum inference unit 10 comprises appropriate valuequalitative evaluation devices sum inference device 33, and produces a qualitative sum evaluation set S(∂X + ∂Y) of the amounts of change ∂X, ∂Y. - The operation will be described with reference to the flow chart of Fig. 6.
- At step 11, the amounts of different processes necessary for the control are supplied to the
process input apparatus 1 and processed: Atstep 12, thedifferentiation apparatus 2 calculates the amounts of change of processes per unit time which were stored at step 11. Fig. 7 graphically shows the processing in thedifferentiation apparatus 2. Fig. 7a shows the change of the process amount X with respect to time, in which the ordinate indicates the absolute amount of the process amount X, and abscissa is time. Fig. 7a shows, for example, that the process amount X is changed from 5 to 25 relative to time ti-5 through time ti. The present time is represented by ti and thus unit time before the present time is ti-1. If the process amount X at time ti is denoted by Xi and the amount of change is ∂Xi, the amount of change ∂Xi is expressed by the difference between Xi - Xi-1, or
- In Fig. 7a, since Xi = 5, and Xi-1 is 15, the amount of change ∂Xi is -10. Fig. 7b shows the transition of the amount of change ∂X relative to time. In this figure, ∂Xi is negative, and the process amount X is reduced by absolute amount of 10 at time ti. As described above, at
step 12 the amounts of change of necessary different processes per unit time are calculated to produce constant values of local change of process. Then, steps 13 and 14 follows in turn, where thequalitative inference apparatus 3 performs inference. Atstep 13, the appropriate valuequalitative evaluation devices 31A to 31D make evaluation processing as shown in Figs. 4 and 5. In order to evenly evaluate the amount of change of different process amounts calculated atstep 12 and to infer the process change, the qualitative evaluation graph or membership function based on the emperical knowledge shown in Fig. 8 is stored in thestorage 6. Fig. 8 shows the three stage evaluation of decrease (-), no change (0) and increase (+) of process amount X relative to the differentiated value (amount of change) ∂X. The evaluation stages may be two different stages of, for example, decrease and increase or five different stages of decrease, slight decrease, no change, slight increase, and increase. The number of stages is arbitrary depending on the density of empirical information. In Fig. 8, the ordinate is the appropriate value defined as 0.0 to 1.0 for qualitative evaluation degree and the abscissa is the amount of change X. The range of the amount of change ∂X is from -20 to 20, and when the amount of change ∂X is -20, the appropriate value of decrease is 1.0. This qualitatively implies that if the process amount X is decreased by 20, the process amount X is decreased definitely. However, when the amount of change ∂X is 5, the process amount is not always decreased, and thus the appropriate value of decrease is set to 0.0. When the amount of change ∂X is in the range from -20 to 5, the appropriate value is set to a value between 0.0 and 1.0 because such decision as above cannot be made. Since the amount of change ∂Xi shown in Fig. 7 is -10, the appropriate value is 0.8 from the intersection in the decrease evaluation graph. This evaluation is "the process amount X is decreasing at the rate of 0.8 at time t₁". The evaluation graph of no change is in a form of mountain in which the appropriate value is 1.0 when the amount of change ∂X is around 0 and it is 0.0 when the amount of change is ±17. When the amount of change ∂X is -10, the appropriate value of no change is 0.2. The evaluation graph of increase is such a form that the appropriate value is 1.0 for 20 of amount of change ∂X and 0.0 for -7 of amount of change ∂X. When the amount of change ∂Xi is -10, the appropriate value of increase is 0.0. This is not said to increase from qualitative viewpoint. As a result, the qualitative evaluation is expressed by the set, S defined by the following equation.
- In the equation (2), µ+(∂X) indicates the appropriate value of increase, µ0(∂X) is the appropriate value of no change, and µ-(∂X) is the appropriate value of decrease. At
step 13, as described above, the differentiated value ∂X is inputted and the qualitative evaluation set is produced at the output. By the processing atstep 13, the appropriate values of different process amounts are evaluated evenly. Atstep 14, the inference processing is carried out by the qualitativeproduct inference device 32 and the qualitativesum inference device 33. Atstep 14, the qualitative evaluation appropriate value set of the control target process amount after unit time ti+1 is inferred on the basis of the qualitative evaluation set relative to the differentiated value (amount of change) ∂X of different process amounts produced atstep 13 by the rule based on the empirical information. - Fig. 9 shows the rule in the qualitative product inference. In Fig. 9, when the differentiated values (amount of change) ∂X, ∂Y of two different process amounts X, Y are inputted, the process amounts inferred from the product thereof, or the appropriate values of amounts of change ∂X, ∂Y can be found by the following way. The decrease is indicated by -, the no change by 0 and the increase by +. Fig. 9 shows the following 9 different rules made on the basis of the experience rules.
- (Rule 1) if ∂X is - and if ∂Y is -, then ∂X·∂Y is +.
- (Rule 2) if ∂X is - and if ∂Y is 0, then ∂X·∂Y is 0.
- (Rule 3) if ∂X is - and if ∂Y is +, then ∂X·∂Y is -.
- (Rule 4) if ∂X is 0 and ∂Y is -, then ∂X·∂Y is 0.
- (Rule 5) if ∂X is 0 and ∂Y is 0, then ∂X·∂Y is 0.
- (Rule 6) if ∂X is 0 and ∂Y is +, then ∂X·∂Y is 0.
- (Rule 7) if ∂X is + and ∂Y is -, then ∂X·∂Y is -.
- (Rule 8) if ∂X is + and ∂Y is 0, then ∂X·∂Y is 0.
- (Rule 9) if ∂X is + and ∂Y is +, then ∂X·∂Y is +.
- The
rule 9, for example, can be explained by, such a qualitative way as "if the process amounts X and Y are both increasing, the process amount of product X·Y increases". The qualitativeproduct inference device 32 carries out the above rule as follows. The evaluation sets S(∂X), S(∂Y) are expressed as, for example,
S(∂X) = (0.8, 0.2, 0.1)
S(∂Y) = (0.6, 0.8, 0.0) - In this example, the process amount X tends to decrease, and the process amount Y is most probably not changed. The qualitative
product inference device 32, when supplied with these values, carries out all the 9 different rules. For example, in therule 9, the increase appropriate value µ+(∂X·∂Y) of the amount of change ∂X·∂Y is the smaller one of the increase appropriate value of the amount of change ∂X and the increase appropriate value of the amount of change ∂Y. In other words,
In therule 1, similarly the increase appropriate value of the amount of change ∂X·∂Y is inferred. Thus,
By employing the minimum of the change appropriate values of the differentiated values of different process amounts in each rule, it is possible to find the change of situations without error. When the 9 different rules are all executed in this way, a plurality of increase appropriate values of amount of change ∂X·∂Y are inferred. The local trend of process can be found by selecting the most appropriate value from the plurality of inferred results. Thus, the increase appropriate value of the amount of change ∂X·∂Y is the appropriate value, 0.6 inferred byrule 9. This means that the amount of change ∂X·∂Y is decided to be "considserable increase" by the experiential observation of the process action from the two different viewpoints. Therule 9 is useful to infer that when two different measured values X, Y both increase, the amount of change ∂X·∂Y increases, while therule 1 can infer that when two different measured values X, Y both decrease, the amount of change ∂X·∂Y increases. In this way, the qualitative evaluation set S(∂X·∂Y) of the amount of change ∂X·∂Y is produced from the qualitative logicproduct inference apparatus 9. - Fig. 10 shows the inference rules which the qualitative
sum inference device 32 carries out. This qualitativesum inference apparatus 33 is different from the qualitativeproduct inference device 32 in rules. The operations performed in accordance with the rules are the same. The reason why the qualitative logicproduct inference apparatus 9 and the qualitative logicsum inference apparatus 10 are separately provided is that the qualitative differential equation which simulates the transition of the process state is determined by the qualitative logic sum and qualitative logic product of the differentiated values of different process amounts. Thus, either apparatus may be used depending on the process. - The amount of change ∂a of the control target process amount a after unit time is determined by the differentiated values of different process amounts A, B, C and expressed by the following qualitative differential equation.

In equation (3), dot "·" indicate the qualitative product and "+" indicates the qualitative sum. The equation (3) can be explained qualitatively as "the rate ∂a of change of the process amount a after unit time is determined by the sum of the product of the rate of change ∂A of the process amount A and the rate of change ∂B of the process amount B, and the rate ∂C of change of the process amount C". The "rate of change" is indicated by the qualitative evaluation appropriate value or the set. Thus, thequalitative inference apparatus 3 comprises the qualitative logicproduct inference apparatus 9 which receives ∂A and ∂B and produces the qualitative product evaluation set S(∂A·∂B) of ∂A·∂B and the qualitative logicsum inference apparatus 10 which receives S(∂A·∂B) and ∂C. The qualitative inference apparatus produces the qualitative evaluation set of the rate of change of the control target process amount a after unit time, or S(∂A·∂B + ∂C). - Then, at
step 15 the amount of control is determined by the centroidarithmetic apparatus 4. The centroidarithmetic apparatus 4 receives the qualitative evaluation set inferred by thequalitative inference apparatus 3, and determines the amount of control on the basis of the transcendental information thereto. Fig. 11 shows the evaluation graph (membership function) of the amounts of control produced on the basis of experiential knowledge. In Fig. 11, the amount of increase and decrease from the present amount of control, or the amount of control is evaluated qualitatively. In Fig. 11, the ordinate indicates the appropriate values in the range from 0.0 to 1.0 and the abscissa is the amount of control. The amount of control is evaluated in three stages of decrease, no change and increase. In Fig. 11, the evaluation of "decrease" is the monotonous decrease type in which the appropriate value is 1.0 for amount of control of -40 and 0.0 for amount of control of 0, the evaluation of "no change" is the mountain type in which the appropriate value is 1.0 for the amount of control of 0 and 0.0 for the amount of control of -30 and +30, and the evaluation of "increase" is the monotonous increase type in which the appropriate value is 1.0 for the amount of control of 40 and 0.0 for the amount of control of 0. The centroidarithmetic apparatus 4 refers to the control amount evaluation graph, shown in Fig. 11, stored in thestorage 6 and determines the amount of control as follows. The qualitative evaluation appropriate value set S(∂a) of the control target process amount after unit time calculated atstep 14 is expressed as
- Each value of this set is employed as the evaluation to the respective amount of control, and as shown in Fig. 11, the area surrounded by each evaluation graph curve, appropriate values 0.0, 1.0, and control amounts -45, +45 is cut by each appropriate evaluation straight line. Thus, the shaded effective evaluation area can be obtained as illustrated. This shaded area indicates the degree of effectiveness in each evaluation stage. The centroid
arithmetic apparatus 4 calculates the centroid G having the same mass as that of the shaded area, and the coordinate of the centroid G relative to the control amount axis. In this example, it is -16. This value is the amount of control operation. The above processing can be explained qualitatively as "since the control target process amount a is most probably decreased after unit time, the amount of control should be decreased by 16 from the present value". In this way, atstep 15 the amount of control operation is determined by the qualitative evaluation value of the control target process amount after unit time. - At
step 16, the amount of control operation determined as above is supplied to the process. - A sequence of the processings is repeated at every unit time which is determined by the time constant of the process to be controlled, so as to control the process.
- Thus, according to this invention, since different process amounts or the amounts of change thereof with respect to time are evaluated qualitatively by transcendental information and since the qualitative evaluation values of the control target process amount after unit time are inferred by the rules based on the transcendental information from the evaluation information, it is possible to make control in good response to the local change of process.
- Moreover, since different process amounts or the amounts of change are qualitatively evaluated as increase, no change and decrease and the rate, or probability thereof is determined in the range from 0.0 to 1.0 and used for the determination of the amount of control operation, the amounts of control are not extreme values, resulting in increase of reliability.
- Fig. 12 shows characteristic curves useful for explaining the effect of this invention.
- Fig. 12a shows the transition of the control target process amount a relative to time. The amount of change ∂a of the process amount a unit time ti+1 after the present time ti is determined by the amounts of change of different process amounts A, B at time ti as described above.
- Fig. 12b shows the transition of the process amount A relative to time. Fig. 12c shows the transition of the amount of change per unit time ∂A of the process amount A relative to time, Fig. 12d shows the transition of the process amount B relative to time, and Fig. 12e shows the transition of the amount of change per unit ∂B time of the process amount B relative to time.
- In the conventional prediction-based method using the method of least squares, the process amounts A, B are both predicted to increase from the observation of the past time-sequential data as indicated by the crosses small circles with cross ⓧ in Fig. 12. Thus, the control target process amount a is also predicted to increase after unit time ti+1 as indicated by the small circles with cross ⓧ . However, at time ti the process amount B is suddenly decreased and the actual control target process amount a is indicated by double small circles ⓞ . In this invention, since the amount of change ∂A of the process amount A, and since the amount of change ∂B of the process amount B are evaluated qualitatively and the change of the process amount a is inferred by the experiential rules, the prediction as indicated by the double small circles can be achieved. Thus, the amount of control operation can be correctly determined. As a result, the control can follow the local sudden change. The number of processes is of course not limited to two.
- Fig. 13 shows another embodiment of this invention. The embodiment in Fig. 13 is different from that in Fig. 1 in that the
feedback identification apparatus 20 is provided. The contents to be processed in the centroidarithmetic apparatus 4 are also somewhat changed. The feature of the embodiment of Fig. 13 is that the amount of control is fed back to repeat a sequence of processings until the control target process amount a inferred is within the control target allowable range. The same processing as in the embodiment shown in Fig. 1 is performed to calculate the amount-of-change qualitative evaluation set of the control target process amount. The centroidarithmetic apparatus 4 determines the amount of control operation and the amount of change of the control target process from the empirical information. - Fig. 14 shows the construction of the
feedback identification apparatus 20. Thefeedback identification apparatus 20 receives the amount of displacement ∂ai of the control target information a predicted at time i and absolute amount ai at time i from the centroidarithmetic apparatus 4. Acomparator 301 adds ai and ∂ai to calculate a predicted absolute value and compares it with the control target value b. If the difference is smaller than the allowable error C, or much satisfactory, the comparator actuates theprocess output apparatus 5, and produces the absolute value as a control amount to the control equipment. If the absolute value of difference between the predicted value and the control target value b is larger than the allowable error, or the amount of control is necessary to be reconsidered, a control amountarithmetic unit 303 is actuated. Theunit 303 calculates the amount of control relative to the difference and replaces the amount of operation of the control equipment supplied from the process by this value, thereby actuating thedifferentiation apparatus 2 recurrently. Fig. 15 shows a flow chart of the above operations. - Thus, a sequence of processings is repeated until the control target process amount is within the control target allowable range, so as to predict with high precision.
- Figs. 16 and 17 show still another embodiment for the application to the pollution predicting system within a road tunnel.
- The factors for determining the degree of the pollution within the tunnel are physically the number of vehicles, the ratio of large-sized cars to vehicles, speed of cars, natural wind and mechanical ventilation power of ventilator such as jet fan. If the amount of pollution generated from time t to time t+1 is represented by ∂C, this process can be expressed by the following qualitative differential equation.

where - C:
- amount of pollution
- Nb:
- number of large-sized cars per 5 minutes
- Ns:
- number of small-sized cars per 5 minutes
- V :
- speed of car (Km/hour)
- Wn:
- natural wind m/s
- Um:
- mechanical ventilation power (m³/s)
- In this system built by using the construction of Fig. 1 according to this invention, the
differential apparatus 2 and thequalitative inference apparatus 3 are shown in Figs. 16 and 17, respectively. - The
differentiation apparatus 2 receives Nb, Ns, D, Um, Wn from the sensors of the process and produces qualitative variables included in the equation (4). In other words, it produces absolute amounts Nb, Wn, first-order differentiated values ∂Nb, ∂Ns, ∂D(= V), ∂Um, second-order differentiated values ∂²D(= ∂V). - The
qualitative inference apparatus 3 receives the membership function to each qualitative variable, from thestorage 6 and the above-given qualitative variables as shown in Fig. 18, and infers qualitatively in accordance with the equation (4). The inference is made in steps and finally the appropriate degree set S (∂C) of ∂C is produced. Although the elements of the equation (4) are absolutely different in unit from the physical standpoint, this system is able to make total prediction. - Fig. 19 shows the control by the conventional quantitative type model and the control by the invention using fuzzy for the comparison therebetween. The control in both system is the predicted situations of the pollution value of the air within a tunnel. The abscissa is the measured pollution value VI, and the ordinate is the predicted value obtained by each control system. From Fig. 19 it will be seen that the conventional model has a wide distribution, while the system of this invention provides extremely excellent correlation and high-precision prediction.
- Thus, according to this invention, since the amounts of change of different process amounts per unit time are qualitatively evaluated from transcendental information and the probability of change of the control target process amount after unit time is inferred by the rules based on the transcendental information from the evaluated information this system can make control to satisfactorily follow the local change of process.
Claims (3)
- A method for controlling a process, comprising:- inputting a plurality of process information variables (A, B, C, δA, δB);- performing a qualitative evaluation of said information variables using membership functions (e.g. Decrease (-), No-change (0), Increase (+)), thus creating evaluation sets (S(A), S(B), S(δA), S(δB)) of said information variables;- performing fuzzy inference on said evaluation sets (S(A), S(B), S(δA), 3(δB)) based on predetermined rules, whereby:
said fuzzy inference consists of at least two consecutive stages of fuzzy inference operations with:- the first stage of fuzzy inference operations based on a first group of predetermined rules;- the second stage of fuzzy inference operations based on a second group of predetermined rules; and the results of said first stage of fuzzy inference operations are subjected to said second stage of fuzzy inference operations without intermediately converting such results into a quantitative value for controlling said process;and- converting the results of said fuzzy inference into at least one quantitative value for controlling said process, by using a membership function,
characterised in that:- said first and second stages of fuzzy inference operations are subsequently used successively to perform fuzzy inference on:
intermediate evaluation sets (S(δA.δB), S(δA+δB)) and
evaluation sets of measured variables which were not previously used (S(δC));- whereby said intermediate evaluation sets (S(δA.δB), S(δA+δB)) are produced by means of a qualitative logic sum inference and/or a qualitative logic product inference which consist of:thus rendering the method capable of controlling said process in accordance with a qualitative differential equation which expresses the actions of said process.
defining experience-based qualitative logic sum/product rules;
inferring qualitative sum/product evaluation sets (S(δA.δB), S(δA+δB)), on the basis of the defined rules; - The method of claim 1, wherein at least some of the process information variables are differentiated to produce first order or higher order differentiated values before performing qualitative evaluation.
- The method of claim 1, wherein the quantitative value for controlling said process is compared with a target value, and if the difference therebetween is larger than an allowable error, a control value relative to this difference is calculated and fed back to the input to replace the input process information variables.
Applications Claiming Priority (2)
| Application Number | Priority Date | Filing Date | Title |
|---|---|---|---|
| JP89077/88 | 1988-04-13 | ||
| JP8907788 | 1988-04-13 |
Publications (3)
| Publication Number | Publication Date |
|---|---|
| EP0337423A2 EP0337423A2 (en) | 1989-10-18 |
| EP0337423A3 EP0337423A3 (en) | 1990-08-16 |
| EP0337423B1 true EP0337423B1 (en) | 1995-10-18 |
Family
ID=13960797
Family Applications (1)
| Application Number | Title | Priority Date | Filing Date |
|---|---|---|---|
| EP89106504A Expired - Lifetime EP0337423B1 (en) | 1988-04-13 | 1989-04-12 | Process control method and control system |
Country Status (3)
| Country | Link |
|---|---|
| US (1) | US5025499A (en) |
| EP (1) | EP0337423B1 (en) |
| DE (1) | DE68924548T2 (en) |
Families Citing this family (40)
| Publication number | Priority date | Publication date | Assignee | Title |
|---|---|---|---|---|
| US5432885A (en) * | 1987-10-16 | 1995-07-11 | Mitsubishi Denki Kabushiki Kaisha | Recurrent fuzzy inference apparatus |
| US5251285A (en) * | 1988-03-25 | 1993-10-05 | Hitachi, Ltd. | Method and system for process control with complex inference mechanism using qualitative and quantitative reasoning |
| JPH0354605A (en) * | 1989-07-21 | 1991-03-08 | Fanuc Ltd | Numerical controller |
| EP0417975B1 (en) * | 1989-09-10 | 1997-04-02 | Canon Kabushiki Kaisha | Automatic focusing system |
| JPH03166601A (en) * | 1989-11-27 | 1991-07-18 | Hitachi Ltd | Symbolizing device and process controller and control supporting device using the symbolizing device |
| JP2899040B2 (en) * | 1990-02-27 | 1999-06-02 | キヤノン株式会社 | Focus control device |
| JP2682891B2 (en) * | 1990-07-25 | 1997-11-26 | 新キャタピラー三菱株式会社 | Excavator control equipment for power shovel |
| KR950004454B1 (en) * | 1990-07-26 | 1995-05-01 | 오므론 가부시끼 가이샤 | Apparatus for inference operation |
| JPH0833686B2 (en) * | 1990-07-30 | 1996-03-29 | 松下電器産業株式会社 | Image density control device |
| JPH0488558A (en) * | 1990-08-01 | 1992-03-23 | Nissan Motor Co Ltd | Designing device |
| JP2543242B2 (en) * | 1990-09-03 | 1996-10-16 | 松下電器産業株式会社 | Fuzzy reasoning device |
| US5145112A (en) * | 1990-10-08 | 1992-09-08 | Kabushiki Kaisha Toyota Chuo Kenkyusho | Air conditioner |
| US5321795A (en) * | 1991-05-24 | 1994-06-14 | Alvarez De Toledo Santiago | Pattern association central subsystem and a perception learning system |
| TW297107B (en) * | 1991-06-18 | 1997-02-01 | Meidensha Electric Mfg Co Ltd | |
| US6078911A (en) * | 1991-10-15 | 2000-06-20 | General Electric Company | Compilation of rule bases for fuzzy logic control |
| DE4139945A1 (en) * | 1991-12-04 | 1993-06-09 | Deutsche Thomson-Brandt Gmbh, 7730 Villingen-Schwenningen, De | CONTROL PROCESS AND CONTROL CIRCUIT |
| US5392382A (en) * | 1992-12-01 | 1995-02-21 | Schoppers; Marcel J. | Automated plan synthesizer and plan execution method |
| US5386373A (en) * | 1993-08-05 | 1995-01-31 | Pavilion Technologies, Inc. | Virtual continuous emission monitoring system with sensor validation |
| TW284866B (en) * | 1994-07-08 | 1996-09-01 | Philips Electronics Nv | |
| US5732192A (en) * | 1994-11-30 | 1998-03-24 | The United States Of America As Represented By The Administrator Of The National Aeronautics And Space Administration | Global qualitative flow-path modeling for local state determination in simulation and analysis |
| US5748467A (en) * | 1995-02-21 | 1998-05-05 | Fisher-Rosemont Systems, Inc. | Method of adapting and applying control parameters in non-linear process controllers |
| US5970426A (en) * | 1995-09-22 | 1999-10-19 | Rosemount Analytical Inc. | Emission monitoring system |
| US6957172B2 (en) | 2000-03-09 | 2005-10-18 | Smartsignal Corporation | Complex signal decomposition and modeling |
| WO2001067262A1 (en) * | 2000-03-09 | 2001-09-13 | Smartsignal Corporation | Generalized lensing angular similarity operator |
| US7739096B2 (en) * | 2000-03-09 | 2010-06-15 | Smartsignal Corporation | System for extraction of representative data for training of adaptive process monitoring equipment |
| US6952662B2 (en) * | 2000-03-30 | 2005-10-04 | Smartsignal Corporation | Signal differentiation system using improved non-linear operator |
| US6556939B1 (en) | 2000-11-22 | 2003-04-29 | Smartsignal Corporation | Inferential signal generator for instrumented equipment and processes |
| US7233886B2 (en) * | 2001-01-19 | 2007-06-19 | Smartsignal Corporation | Adaptive modeling of changed states in predictive condition monitoring |
| US20020183971A1 (en) * | 2001-04-10 | 2002-12-05 | Wegerich Stephan W. | Diagnostic systems and methods for predictive condition monitoring |
| US7539597B2 (en) | 2001-04-10 | 2009-05-26 | Smartsignal Corporation | Diagnostic systems and methods for predictive condition monitoring |
| US6975962B2 (en) * | 2001-06-11 | 2005-12-13 | Smartsignal Corporation | Residual signal alert generation for condition monitoring using approximated SPRT distribution |
| US6647745B1 (en) * | 2002-12-05 | 2003-11-18 | Praxair Technology, Inc. | Method for controlling the operation of a cryogenic rectification plant |
| GB0415143D0 (en) * | 2004-07-06 | 2004-08-11 | Attar Software Ltd | Fuzzy decision tree based machine and process control/optimisation |
| US7421348B2 (en) * | 2005-03-18 | 2008-09-02 | Swanson Brian G | Predictive emissions monitoring method |
| US8768664B2 (en) * | 2005-03-18 | 2014-07-01 | CMC Solutions, LLC. | Predictive emissions monitoring using a statistical hybrid model |
| US7249470B2 (en) * | 2005-04-07 | 2007-07-31 | Praxair Technology, Inc. | Method of controlling liquid production utilizing an expert system controller |
| US8275577B2 (en) | 2006-09-19 | 2012-09-25 | Smartsignal Corporation | Kernel-based method for detecting boiler tube leaks |
| US8311774B2 (en) | 2006-12-15 | 2012-11-13 | Smartsignal Corporation | Robust distance measures for on-line monitoring |
| CN104302050B (en) * | 2014-10-08 | 2017-05-17 | 西南交通大学 | Expressway tunnel group illumination system control system and method |
| CN116608566B (en) * | 2023-05-22 | 2023-12-22 | 北京城建设计发展集团股份有限公司 | Intelligent passive energy-saving system for junction underground traffic station based on building integration |
Citations (1)
| Publication number | Priority date | Publication date | Assignee | Title |
|---|---|---|---|---|
| JPS6362001A (en) * | 1986-09-03 | 1988-03-18 | Hitachi Ltd | Digital control system by fuzzy inference |
Family Cites Families (6)
| Publication number | Priority date | Publication date | Assignee | Title |
|---|---|---|---|---|
| JPH0734162B2 (en) * | 1985-02-06 | 1995-04-12 | 株式会社日立製作所 | Analogical control method |
| JPS61234405A (en) * | 1985-04-10 | 1986-10-18 | Hitachi Ltd | Digital control system |
| EP0241286B2 (en) * | 1986-04-11 | 1994-11-09 | Mitsubishi Denki Kabushiki Kaisha | An auto-tuning controller |
| US4882526A (en) * | 1986-08-12 | 1989-11-21 | Kabushiki Kaisha Toshiba | Adaptive process control system |
| DE3811086A1 (en) * | 1987-04-03 | 1988-10-20 | Hitachi Ltd | PID CONTROL SYSTEM |
| US4860213A (en) * | 1987-10-01 | 1989-08-22 | General Electric Company | Reasoning system for reasoning with uncertainty |
-
1989
- 1989-04-12 EP EP89106504A patent/EP0337423B1/en not_active Expired - Lifetime
- 1989-04-12 DE DE68924548T patent/DE68924548T2/en not_active Expired - Lifetime
- 1989-04-12 US US07/336,797 patent/US5025499A/en not_active Expired - Lifetime
Patent Citations (2)
| Publication number | Priority date | Publication date | Assignee | Title |
|---|---|---|---|---|
| JPS6362001A (en) * | 1986-09-03 | 1988-03-18 | Hitachi Ltd | Digital control system by fuzzy inference |
| US5012430A (en) * | 1986-09-03 | 1991-04-30 | Hitachi, Ltd. | Fuzzy inference-based digital control method and apparatus |
Non-Patent Citations (1)
| Title |
|---|
| Proceedings of 1984 International Conference on Industrial Electronics, Control and Instrumentation (IECON '84), vol. 2, pages 657 - 662, SICE of Japan; Yasunobu, Miyamoto et al.: "Application of predictive Fuzzy control to Automatic Train Operation controller." * |
Also Published As
| Publication number | Publication date |
|---|---|
| DE68924548T2 (en) | 1996-06-27 |
| EP0337423A3 (en) | 1990-08-16 |
| DE68924548D1 (en) | 1995-11-23 |
| US5025499A (en) | 1991-06-18 |
| EP0337423A2 (en) | 1989-10-18 |
Similar Documents
| Publication | Publication Date | Title |
|---|---|---|
| EP0337423B1 (en) | Process control method and control system | |
| Smith et al. | Automated calibration of a fuzzy logic controller using a cell state space algorithm | |
| US5377308A (en) | Method and system for process control with complex inference mechanism using qualitative and quantitative reasoning | |
| Corchardo et al. | Neuro-adaptation method for a case-based reasoning system | |
| Baldovino et al. | Design and development of a fuzzy-PLC for an earthquake simulator/shake table | |
| Halgamuge | A trainable transparent universal approximator for defuzzification in Mamdani-type neuro-fuzzy controllers | |
| Van Broekhoven et al. | A comparison of three methods for computing the center of gravity defuzzification | |
| Suja Malar et al. | MODELLING OF CONTINUOUS STIRRED TANK REACTOR USING ARTIFICIAL INTELLIGENCE TECHNIQUES. | |
| Jou | Supervised learning in fuzzy systems: algorithms and computational capabilities | |
| EP0355716A2 (en) | Rule generating apparatus and method of generating rules for fuzzy inference | |
| Manoranjan et al. | A systematic approach to obtaining fuzzy sets for control systems | |
| Ghalia | Modelling and robust control of uncertain dynamical systems using fuzzy set theory | |
| JPH0588900A (en) | Learning type fuzzy controller and control method | |
| Chouraqui et al. | Unmanned vehicle trajectory tracking by neural networks | |
| Barriga et al. | Automatic synthesis of fuzzy logic controllers. | |
| Zelch et al. | Learning control policies from optimal trajectories | |
| JPH07104683B2 (en) | Process control equipment | |
| Raimondi et al. | Short-time fuzzy DAP predictor for air pollution due to vehicular traffic | |
| Ogunti et al. | The algorithm of fully fuzzy cognitive map models | |
| Nauck et al. | The evolution of neuro-fuzzy systems | |
| Jeong et al. | Adaptive sliding mode control based on FLS | |
| Melin et al. | A new neuro-fuzzy-fractal approach for adaptive model-based control of non-linear dynamic systems: The case of controlling aircraft dynamics | |
| Dineva et al. | Interval type-2 fuzzy system in personalized driving cycle forecasting | |
| Wang et al. | Feed-forward multilayer neural network model for vehicle lateral guidance control | |
| CA2254763A1 (en) | Multi grade fuzzy logic controller |
Legal Events
| Date | Code | Title | Description |
|---|---|---|---|
| PUAI | Public reference made under article 153(3) epc to a published international application that has entered the european phase |
Free format text: ORIGINAL CODE: 0009012 |
|
| AK | Designated contracting states |
Kind code of ref document: A2 Designated state(s): DE |
|
| PUAL | Search report despatched |
Free format text: ORIGINAL CODE: 0009013 |
|
| AK | Designated contracting states |
Kind code of ref document: A3 Designated state(s): DE |
|
| 17P | Request for examination filed |
Effective date: 19901212 |
|
| 17Q | First examination report despatched |
Effective date: 19921229 |
|
| GRAA | (expected) grant |
Free format text: ORIGINAL CODE: 0009210 |
|
| AK | Designated contracting states |
Kind code of ref document: B1 Designated state(s): DE |
|
| REF | Corresponds to: |
Ref document number: 68924548 Country of ref document: DE Date of ref document: 19951123 |
|
| PLBE | No opposition filed within time limit |
Free format text: ORIGINAL CODE: 0009261 |
|
| STAA | Information on the status of an ep patent application or granted ep patent |
Free format text: STATUS: NO OPPOSITION FILED WITHIN TIME LIMIT |
|
| 26N | No opposition filed | ||
| PGFP | Annual fee paid to national office [announced via postgrant information from national office to epo] |
Ref country code: DE Payment date: 20080606 Year of fee payment: 20 |