EP0124908A2 - Method of obtaining half-tone dot percents necessary for reproducing colors - Google Patents
Method of obtaining half-tone dot percents necessary for reproducing colors Download PDFInfo
- Publication number
- EP0124908A2 EP0124908A2 EP84105255A EP84105255A EP0124908A2 EP 0124908 A2 EP0124908 A2 EP 0124908A2 EP 84105255 A EP84105255 A EP 84105255A EP 84105255 A EP84105255 A EP 84105255A EP 0124908 A2 EP0124908 A2 EP 0124908A2
- Authority
- EP
- European Patent Office
- Prior art keywords
- color
- color information
- tone dot
- specimen
- percent
- Prior art date
- Legal status (The legal status is an assumption and is not a legal conclusion. Google has not performed a legal analysis and makes no representation as to the accuracy of the status listed.)
- Granted
Links
Images


Classifications
-
- G—PHYSICS
- G03—PHOTOGRAPHY; CINEMATOGRAPHY; ANALOGOUS TECHNIQUES USING WAVES OTHER THAN OPTICAL WAVES; ELECTROGRAPHY; HOLOGRAPHY
- G03F—PHOTOMECHANICAL PRODUCTION OF TEXTURED OR PATTERNED SURFACES, e.g. FOR PRINTING, FOR PROCESSING OF SEMICONDUCTOR DEVICES; MATERIALS THEREFOR; ORIGINALS THEREFOR; APPARATUS SPECIALLY ADAPTED THEREFOR
- G03F5/00—Screening processes; Screens therefor
-
- B—PERFORMING OPERATIONS; TRANSPORTING
- B41—PRINTING; LINING MACHINES; TYPEWRITERS; STAMPS
- B41F—PRINTING MACHINES OR PRESSES
- B41F33/00—Indicating, counting, warning, control or safety devices
- B41F33/0027—Devices for scanning originals, printing formes or the like for determining or presetting the ink supply
Abstract
Description
- This invention relates to a method of obtaining half-tone dot percents of color separations of C (cyan), M (magenta), Y (yellow) and Bk (black) for carrying out printing in accordance with color information obtained by optically measuring a color specimen.
- In order that an orderer may pre-assign colors for a certain portion of a printed matter, a small sheet of paper for assigning colors called as a color specimen has been sometimes attached to a layout. For example, in the case a background of a picture is desired to be evenly painted out with a specific color, a small sheet of paper painted with color of said background is attached as a color specimen and is sent to a printing factory.
- The printing factory employs a four-color printing system using color separations of C, M, Y and Bk, which is the commonest multicolor printing system, and decides what percent of half-tone dot percents of color separations of C, M, Y and Bk should be used to print the assigned portion with the same color as that of the color specimen, before preparation of color separations under such conditions and printing.
- In the past, the above-described work includes preparing a color chart which is an assembly of a multiplicity of printed matters, said color chart being printed with half-tone dot percents of color separations of C, M, Y, and Bk varied at intervals of about 10%, visually comparing the color specimen with colors on the color chart by an operator to select a color most approximate to the color specimen out of the color chart, utilizing the fact that half-tone dot percents of color separations necessary for printing colors in the color chart are described in the color chart to find half-tone dot percents of color separations necessary for printing said selected color, preparing color separations having said half-tone dot percents, and reproducing colors assigned by the color specimen.
- However, this method arises disadvantages, that since this work requires hands, and kinds of colors in the color chart are stupendous, comparisng' work for comparing colors in the color chart with the color specimen takes much time, and that colors selected from the color chart differ depending on operators, and thus, irregularities in colors to be reproduced tend to occur.
- On the other hand, a reflection densitometer is now commercially available which can measure density of an article to be measured to figure out a half-tone dot percent. According to this densitometer, the measured value of density is processed by a computer housed in the densitometer to calculate a half-tone dot percent.
- In this densitometer, a Yule-Nielsen's equation is used to calculate a half-tone dot percent. However, the scope of application of the Yule-Nielsen's equation has a limitation.
- That is, this equation is on the assumption that the relation with a standard density of half-
tone dot percent 100% is utilized, and therefore, only the color having said standard density can be applied thereto and is addition, the equation can be normally used only wher an article to be measured has a mono-color. Moreover, this equation is realized by the fact that dots are reproduced ideally without dot gains or the like and the coefficients vary due to factors of screen rulings, density, quality of paper. Therefore, in actual use, even a mono-color, it is not possible to accurately obtain half-tone dot percents in the wide range from a light area to a shadow area. Yet, it is impossible to calculate half-tone dot percents more than a secondary color. - Accordingly, such a densitometer cannot be used for work for obtaining half-tone dot percents of color separations of C, M, Y and Bk which can reproduce colors assigned by the color specimen.
- Also, a conventional densitometer as described is not possible to accurately obtain half-tone dot percents of color separations for reproducing colors on the color specimen even for the following reason.
- That is, printing ink of C, M and Y are not ideal, and M component and Y component are included in C ink, C component and Y component included in M ink, and C component and M component included in Y ink.
- It is for example supposed that an image of half-
tone dot percent 100% is printed with only C ink of a certain ink makers. When densities of C, M and Y of this printed matter are obtained through R filter, G filter and B filter, respectively, they are 1.53, 0.52 and 0.17, respectively, and despite the fact that printing is made only with C ink, M component and Y component are included. When the Yule-Nielsen's equation is ased to obtain a half-tone dot percent, the half-tone dot percent of each color separation will have the value corresponding to the aforesaid density value, failing to obtain a proper half-tone dot percent. Such a phenomenon becomes more complicated in case of a printed matter in which ink of plural colors are printed. - It can be understood even from the above-described reason that the densitometer using the Yule-Nielsen's equation cannot be applied to the aforementioned work.
- Some of colors assigned by the color specimen are not present in the color chart. It is well known that bright colors among the secondary colors, for example, such as green, orange, purple and the like are difficult to be reproduced in the color-printing with ordinary process ink.
- This greatly results from the fact that chromaticity of process ink is relatively strained as compared with chromaticity of theoretical three primary colors for the reasons of economy, printability, light- resistance, water resistance and the like, and therefore, turbidity arises. Even such a color is compared with ones on the color chart to compare it with a color which seems to be closest thereto. Then, the color would be judged to be a color which is hard to be reproduced sensuously. However, it is not possible quantitatively grasp to what extent the color cannot be reproduced.
- Accordingly, in actual work, a color which is sensuously closest is selected out of the color chart, and half-tone dot percents of color separations are corrected so as to make that color to approximate to that of the color specimen by retouching work before printing. However, it is often encountered that when the results of printing are checked, the reproduced color is greatly different from the color of the color specimen and the half-tone dot percents have to be changed. Considerable cost of material and loss of time result for such procedure. This problem is impossible to solve as long as one relies upon work by hands and upon the aforesaid densitometer.
- This invention has been achieved in an attempt of solving these problems noted above with respect to prior arts. An object of the invention is to provide a method which can obtain accurate half-tone dot percents of color separations where colors assigned by color specimens are reproduced by printing of ink of colors, for example, Y, M, C and Bk.
- It is another object of the invention to provide a method which can obtain accurate half-tone dot percents of color separations, even in the case the colors assigned by the color specimens are not a mono-color such as a secondary color or a tertiary color, necessary for reproduction of such colors.
- It is a still another object of the present invention is to provide a method wherein where colors assigned by the color specimens are those which are difficult to be reproduced by printing using ink of colors, for example, Y, M, C and Bk, to what extent the difficulty of reproduction involves can be known by expanding the conception of the half-tone dot percent to obtain the expanded half-tone dot percent.
- To achieve the aforementioned objects, in accordance with the present invention, a variety of combinations of half-tone dot percents of color. separations and color information obtained by optically measuring printed matters actually printed by said color separations are obtained to prepare a conversion table of color information -half-tone dot percent, a color specimen is optically measured to obtain color information of color to be printed, color information obtained from said color specimen and color information of said conversion table of color information - half-tone dot percent are compared to select color information most approximate to color information obtained from said color specimen, and a half-tone dot percent corresponding to said selected color information is obtained by making use of said table, the value of the half-tone dot percent of the obtained color separation being displayed on a display or being directly inputted into an external device such as a color scanner to use the same as data for preparing color separations.
- The nature, principle and details of the invention will be more clearly apparent from the following detailed description with respect to preferred embodiments of the invention with reference to the accompanying drawings, in which:
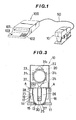
- FIG. 1 is an overall view of apparatus which can carry out the method in accordance with the present invention;
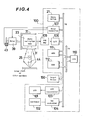
- FIG. 2 is a side view showing the construction of a measuring head of apparatus shown in FIG. 1;
- FIG. 3 is a front view showing the construction of the measuring head of apparatus shown in FIG. 1;
- FIG. 3 is a block diagram of an electric circuit of apparatus shown in FIG. 1;
- FIG. 5 is a flow chart showing the operation of preparing a conversion table of color density - half tone dot percent;
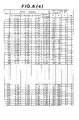
- FIGS. 6 (a) and (b) illustrate one example of the conversion table of color density - half tone dot percent stored in ROM;
- FIG. 7 is a flow chart showing the operation of the process in accordance with the method of the present invention;
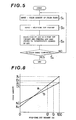
- FIG. 8 is a view for explaining the method of correction calculation;
- FIG. 9 is a flow chart showing the operation of a further method in accordance with the present invention;
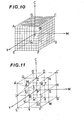
- FIGS. 10 and 11 are respectively views for explaining a method of interpolation calculation in the C, t and Y coordinate systems;
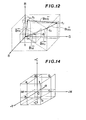
- FIG. 12 is a view for explaining a further method of interpolation calculation in the R, G and B coordinate system;
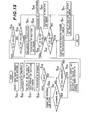
- FIG. 13 is a flow chart showing the operation of the process in accordance with another method of the present invention; and
- FIG. 14 illustrates a conception of the half tone dot percent in the C, M and Y coordinate systems.
- In the following, preferred embodiments of this invention will be described in detail with reference to the drawings.
- An apparatus used to carry out the method of the present invention into effect is shown in FIG. 1 in the form of an overall view. It will be understood that a
measuring head 10 is connected to abody 100 by acable 50. - The
body 100 houses an operation circuit which performs data processing which will be described later, and thebody 100 has adisplay device 101 and a key-board 102, which are electrically connected to the operation circuit, arranged on the front surface thereof. Areference numeral 103 designates a main switch which turns a power source ON and OFF. - For the
display device 10, a liquid crystal display (LCD), a fluorescent display tube, a cathode lay tube (CRT) or the like can be used, and various indication keys, a ten-key and the like are arranged on thekeyboard 102. - The measuring
device 10 comprises abase plate 11 and amovable body 20 as shown in FIGS. 2 and 3. Thebase plate 11 is preferably formed of transparent hard plastics or the like such as acrylic plate. The base plate is formed in the neighbourhood of one end edge thereof with a measuringhole 13 and has ajig 14 for mounting the movable body secured in the neighbourhood of the other end thereof. Thejig 14 comprises abottom plate 15 in contact with thebase plate 11 andside plates movable body 20 is rotatably mounted at a point A in the vicinity of the top of theside plates side plates projection 17 for depressing a limit switch mounted on the side of themovable body 20. The wholemovable body 20 is covered with ahousing 22, within which a measuring device is accommodated. Areference numeral 23 designates a photo-multiplier tube and alight receiving surface 24 thereof downwardly faces thereto. Below the photo-multiplier tube 23 are disposed alight source 25 and acondenser lens 44, which are accommodated within acylindrical case 26, and an illuminatinghole 27 is provided in the lower surface of thecylindrical case 26 so that thelight source 25 may illuminate a portion directly thereunder. In the circumference of thelight source 25 there is arranged aconical reflecting plate 28 connecting thehousing 22, and on the lower end thereof is mounted anobjective ring 29 which has a shape so that an outer circumference thereof is fitted into thehole 13. Ahole 30 of thering 29 is designed so as to have a dimension which is equal to or somewhat larger than the size of an illumination spot formed by thelight source 25. Immediately before thelight receiving surface 24 of the photo-multiplier 23, a plurality offilter holding plates 32 are mounted on agear 33, said holdingplates 32 holding and successively positioningvarious filters 31, which are in the illustrated embodiment, an R (red)filter 311; a G (green)filter 312, a B (blue)filter 313 and anamber filter 314. In this embodiment, fourfilter holding plates 32 are mounted on thegear 33, for four kinds of filters are used. - The
gear 33 is secured to arotary shaft 34 supported bybearings 35, and rotation thereof is transmitted by rotation of arotary shaft 37 of agear 36 meshed with thegear 33. Transmitted to therotary shaft 37 is a rotational force of amotor 39 by agear 41 mounted on arotary shaft 40 of themotor 39 through agear 38 mounted in the vicinity of one end of therotary shaft 37. - A disc.42 .for controlling the amount of rotation of the
motor 39 is fixedly mounted on therotary shaft 40. Thedisc 42 is bored, in the vicinity of the circumference thereof, to make a hole with a spacing which can rotate thegear 33 by 1/4 of one rotation to position thefilters 31 immediately before thelight receiving surface 24, and a light projecting and receivingelement 43 is provided to detect said hole. - To measure color information of a color specimen which is one kind of printed matters by the measuring head constructed as described above, the
base plate 11 is first set so that a color specimen to be measured may be exposed from thehole 13. Normally, themovable body 20 is rotated about the point A by means of a compressive force of aspring coil 45 from the position shown in FIG. 2 in a direction as indicated by arrow B whereby theobjective ring 29 is raised from thebase plate 11. From said position, themovable body 20 is depressed and then the lower surface of theobjective ring 29 comes into contact with the color specimen to intercept external light, at which time thelimit switch 21 is depressed by theprojection 17 and turned on whereby measuring starts. The light of thelight source 25 illuminates only the color specimen exposed from thehole 30 and the reflecting light is reflected by the reflectingplate 28. The light passes through thefilters 31, reaches thelight receiving surface 24 of the photo-multiplier 23 and is converted into an electrical signal corresponding to the intensity of light. After measuring has been terminated with respect to onefilter 311, a central processing unit (CPU) provides a filter changing signal, and themotor 39 is rotated in accordance with the aforesaid signal. When the hole of thedisc 42 is detected by the light projecting and receivingelement 43, the rotation of themotor 39 stops whereby thegear 33 is rotated by 1/4 and thenext filter 312 assumes a position immediately before thelight receiving surface 24 for accomplishment of measurement again in a manner similar to that described previously. Such an operation is repeatedly carried out till measurement of reflected light of the color specimen through all of.fourfilters - FIG. 4 is a block diagram for explaining the electric circuit of the apparatus shown in FIG. 4.
- The reflected light of the color chart or color specimen illuminated by the
light source 25 passes through theoptical filter 31, and only the light of specific color component is received by the photo-multiplier 23 and is converted into an electric signal corresponding to the magnitude of the amount of received light. Alog amplifier 105 is connected to the photo-multiplier 23, and in thelog amplifier 105, the electric signal is converted into color density. - It will be noted that as means for representing colors, chromaticity or the like represented by XYZ system or L*a*b* system can be used in place of the aforesaid color density, in which case, a different circuit construction becomes necessary. The color density signal is converted into digital data by an A-D converter and is inputted into
CPU 110 through data bus DB. - Connected to the
CPU 110 through the data bus DB are a micro-switch 21, amotor controller 107, a random access memory (RAM) 111, a read only memory (ROM) 112, a liquid crystal display (LCD)controller 103 and a key-board controller 104, which are present within thebody 100 or being provided on thebody 100. - The
motor controller 107 causes amotor 39 to rotate in accordance with a command from theCPU 110 and causes themotor 39 to stop upon receipt of a signal from a light projecting and receivingelement 43. - A liquid crystal display (LCD) 101 is controlled by the liquid
crystal display controller 103 and displays the results of operation made by theCPU 110. A key-board 102 is provided to give theCPU 110 date inputs such as data of half-tone do percent of the color chart or various commands. - A
reference numeral 150 designates an external device such as a scanner, which can also directly input into the scanner the half-tone dot percents of various color separations of the obtained color specimen for processing. - Data fed into the CPU or results operated by the CPU are stored in
RAM 111 orROM 112 through an address bus AB with an address to be stored ofRAM 111 orROM 112 assigned by theCPU 110. - A combination of color densities of the measured specimen, for example, is stored in
RAM 111, and programs for actuating, for example,CPU 110, a conversion table of color - half-tone dot percent or the like is stored inROM 112.. - Next, the method in accordance with the present invention which uses an apparatus as described above, will be explained. Various steps of this method are carried out by commands of the central processing unit (CPU) operated by programs.
- First, in accordance with the present invention, a table in which color densities of a color chart and half-tone dot percents are combined is prepared, and stored in memory means (ROM 112). In preparing this table, ink of colors, Y, M, C and Bk are used, and the half-tone dot percent of each color separation is varied in suitable spacing between 0% and 100%, 10% in this embodiment, and actual printing is carried out to prepare a color chart. As kinds of color charts resulting from variation in half-tone dot percents as described above, thore are 11 = 14,641 kinds of combinations.
- As shown in FIG. 5, a combination of color densities of a color chart is actually successively obtained by the measuring
head 10 through the R filter, G filter, B filter and amber filter (an ND filter can be used) (Step S1). Next, a combination of half-tone dot percents (which is already known since it is described on the color chart) of each color separation is inputted from the key-board 102 (Step S2). The combination of the color densities and the combination of half-tone dot percents are stored in paired relation into a predetermined address of ROM 112 (Step S3). Such processing is carried out for all the color charts (Step S4). As the result, within theROM 112 is prepared a conversion table of color density - half-tone dot percent showing the corresponding relation of color densities of color charts and half-tone dot percents of color separations as shown in FIG. 6. In accordance with the conversion table of color density - half-tone dot percent shown in FIG. 6, fromnumber 1 tonumber 11, color separations of M, Y and Bk are 0% in half-tone dot percent and only the C is varied at intervals of 10% between 0% and 100%. Fromnumber 12 tonumber 22, color separations of Y and Bk are 0% in half-tone dot percent, the M is 10% in half-tone dot percent, and only the C is varied at intervals of 10% between 0% and 100%. And, color separation of Y, M, C and Bk are varied in half-tone dot percent at intervals of 10%. It will be understood that printing is carried out in the mode as just described to obtain a combination of color densities through the R filter, G filter, B filter and amber filter corresponding to each of color chart. - It is noted that the measurement of color density through the amber filter need not always be performed but the measurement can be performed by three filters, R filter, G filter and B filter to make a conversion table of color density - hald tone dot percent having three kinds of color densities.
- Also, a means for storing the conversion table of color density - half-tone dot percent is not limited to ROM used in this embodiment but a magnetic disc, a floppy disc or the like can be used.
- After the conversion table of color density - half-tone dot percent has been prepared, the half-tone dot percent of color separations (Y, M, C and Bk) of color specimens are obtained, according to the step shown in Fig. 7.
- First, a color specimen is put under the
base plate 12 of the measuringhead 10, and color densities of the color specimen are measured through the R filter, G filter, B filter and amber filter in accordance with the aforementioned measuring operation. The filter used for this measurement and the filter used when the conversion table of color density - half-tone dot percent has to be one and the same. Each color density is inputted into the CPU (Step S5), and correction calculation is performed with respect to the value thereof (Step S6). - The correction calculation is performed for the following reason.
- That is, there sometimes occurs a case where a paper for a color chart used to prepare the conversion table of color density - half-tone dot percent is different in kind from a paper actually used to effect printing in a printing factory. There also sometimes occurs a case where a tone reproducing curve and a
dot 100% density value which are standardized when a color chart is printed to prepare a conversion table of color density - half-tone dot percent are different from those which are standardized in the printing factory in the event that printing is actually performed in the printing factory. In such cases, the conditions when a color chart is printed to prepare a conversion table of color density - half-tone dot percent are different from those when printing is actually performed. In this connection, the correction calculation is performed in an attempt of removing a bad influence resulting from the difference between both the conditions so as to obtain a proper half-tone dot percent. - One example of the correction calculation will be described with reference to FIG. 8. FIG. 8 is a graphic representation for explaining the relation between the color density and the half-tone dot percent, the axis of ordinate being the color density while the axis of abscissa being the half-tone dot percent. While in the following explanation, a description will be made on the assumption that these are in the linear relation, it will be appreciated that, in even curves, a similar way of thinking can be applied to effect correction.
- In FIG. 8, it is assumed that color density Xc is obtained by measuring a color chart wherein only the C separation is 100% and all the others are 0% when a conversion table of color density - half-tone dot percent is prepared, through the R filter which is in the relation of complementary color of the C, separation, and color density Nc is obtained through the R filter of a color chart in which all separations are 0%, that is, a portion in which no ink is applied to a paper of the colur chart. Further, a paper to be printed actually is printed beforehand by use of the
dot 100% C separation with the density which is determined as thestandard dot 100% density in the printing factory. It is assumed that color density Xc' is one obtained by measuring thedot 100% density of the C separation applied to the paper to be printed actually by the aforementioned measuringhead 10 through the R filter, and color density Nc' is one obtained by measuring the paper, which is not printed, through the R filter in a similar manner. In Fig. 8, the straight lines (a) and (b) respectively indicate the relation between the color density and the half-tone dot percent when a conversion table of color density - half-tone dot percent is prepared and when actual printing is performed, respectively. In this case, if Dc' is the color density obtained through the R filter, when a half-tone dot percent is obtained without making any correction, the half-tone dot percent Q' is to be obtained, which is however different from the half-tone dot percent Q which has to be obtained actually. Thus, the color density value of the color specimen will be corrected in the following manner in order to correct an error at that case. That is, where Dc represents the color density after the value of the color density Dc' obtained by measuring the color specimen through the R filter has been corrected, the color density of the color specimen obtained by the following equation through the R filter is corrected:
Y separation 100% and only theBk separation 100%, the color densities are obtained beforehand through the G filter, B filter and amber filter, respectively and further the color density of the paper itself is obtained before the G filter, B filter and amber filter. The color specimen is corrected using these color density data with respect to the color densities obtained through the G filter, B filter and amber filter, and the thus corrected color densities DC, DM, Dy and DBk are used for comparison with the color densities in the conversion table of color density - half-tone dot percent. - While the above-described example of correction, the color density of the paper used for actual printing and color densities of the
dot 100% printing portion of each color ink have been actually measured to obtain correcting data, where these data are pre-obtained, such data can be inputted by the key-board or the like. - Moreover, as another method of correction, where a means is employed in which a light area and a shadow area can be adjusted independently for every filter, R, G, B and amber, as a means for measuring color densities, the following method can be taken. That is, for the light area, a portion not printed on a paper to be printed actually is measured, and densities are adjusted through filters, R, G, B and amber so that C, M, Y and Bk of the conversion table of color density - half-tone dot percent are respectively 0% color density (which is the case of
number 1 in FIG. 6). For the shadow area, papers C,M, Y and Bk to be printed which are printed with thedot 100% density to be standardized for each color ink are prepared. A portion of thedot 100% density of C ink is measured through the R filter, and the color density of the shadow area is adjusted so as to have the color density of R filter where the C of the conversion table of color density - half-tone dot percent is 100% (which is the case ofnumber 11 in FIG. 6). Similarly, M ink, Y ink and Bk ink are also measured through the G filter, B filter, and amber filter so as to have color densities of the G filter, B filter and amber filter where color separations of Y, M and Bk of the conversion table of color density - half-tone dot percent. After such adjustment has been made, the actual color specimen is measured to obtain a combination of half-tone dot percent. - The thus corrected color density of the color specimen is compared with the color densities of the conversion table of color density - half-tone dot percent. That is, color density data are read from
number 1 thereof intoCPU 110 from the conversion table of color density - half-tone dot percent which is being stored in ROM shown in FIG. 6 (Step S7), and the distance calculation relative to each color density of color specimen is performed (Stp S8). - The distance calculation is performed in the following, if an equation is used.
- Let DR, DG, DB and DA be the densities obtained through the R filter, G filter, B filter and amber filter, respectively, of the color specimen, and let TR(n), TG(n), TB(n) and TA(n) be the color densities through the R filter, G filter, B filter and amber filter, respectively, in the nth number of the conversion table of color density - half-tone dot percent. The distance S A (n) between both the elements may be obtained by the equation:

- Since the distance SA(1) between the color density of color specimen and the 1st color density in the table is so far subjected to distance calculation, it is the minimum in Step S9, and so said number and the calculated distance are stored in a predetermined address of RAM (Step S10). The value is judged if it is 0 or not with respect to the distance (Step S11). If it is 0, the distance calculation with respect to the other color density stops at that time and the half-tone dot percent corresponding to that number calls up from the coversion table of color density - half-tone dot percent (Step S13). If the distance is not O, a combination of the 2nd color density is read from the conversion table of color density - half-tone dot percent and similar distance calculation is performed to obtain the distance with respect to the color density of cilor specimen, after which that distance is compared with the 1st distance being stored in RAM 111 (Step S9); and number of smaller distance and the distance are stored (Step S10).
- In this manner, unless the distance is 0, the color density of color specimen is subjected to distance calculation with respect to all combinations of color densities of the conversion table of color density - half-tone dot percent to thereby obtain combination- number of color density of the smallest distance. Next, a combination of half-tone dot percents corresponding to that number is extracted from the'conversion table of color density - half-tone dot percent to thereby obtain the half-tone dot percents of color separations of Y, M, C and Bk of the measured color specimen.
- Incidentally, the accuracy of the half-tone dot percent obtained in a manner as described above depends on with what accuracy the half-tone dot percent in the conversion table of color density - half-tone dot percent is prepared. Since in the example shown in FIG. 6, the half-tone dot percent is prepared so that it is varied at intervals of 10%, the accuracy is up to 10%.
- Accordingly, where the half-tone dot percent of higher accuracy is required, a conversion table of color density - half-tone dot percent of accuracy required can be prepared but if so prepared, there arises disadvantages that data of the conversion table of color density - half-tone dot percent becomes extremely increased, that it takes much time to prepare such data, and that a memory having a large memory capacity is not only required but it also takes time for comparison with the measured data of color specimen.
- Thus, in accordance with the present invention, the following method to which a new processing procedure is further added in addition to the first-mentioned method to obtain a half-tone dot percent of higher accuracy.
- FIG. 9 shows a flow chart showing the aforesaid processing procedure. Since Steps of S14 to S21 can be executed exactly in the same manner as that of Steps of S5 to S12 in FIG. 7, further explanation will not be made. Also in the event the distance is 0, the half-tone dot percent of that number can be extracted from the table to complete processing in a similar manner. It is noted that a conversion table of color density - half-tone dot percent similar to that shown in.FIG. 6 may be used.
- As shown in FIG. 9, where the distance between a combination of color densities of color specimen and a combination of color densities of the conversion table of color density - half-tone dot percent was not 0, the color density of number wherein said distance is the smallest and the half-tone dot percent are read into
CPU 110 from the conversion table of color density - half-tone dot percent (Step S22), and the interpolation calculation is performed (Step S23) whereby a half-tone dot percent which is smaller between the densities, in other words, is more approximate, may be obtained. - One example of interplation calculation will be described.
- Let t(TR, T , TB, T ) be the combination of the aforesaid read color densities, P(c, m, y, bk) be the combination of half-tone dot percent, and d(R , D , DB, D ) be the combination of color densities of color specimen. In this example, the half-tone dot percent is obtained in accuracy up to 1%.
- Since in the conversion table of color density - half-tone dot percent stored in
ROM 112, the half-tone dot percent is varied at intervals of 10%, a half-tone dot percent to be obtained is present away large and small by a half of 10%, namely, 5% of the half-tone dot percent of each color separation around P. - While in the following description, a description will be made while limiting a combination of half-tone dot percent to three colors, C, M and Y except Bk for the sake of simplicity of explanation, it should be noted that the interpolation processing can be accomplished exactly in the same manner even the case which does not exclude Bk.
- FIG. 10 represents points wherein color separations of C, M and Y are deviated (+) 5% around P (c, m, y), in the C, M, Y coordinate system, each showing points of A(c+5, m-5, y+5), B(c+5, m+5, y+5), C(c+5, m+5, y-5), D(C+5, m-5, y-5), E(C-5, m-5, y+5), F(c-5, m+5, y+5), G(c-5, m+5, y-5) and H(c-5, m-5, y-5). The half-tone dot percent to be obtained is present in a color space with these points as apexes.
- Thus, the color space is divided as shown in FIG. 10 for every necessary accuracy (1% in this case), a combination of color densities are obtained for every combination of half-tone dot percent shown by each grid point, and a point wherein the distance is the smallest is selected by the aforementioned formula used to obtain the distance of the color density whereby a combination of half-tone dot percents at that point can be determined as a combination of half-tone dot percents with accuracy increased.
- However, the half-tone dot percents of the aforesaid points A, B, C, D, E, F, G and H have been known as previously mentioned but color densities corresponding thereto are not known.
- Then, a combination of color densities of points A'(c+10), m-10, y+10), B'(c+10, m+10, y+10), C'(c+10, m+10, y-10), D'(c+10, m-10, y-10), E'(c-10, m-10, y+10), F'(c-10, m+10, y+10), G'(c-10, m+10, y-10) and H'(c-10, m-10, y-10), which are away from P every 10%, as shown in FIG. 11, and middle points I(c, m-10, y+10), J(c, m+10, y+10), E(c, m+10, y-10), L(c, m-10, y-10), M(c+10, m, y+10), N(c+10, m+10, y), 0(c+10, m, y-10), Q(c+10, m-10, y), R(c, m, y+10), S(c, m+10, y), T(c, m, y-10), U(c, m-10, y), V(c-10, m, y+10), W(c-10, m+10, Y), X(c-10, m, y-10), Y(c-10, m-10, y), Z(c+10, m, y) and ZZ(c-10, m, y) can be known from the conversion table of color density - half-tone dot percent, and therefore, values of color densities of these points and a color density of point P are used to obtain a combination of color densities of the points A, B, C, D, E, F, G and H by interpolation calculation.
- FIG. 11 shows positions of the
points 10% away from the point P in the C, M, Y coordinate system which represents the half-tone dot percent. - First, a method for obtaining a combination of color densities at point A(c+5, m-5, y+5) will be first explained. The point A is at a position of the center of the color space composed of points A'(c+10, m-10, y+10), M(c+10, m, y+10), Z(c+10, m, y), Q(c+10, m-10, y), I(c, m-10, y+10), R(c, m, y+10), P(c, m, y) and U(c, m-10, y) in FIG. 11. Thus, an average every color density component of the points A', M, Z, Q, I, R, P and U is obtained, and that value is used as the color density component of the point A, that is, as the combination of color density of the point A.
- Where the conversion table of color density - half-tone dot percent is not prepared by the equidistant half-tone dot percent, a color space composed of the points A', M, Z, Q, I, R, P and U is sometimes not a cubic body but a rectangular hexahedron, in which case, the distance of the point A from each of apexes of the rectangular hexahedron is different, and therefore, a proportional formula or proper functions can be used according to the distance from each apex.
- Also, with respect to other points B, C, D, E, F, G and H, a combination of color densities therefor is calculated in a similar manner.
- With respect to all of the points A, B, C, D, E, F, G and H, combinations of color densities therefor have been obtained as described above. Next, the values of color densities at these points are used, and a combination of color densities at each grid point wherein a cubic body as shown in FIG. 10 is partitioned for every necessary intervals is obtained in a suitable method such as proportional distribution in a manner similar to that as previously mentioned. Then, the distance S between the combination of color densities of the respective grid points thus obtained and a combination d (DR, DG, DB) of color densities of color specimen is obtained by the aforementioned formula of the distance calculation to select a grid point wherein the distance S is the smallest. Since the thus selected grid point has been already known in a combination of half-tone dot percents thereof, a combination of half-tone dot percents can be used as a combination of half-tone dot percents necessary for reproducing color assigned by color specimen to thereby obtain the measured result of higher accuracy than that obtained by the aforementioned method.
- It is noted that with respect to all areas of the points A, B, C, D, E, F, G and H as shown in FIG. 10, to obtain combinations of color densities of all grid points having necessary accuracy requires much time since the number of grid points increases. Then, eight small color spaces wherein lines connecting the point P with respective apexes in FIG. 10 are diagonal lines are taken into consideration. In this way, a combination of color densities to be obtained is included in one of these small color spaces. Where the combination is included is judged and determined if the combination d (DR, DG' D ) of color densities of color specimen is closest to the combination at what point among the combinations of color densities of the apexes A - H.
- Once the small color space has been determined as described above, a combination of color densities of each grid point partitioned for every necessary accuracy with respect to only the small color space is obtained by interpolation, and a grid point closest to the combination d (DR, DG D B) of color densities of color specimen can be selected out of the combination of color densities of the grid points in said small color space. If this procedure is used, calculation time can be shortened about the eighth.
- FIG. 12 illustrates another interpolation method. In axes R, G and B, color densities obtained through the R, G and B filters, respectively, are represented with a combination t (TR, TG, TB) of color densities wherein the distance relative to the color specimen is the smallest. Character d represents the point showing a combination (DR, DG, DB) of color densities of color specimen.
- Here, when a vector


- Also, a combination of P3 (c+10, m+10, y+10) of half-tone dot percents each deviated by one unit (that is, 10% in case of FIG. 6) relative to a combination P (c, m, y) of half-tone dot percents corresponding to the combination t of color densities is set, and a combination t 3 (TR3' TG3' T B3) of color densities corresponding thereto can be known from the conversion table of color densities - half-tone dot percent.
- To take plus or minus of the half-tone dot percent P3 (c +10, m+10, Y+10) is determined if each component of the vector Btd BR, G BB) is above zero or below zero. If it is above zero, plus is used whereas if it is below zero, minus is used. In this case, symbols employed with respect to c+10, m+10, y+10, respectively, are determined by the respective symbols of BR, BG and BB.
- When a vector


- While for the simplicity's sake, a description will be made assuming that each component of vector Btd is larger than zero, it will be noted that a similar procedure can be used even other cases.
- Let P1(c+10, m, y) and P2(c+10, m+10, y) be the combinations of half-tone dot percent for the cases where component c is large by 10% and component m is large by 10%, respectively, relative to the combination P (c, m, y) of half-tone dot percent.
- The combinations of color densities corresponding to the combinations P1, P2 of half-tone dot percent may be known as t1(TR1, TG1, T Bl) and t2(TR2, T G2, TB2), respectively, from the conversion table of color density - half-tone dot percent.
- Accordingly, the vector


- Thus, the vector Btd is represented as


- Thus, a combination P' (c', m', y') of half-tone dot percents, wherein a combination P (c, m, y) of half-tone dot percents corresponding to t is interpolated relative to a combination of color densities selected as one which is the closest to the combination d (DR, DG, D ) of color densities of color specimen, is as follows: B


- In the manner as described above, the combination P'(c', m', y') of half-tone dot percents after interpolation is determined.
- It is noted that as a method for representing the vector

- However, to obtain the reasonable interpolation value, it is preferable that a vector is selected so that a vector obtained by connecting a combination of color densities obtained from the conversion table of color density - half-tone dot percent, as shown in FIG. 12, reaches a combination t of color densities.
- If such a vector procedure is employed, processing time required for interpolation for obtaining a combination of half-tone dot percents of high accuracy as described above may be extremely shortened.
- As previously mentioned in the description of prior art, where a color specified by the color specimen is a specially prepared color, there are some colors that may not be reproduced by color-printing using process ink. To what extent color is not produced can be grasped quantitatively by the\extention of the above-described method and therefore it is convenient. This method will be described hereinafter.
- It is assumed that a conversion table of color density - half-tone dot percent is prepared as shown in FIG. 6 by the processing procedure shown in FIG. 5.
- FIG. 13 shows the processing procedure of this method. In this method, Steps S25 to S32 are similar to Steps S5 to S12 shown in FIG. 7, and therefore, explanation thereof will be omitted.
- In Step S34, a combination t(T , T G, T B, TA) of color densities of number (in which distance is 0 or smallest) most approximate to a combination d (DR, DG, DB, DA) of color densities of color specimen and a combination P (c, m, y, bk) of half-tone dot percents are read into
CPU 110. - While in the following description, a description will'be made while limiting a combination of half-tone dot percent to three colors, C, M and Y except Bk for the sake of simplicity of explanation, it should be noted that the interpolation precessing can be accomplished exactly in the same manner even the case which does not exclude Bk.
- Where individual half-tone dot percents c, m and y of a combination of half-tone dot percents having color density most approximate to the color density of color specimen are all present between 10 and 90%, they are present in a portion wherein the half-tone dot percent is deviated large and small by 5% around P, that is, in a color space (FIG. 10) in accordance with the conception similar to that as already described. Thus, a color space surrounded by points A, B, C, D, E, F, G and H away by + 5% from P as shown in FIG. 10 is divided for every necessary accuracy. Color densities of grid points are obtained by interpolation, in a manner similar to that as described above, a combination of color densities thus interpolated is used to select a point where the distance is the smallest in the above-described formula of distance calculation, and the value of P is corrected by the value of said point to obtain a combination of half-tone dot percents which is satisfied with necessary accuracy.
- Where at least more than one color out of half-tone dot percents of the retrieved and selected point P are 0% or 100%, there is a possibility that a point showing the actual color is not present in the color space but present outside the color space. Thus, it becomes necessary to consider a color space jumped outside to obtain, for example, a point of -10% or 110%. Briefly, the color density of a point of -10% may be obtained at the same proportion as variation from 10% to 0%, and likewise, the color density of a point of 110% may be obtained at the proportion of variation from 90% to 100%. For example, in the density value of a combination (-10, 100, 0) of half-tone dot percent, variation in density is (-0.09, -0.04, -0.07) from the density value (0.26, 1.39, 0.78) of a combination (10, 100, 0) of half-tone dot percents and the density value (0.17, 1.35, 0.71) of a combination (0, 100, 0) of half-tone dot percents. Thus, the density of the combination (-10, 100, 0) of half-tone dot percents to be obtained is (0.08, 1.31, 0.64) wherein the density value of the combination (0, 100, 0) of half-tone dot percents is varied at the proportion of that variation. Similarly, also in the point of 100%, the density of the point of 110% can be varied at the proportion in increase from 90% to 100%. While in the above-described embodiment, only variations from 10 to 0% or 90 to 100% have been obtained, it should be noted that functions are obtained at several point within the color space, for example, three points, 20, 10 and 0% to obtain the density of the point of -10%.
- Furthermore, while in this description, a description has been made for the case where the half-tone dot percent of less than 0% or more than 100% is produced at intervals of 10%, it should be noted that it can be produced at other intervals, for example, at the
intervals 5%. - A model view of thus obtained expanded color space is shown in FIG. 14. In such a color space, which is divided for every necessary accuracy, a point where the distance is the smallest is selected by the aforementioned formula for obtaining the distance between a point indicated at each grid point and the measured value, and the half-tone dot percent of P can be interpolated by the value of the selected point (Steps S37, S38, S42 and S43).
- With respect to colors that may be reproduced with predetermined ink, a combination of half-tone dot percents after interpolation is in a color space, that is, the half-tone dot percent of each color has to be between 0 and 100%. Even 1% is outside the color space unless an error such as an measured error of color density is present, it will be a color that may not be reproduced with predetermined ink. However, if a density value is employed as color information, the measuring accuracy is approximately + 0.02 in density value. When the density value is varied through 0.02 on the side where color is light, the half-tone dot percent varies by about 3%.
- Thus, as shown in Steps S39 and S40, even if the combination of half-tone dot percents after correction has the value outside the color space by about 3%, color can be judged to be a reproducible color. However, if there is a difference more than that,as described, it can not be disregarded and color cannot be reproduced. The smaller than 0% or the larger than 100%, the combination is moved away from the color space, as a consequence of which the fact that it is hard to reproduce it as color can be quantitatively shown.
- Depending on whether or not the range.controlled by the conversion table of color density - half-tone dot percent, that is, the combination of half-tone dot percents corrected in the aforementioned color space is present, the propriety of color reproduction of the color specimen by the predetermined ink can be discriminated by displaying the obtained half-tone dot percent (Steps S41 and S44).
- It is noted that in the above-described methods, mere consideration has been taken in that the smallest half-tone dot percent is -10% and the largest is up to 110%. If the half-tone dot percent is limited to values from -10% to 110%, the measured color might be one far from that may not present in the expanded color space,
- In this case, to what extent color is far from can be discriminated in the following.
- As described above, even if at least more than one color out of the half-tone dot percents of the retrieved and selected point P are 0% or 100%, a color space wherein the half-tone dot percent is deviated large and small by 10% around P is obtained, said color space being devided for every accuracy, a point where the distance is the smallest is selected by the aforementioned formula for obtaining the distance between the point shown by each grid point and the measured value, and the value of P is interpolated by the value of the combination of half-tone dot percents of the selected point is interpolated to obtain a combination of half-tone dot percents which is satisfied with the necessary accuracy.
- If more than one color out of the combination of the obtained half-tone dot percents are -10% or 110%, there is a possibility that the measured value is not present in the expanded color space. Thus, this time, a further expanded color space is determined with the corrected point set to P, and correction is performed in a similar manner to that so far performed. This procedure is repeatedly performed until the corrected point does not any longer assume a half-tone dot percent in a boundary surface in a further expanded color space to thereby obtain an accurate half-tone dot percent. The extent to what extent the half-tone dot percent after correction thus obtained is smaller or larger than 0% or 100% shows an amount distant from a color space that may be reproduced by predetermined ink, that is, a color space in the stage not expanded. This represents the extent that may not be reproduced.
- It is noted that even in the above-described processing, the half-tone dot percent can be obtained by the already described vector procedure.
- A combination of half-tone dot percents obtained by measuring the color specimen as described above can be also displayed on the
liquid crystal display 101 or be inputted into theexternal device 150 such as a scanner to directly place it at reproduction work. - While in the above-described explanation, a description has been made of the case where color density was used as color information, it should be noted that even if chromaticity is used, the half-tone dot percent can be obtained in a similar way of thinking.
- As described above, in the present invention, where a color assigned by a color specimen is reproduced by gathering-printing of ink of colors, for example, Y, M, C and Bk, the color specimen can be measured to accurately obtain a half-tone dot percent of each color separation.
- In addition, even if a color assigned by a color specimen is not mono-color such as a secondary color or a trichromatic color, a half-tone dot percent of each color separation which is necessary for reproduction of such color may be obtained.
- Moreover, even if a color assigned by a color specimen is a color which is difficult to reproduce by the gathering-printing using ink of colors, for example, Y, M, C and Bk, a half-tone dot percent of color separation of color most approximate to such color may be of course obtained, and in addition, the conception of the half-tone dot percent can be expanded to know to what extent reproduction is difficult.
Claims (30)
Applications Claiming Priority (2)
| Application Number | Priority Date | Filing Date | Title |
|---|---|---|---|
| JP58081561A JPS59206839A (en) | 1983-05-10 | 1983-05-10 | Device for inputting dot area per cent |
| JP81561/83 | 1983-05-10 |
Publications (3)
| Publication Number | Publication Date |
|---|---|
| EP0124908A2 true EP0124908A2 (en) | 1984-11-14 |
| EP0124908A3 EP0124908A3 (en) | 1986-11-26 |
| EP0124908B1 EP0124908B1 (en) | 1991-09-18 |
Family
ID=13749698
Family Applications (1)
| Application Number | Title | Priority Date | Filing Date |
|---|---|---|---|
| EP84105255A Expired EP0124908B1 (en) | 1983-05-10 | 1984-05-09 | Method of obtaining half-tone dot percents necessary for reproducing colors |
Country Status (4)
| Country | Link |
|---|---|
| US (1) | US4717954A (en) |
| EP (1) | EP0124908B1 (en) |
| JP (1) | JPS59206839A (en) |
| DE (1) | DE3485069D1 (en) |
Cited By (4)
| Publication number | Priority date | Publication date | Assignee | Title |
|---|---|---|---|---|
| EP0321402A1 (en) * | 1987-12-16 | 1989-06-21 | GRETAG Aktiengesellschaft | Method of controlling or regulating the ink supply in a printing press |
| US4852485A (en) * | 1985-03-21 | 1989-08-01 | Felix Brunner | Method of operating an autotypical color offset printing machine |
| DE4402784A1 (en) * | 1994-01-31 | 1995-10-12 | Wifag Maschf | Quality data acquisition in web offset production |
| US9346259B2 (en) | 2010-02-08 | 2016-05-24 | Heidelberger Druckmaschinen Ag | Ink control method for printing presses having short inking units |
Families Citing this family (58)
| Publication number | Priority date | Publication date | Assignee | Title |
|---|---|---|---|---|
| US4839721A (en) * | 1984-08-28 | 1989-06-13 | Polaroid Corporation | Method of and apparatus for transforming color image data on the basis of an isotropic and uniform colorimetric space |
| DE3539540A1 (en) * | 1984-11-08 | 1986-05-22 | Canon K.K., Tokio/Tokyo | Colour image treatment method |
| US5182721A (en) * | 1985-12-10 | 1993-01-26 | Heidelberger Druckmaschinen Aktiengesellschaft | Process and apparatus for controlling the inking process in a printing machine |
| GB8601176D0 (en) * | 1986-01-17 | 1986-02-19 | Infrared Eng Ltd | Sensing |
| DE3626423A1 (en) * | 1986-08-05 | 1988-02-11 | Deutsche Forsch Druck Reprod | METHOD AND DEVICE FOR INFLUENCING THE COLOR APPEARANCE OF A COLOR AREA IN A PRINTING PROCESS |
| JPS63191041A (en) * | 1987-02-03 | 1988-08-08 | Komori Printing Mach Co Ltd | Density measurement positioning method |
| JPS63228882A (en) * | 1987-03-17 | 1988-09-22 | Minolta Camera Co Ltd | Image signal processing system |
| US4947348A (en) * | 1987-03-25 | 1990-08-07 | Kollmorgen Corporation | Densitometer method and system for identifying and analyzing printed targets |
| US5194945A (en) * | 1987-08-11 | 1993-03-16 | Canon Kabushiki Kaisha | Color image processing apparatus |
| US5181014A (en) * | 1987-10-26 | 1993-01-19 | Tektronix, Inc. | Method and apparatus for representing three-dimensional color data in a one-dimensional reference system |
| US4839722A (en) * | 1987-10-30 | 1989-06-13 | Colorocs Corporation | Method and apparatus for providing improved color correction in a subtrative color printing system |
| US5335095A (en) * | 1987-12-16 | 1994-08-02 | Minolta Camera Kabushiki Kaisha | Image forming apparatus capable of editing color image |
| US4975862A (en) * | 1988-01-14 | 1990-12-04 | Gretag Aktiengesellschaft | Process and apparatus for the ink control of a printing machine |
| US5081528A (en) * | 1988-03-10 | 1992-01-14 | Canon Kabushiki Kaisha | Image forming apparatus |
| US5081527A (en) * | 1988-04-12 | 1992-01-14 | Minolta Camera Kabushiki Kaisha | Digital image forming apparatus |
| US4959790A (en) * | 1988-06-28 | 1990-09-25 | F & S Corporation Of Columbus, Georgia | Apparatus and method for producing color corrected reproduction of colored original images |
| EP0359869A1 (en) * | 1988-08-23 | 1990-03-28 | Agfa-Gevaert N.V. | Method for colour correction by dry dot etching using photographically produced mask |
| US4918622A (en) * | 1988-11-16 | 1990-04-17 | Eastman Kodak Company | Electronic graphic arts screener |
| US4916545A (en) * | 1988-11-16 | 1990-04-10 | Eastman Kodak Company | Electronic graphic arts screener that suppresses Moire patterns using pseudo-random font selection |
| US4977458A (en) * | 1988-11-16 | 1990-12-11 | Eastman Kodak Company | Apparatus for addressing a font to suppress Moire patterns occurring thereby and a method for use therein |
| US5121196A (en) * | 1988-11-18 | 1992-06-09 | Konica Corporation | Color processing method and apparatus with a color patch |
| US5130701A (en) * | 1989-05-12 | 1992-07-14 | The United States Of America As Represented By The United States Department Of Energy | Digital color representation |
| US5274473A (en) * | 1989-08-04 | 1993-12-28 | Intergraph Corporation | Rapid variable angle digital screening |
| DE69125519D1 (en) * | 1990-02-05 | 1997-05-15 | Scitex Corp Ltd | Devices and methods for processing data, such as color images |
| US5339176A (en) * | 1990-02-05 | 1994-08-16 | Scitex Corporation Ltd. | Apparatus and method for color calibration |
| JPH0775392B2 (en) * | 1990-06-19 | 1995-08-09 | 富士ゼロックス株式会社 | Image processing device |
| JP2855008B2 (en) * | 1990-10-03 | 1999-02-10 | 富士写真フイルム株式会社 | Image processing method and apparatus |
| US5174758A (en) * | 1990-12-11 | 1992-12-29 | Abramson Steven J | Color selector for four-color offset printing, and method of creating it |
| US5272518A (en) * | 1990-12-17 | 1993-12-21 | Hewlett-Packard Company | Colorimeter and calibration system |
| IL98622A (en) * | 1991-06-25 | 1996-10-31 | Scitex Corp Ltd | Method and apparatus for employing neural networks in color image processing |
| US5315380A (en) * | 1991-08-23 | 1994-05-24 | Iris Graphics Inc. | Apparatus and method for transforming the digital representation of a color input image |
| US5251271A (en) * | 1991-10-21 | 1993-10-05 | R. R. Donnelley & Sons Co. | Method for automatic registration of digitized multi-plane images |
| US5481655A (en) * | 1992-09-18 | 1996-01-02 | Iris Graphics, Inc. | System for matching a picture on a monitor to a printed picture |
| US5748195A (en) * | 1992-10-29 | 1998-05-05 | International Business Machines Corporation | Method and means for evaluating a tetrahedral linear interpolation function |
| US5432892A (en) * | 1992-11-25 | 1995-07-11 | International Business Machines Corporation | Volummetric linear interpolation |
| US5390035A (en) * | 1992-12-23 | 1995-02-14 | International Business Machines Corporation | Method and means for tetrahedron/octahedron packing and tetrahedron extraction for function approximation |
| US5751926A (en) * | 1992-12-23 | 1998-05-12 | International Business Machines Corporation | Function approximation using a centered cubic packing with tetragonal disphenoid extraction |
| US5357448A (en) * | 1993-02-02 | 1994-10-18 | Quad/Tech, Inc. | Method and apparatus for controlling the printing of an image having a plurality of printed colors |
| US5677967A (en) * | 1993-03-10 | 1997-10-14 | R. R. Donnelley & Sons Company | Method of and apparatus for converting between a color appearance space and a colorant space |
| US5666436A (en) * | 1993-10-14 | 1997-09-09 | Electronics For Imaging | Method and apparatus for transforming a source image to an output image |
| DE4431270C2 (en) * | 1993-10-21 | 1997-01-16 | Roland Man Druckmasch | Process for controlling the ink flow of an autotypically working printing machine |
| US6002498A (en) * | 1994-06-15 | 1999-12-14 | Konica Corporation | Image processing method and image forming method |
| US6301025B1 (en) | 1994-06-24 | 2001-10-09 | Mgi Software Corporation | Method for performing a color space transformation |
| DE19506425B4 (en) * | 1995-02-24 | 2004-11-18 | Heidelberger Druckmaschinen Ag | Offset printing process |
| US5852675A (en) * | 1995-04-14 | 1998-12-22 | Kiyoshi Matsuo | Color chart for image correction and method of color correction |
| US5781206A (en) * | 1995-05-01 | 1998-07-14 | Minnesota Mining And Manufacturing Company | Apparatus and method for recalibrating a multi-color imaging system |
| US6137494A (en) * | 1995-08-18 | 2000-10-24 | International Business Machines Corporation | Method and means for evaluating a tetrahedral linear interpolation function |
| US5748330A (en) * | 1997-05-05 | 1998-05-05 | Xerox Corporation | Method of calibrating a digital printer using component test patches and the yule-nielsen equation |
| US5819655A (en) * | 1997-08-20 | 1998-10-13 | Bristol-Myers Squibb Company | Cyclinder color printing method and product using improved misregistration detection |
| US6801336B1 (en) * | 1999-08-30 | 2004-10-05 | Creo Inc. | System and method for producing halftoned color separations for an output imaging device |
| US7375857B1 (en) | 2000-09-22 | 2008-05-20 | Eastman Kodak Company | Print proofing with color and screen matching |
| JP2002142125A (en) * | 2000-10-31 | 2002-05-17 | Fuji Photo Film Co Ltd | Color chart, chart image data recording medium, profile creating device, method therefor and profile creating program storing medium |
| ATE432823T1 (en) * | 2001-03-02 | 2009-06-15 | Ackley Martinez Company Dba Mg | SYSTEM AND METHOD FOR ADJUSTING A PRINTING DEVICE |
| ATE399343T1 (en) | 2001-07-30 | 2008-07-15 | Ackley Martinez Company Dba Mg | COLOR MANAGEMENT PROCESS AND SYSTEM |
| CN1537055A (en) * | 2001-07-30 | 2004-10-13 | 阿克利・马丁内斯公司Dba Mgi工作 | Color management processing system and method |
| US6786565B2 (en) * | 2001-09-24 | 2004-09-07 | Creo Americas, Inc. | Inkjet proofing with matched color and screen resolution |
| US7605959B2 (en) | 2005-01-05 | 2009-10-20 | The Ackley Martinez Company | System and method of color image transformation |
| JP2007256251A (en) * | 2006-02-24 | 2007-10-04 | Hitachi High-Technologies Corp | Data collection processor |
Citations (4)
| Publication number | Priority date | Publication date | Assignee | Title |
|---|---|---|---|---|
| US3893166A (en) * | 1972-01-05 | 1975-07-01 | Crosfield Electronics Ltd | Colour correcting image reproducing methods and apparatus |
| US4060829A (en) * | 1975-08-20 | 1977-11-29 | Dainippon Screen Seizo Kabushiki-Kaisha | Method of color correction |
| GB2016238A (en) * | 1978-03-09 | 1979-09-19 | Hell Rudolf Dr Ing Gmbh | Facsimile reproduction of coloured pictures |
| US4194839A (en) * | 1976-06-23 | 1980-03-25 | Dr. Ing. Rudolf Hell Gmbh | Circuit arrangement for recognizing and adjusting color components |
Family Cites Families (14)
| Publication number | Priority date | Publication date | Assignee | Title |
|---|---|---|---|---|
| US3612753A (en) * | 1969-04-23 | 1971-10-12 | Ventures Res & Dev | Self-adaptive system for the reproduction of color |
| FR2054501B1 (en) * | 1969-07-18 | 1973-06-08 | Roussel Uclaf | |
| JPS4818230U (en) * | 1971-07-13 | 1973-03-01 | ||
| GB1527227A (en) * | 1974-12-18 | 1978-10-04 | Crosfield Electronics Ltd | Reproduction of coloured images |
| DE2526409C3 (en) * | 1975-06-13 | 1979-08-09 | Dr.-Ing. Rudolf Hell Gmbh, 2300 Kiel | Method for calibrating a recording unit producing a photomechanical printing form |
| US4275413A (en) * | 1978-03-30 | 1981-06-23 | Takashi Sakamoto | Linear interpolator for color correction |
| CH646788A5 (en) * | 1978-11-28 | 1984-12-14 | Hell Rudolf Dr Ing Gmbh | METHOD AND CIRCUIT FOR DETECTING COLORS. |
| DE3024459A1 (en) * | 1979-07-03 | 1981-01-08 | Crosfield Electronics Ltd | PYRAMID INTERPOLATION |
| JPS55109936A (en) * | 1980-01-07 | 1980-08-23 | Daihen Corp | Colorimetric display unit |
| US4477833A (en) * | 1981-08-12 | 1984-10-16 | R. R. Donnelley & Sons Company | Method of color conversion with improved interpolation |
| EP0096090B1 (en) * | 1982-06-04 | 1986-01-08 | DR.-ING. RUDOLF HELL GmbH | Process and device for the preparation of coloured proofs in multicolour printing |
| US4481532A (en) * | 1982-06-28 | 1984-11-06 | R. R. Donnelley & Sons Company | Method of determining and storing color printing information |
| JPS5935116A (en) * | 1982-08-24 | 1984-02-25 | Mitsubishi Rayon Co Ltd | Color sensor |
| GB8307290D0 (en) * | 1983-03-16 | 1983-04-20 | Phillips G L P | Colour printing process |
-
1983
- 1983-05-10 JP JP58081561A patent/JPS59206839A/en active Granted
-
1984
- 1984-05-08 US US06/608,230 patent/US4717954A/en not_active Expired - Fee Related
- 1984-05-09 EP EP84105255A patent/EP0124908B1/en not_active Expired
- 1984-05-09 DE DE8484105255T patent/DE3485069D1/en not_active Expired - Lifetime
Patent Citations (4)
| Publication number | Priority date | Publication date | Assignee | Title |
|---|---|---|---|---|
| US3893166A (en) * | 1972-01-05 | 1975-07-01 | Crosfield Electronics Ltd | Colour correcting image reproducing methods and apparatus |
| US4060829A (en) * | 1975-08-20 | 1977-11-29 | Dainippon Screen Seizo Kabushiki-Kaisha | Method of color correction |
| US4194839A (en) * | 1976-06-23 | 1980-03-25 | Dr. Ing. Rudolf Hell Gmbh | Circuit arrangement for recognizing and adjusting color components |
| GB2016238A (en) * | 1978-03-09 | 1979-09-19 | Hell Rudolf Dr Ing Gmbh | Facsimile reproduction of coloured pictures |
Cited By (5)
| Publication number | Priority date | Publication date | Assignee | Title |
|---|---|---|---|---|
| US4852485A (en) * | 1985-03-21 | 1989-08-01 | Felix Brunner | Method of operating an autotypical color offset printing machine |
| EP0321402A1 (en) * | 1987-12-16 | 1989-06-21 | GRETAG Aktiengesellschaft | Method of controlling or regulating the ink supply in a printing press |
| DE4402784A1 (en) * | 1994-01-31 | 1995-10-12 | Wifag Maschf | Quality data acquisition in web offset production |
| DE4402784C2 (en) * | 1994-01-31 | 2001-05-31 | Wifag Maschf | Measuring field group and method for quality data acquisition using the measuring field group |
| US9346259B2 (en) | 2010-02-08 | 2016-05-24 | Heidelberger Druckmaschinen Ag | Ink control method for printing presses having short inking units |
Also Published As
| Publication number | Publication date |
|---|---|
| US4717954A (en) | 1988-01-05 |
| EP0124908B1 (en) | 1991-09-18 |
| EP0124908A3 (en) | 1986-11-26 |
| JPH0522227B2 (en) | 1993-03-26 |
| JPS59206839A (en) | 1984-11-22 |
| DE3485069D1 (en) | 1991-10-24 |
Similar Documents
| Publication | Publication Date | Title |
|---|---|---|
| EP0124908A2 (en) | Method of obtaining half-tone dot percents necessary for reproducing colors | |
| US5181257A (en) | Method and apparatus for determining register differences from a multi-color printed image | |
| US4956703A (en) | Print simulation apparatus for adjusting the color separation conditions of a color scanner | |
| US4393399A (en) | Method and apparatus for partial electronic retouching of colors | |
| US4884130A (en) | Method of describing a color in a triaxial planar vector color space | |
| US4204223A (en) | Method and apparatus for making color corrections in the manufacture of printing plates | |
| US4414636A (en) | Color control simulator for a picture reproducing machine | |
| JP5547299B2 (en) | Multi primary color printing method | |
| EP0055939A1 (en) | Previewing apparatus of flats | |
| US6084693A (en) | Process and apparatus for the determination of halftone percentage values | |
| US5816151A (en) | Device for alignment of images in a control system for a printing press | |
| US5519515A (en) | Method of determining color signals for input signals at vertices in input color space | |
| US5297058A (en) | Method for creating multicolored halftone reproductions from continuous tone monochrome originals | |
| EP0573069B1 (en) | Method and apparatus for calibrating a colour scanner | |
| KR100362023B1 (en) | A method of manufacturing a reference model used for automatically checking print quality of an image on a papermaking | |
| JPH0449104B2 (en) | ||
| US4300158A (en) | Process control apparatus | |
| JPH068961B2 (en) | Halftone dot area ratio determination device | |
| EP0582421B1 (en) | Image processing apparatus | |
| JPH0526184B2 (en) | ||
| Maier et al. | Design criteria for an input colour scanner evaluation test object | |
| JPH0650391B2 (en) | Halftone dot area ratio determination device | |
| JPS60142206A (en) | Net point area rate determining device | |
| JPH0650390B2 (en) | Halftone dot area ratio determination device | |
| JPS6328423Y2 (en) |
Legal Events
| Date | Code | Title | Description |
|---|---|---|---|
| PUAI | Public reference made under article 153(3) epc to a published international application that has entered the european phase |
Free format text: ORIGINAL CODE: 0009012 |
|
| AK | Designated contracting states |
Designated state(s): DE FR GB |
|
| 17P | Request for examination filed |
Effective date: 19850423 |
|
| PUAL | Search report despatched |
Free format text: ORIGINAL CODE: 0009013 |
|
| AK | Designated contracting states |
Kind code of ref document: A3 Designated state(s): DE FR GB |
|
| 17Q | First examination report despatched |
Effective date: 19881104 |
|
| GRAA | (expected) grant |
Free format text: ORIGINAL CODE: 0009210 |
|
| AK | Designated contracting states |
Kind code of ref document: B1 Designated state(s): DE FR GB |
|
| REF | Corresponds to: |
Ref document number: 3485069 Country of ref document: DE Date of ref document: 19911024 |
|
| ET | Fr: translation filed | ||
| PLBE | No opposition filed within time limit |
Free format text: ORIGINAL CODE: 0009261 |
|
| STAA | Information on the status of an ep patent application or granted ep patent |
Free format text: STATUS: NO OPPOSITION FILED WITHIN TIME LIMIT |
|
| 26N | No opposition filed | ||
| PGFP | Annual fee paid to national office [announced via postgrant information from national office to epo] |
Ref country code: GB Payment date: 19930428 Year of fee payment: 10 |
|
| PGFP | Annual fee paid to national office [announced via postgrant information from national office to epo] |
Ref country code: FR Payment date: 19930510 Year of fee payment: 10 |
|
| PGFP | Annual fee paid to national office [announced via postgrant information from national office to epo] |
Ref country code: DE Payment date: 19930524 Year of fee payment: 10 |
|
| PG25 | Lapsed in a contracting state [announced via postgrant information from national office to epo] |
Ref country code: GB Effective date: 19940509 |
|
| GBPC | Gb: european patent ceased through non-payment of renewal fee |
Effective date: 19940509 |
|
| PG25 | Lapsed in a contracting state [announced via postgrant information from national office to epo] |
Ref country code: FR Effective date: 19950131 |
|
| PG25 | Lapsed in a contracting state [announced via postgrant information from national office to epo] |
Ref country code: DE Effective date: 19950201 |
|
| REG | Reference to a national code |
Ref country code: FR Ref legal event code: ST |