EP0067514A1 - Method and apparatus for X-ray fluorescence spectroscopy - Google Patents
Method and apparatus for X-ray fluorescence spectroscopy Download PDFInfo
- Publication number
- EP0067514A1 EP0067514A1 EP82302241A EP82302241A EP0067514A1 EP 0067514 A1 EP0067514 A1 EP 0067514A1 EP 82302241 A EP82302241 A EP 82302241A EP 82302241 A EP82302241 A EP 82302241A EP 0067514 A1 EP0067514 A1 EP 0067514A1
- Authority
- EP
- European Patent Office
- Prior art keywords
- detector
- range
- concentration
- energies
- ray
- Prior art date
- Legal status (The legal status is an assumption and is not a legal conclusion. Google has not performed a legal analysis and makes no representation as to the accuracy of the status listed.)
- Granted
Links
Images


Classifications
-
- G—PHYSICS
- G01—MEASURING; TESTING
- G01V—GEOPHYSICS; GRAVITATIONAL MEASUREMENTS; DETECTING MASSES OR OBJECTS; TAGS
- G01V5/00—Prospecting or detecting by the use of nuclear radiation, e.g. of natural or induced radioactivity
- G01V5/04—Prospecting or detecting by the use of nuclear radiation, e.g. of natural or induced radioactivity specially adapted for well-logging
- G01V5/08—Prospecting or detecting by the use of nuclear radiation, e.g. of natural or induced radioactivity specially adapted for well-logging using primary nuclear radiation sources or X-rays
- G01V5/12—Prospecting or detecting by the use of nuclear radiation, e.g. of natural or induced radioactivity specially adapted for well-logging using primary nuclear radiation sources or X-rays using gamma or X-ray sources
Definitions
- This relates to a method and apparatus for X-ray fluorescence (XRF) spectroscopy.
- XRF X-ray fluorescence
- Each chemical element has a distinctive X-ray line spectrum having energies and therefore wavelengths that are dependent only upon the atomic number Z of the element. As a result it is possible to identify the presence of the element from observation of one or more of its distinctive line spectra.
- These distinctive X-ray lines are produced when an electron from one of the outer shells of the atom takes the place of an electron that was previously removed from an inner shell.
- the K spectra arise from electron transitions from the L to K shell which give rise to the doublet Ka l and Ka 2 and M to K transitions which produce KB1 and KB2.
- the L spectra have a dozen or more lines of longer wavelengths produced by transitions from the M and upper shells to the L shell.
- the higher atomic number elements also have M and N spectra.
- the intensity of the radiation in any XRF spectral line is a measure of the concentration of the element which produced such spectral line.
- the techniques of XRF analysis are widely used for analyzing materials such as ores, soils, glasses, catalysts, alloys, clays, dusts, paints, silicates, and the like to determine their elemental composition and concentration.
- the techniques can be used for trace analysis in a laboratory or for on-stream analysis of process streams.
- XRF analysis in mineral assays.
- XRF analysis was limited to the laboratory.
- a sample ore to be examined was obtained from the mine, prepared for analysis in the form of a solution or fine powder and irradiated with a source of high energy electrons, X-rays or gamma rays under controlled laboratory conditions.
- the resulting X-ray spectrum was then measured over the wavelengths of interest to determine what minerals were present and in what concentration. Obviously, however, this process is time consuming and does not permit on-site assays.
- the mine face is irradiated by the same source and the distance between the source/detector arrangement and the mine face is changed until the intensity of background radiation measured by the detector is the same as that from the reference sample.
- a measurement is then made of the intensity of X-ray radiation having the characteristic energies of the element being assayed. From this measurement and from the previously established relation between spectral line intensity and background in the sample of known concentration, an estimate of the concentration of the element is made.
- such a mineral assay is performed by drilling a borehole into the matrix, inserting into the borehole a probe containing a suitable XRF source/ detector, irradiating the matrix, detecting the spectrum of radiation that is produced and analyzing this spectrum.
- the spectrum is analyzed by counting for a period of time the number of X-ray photons detected in at least four energy ranges: a Compton range where the Compton peak is observed, an edge range at the edge of the Compton peak, a signal range where the X-ray spectral line or signal of the assayed element is observed, and a background range where the radiation that is detected is almost exclusively radiation from the source that has leaked through the shielding.
- concentration of the assayed element is determined from the following formula: where S,is the number of photons counted having energies in the signal range, C is the number of photons counted in the Compton range, B is the number of photons counted in the background range, E is the number of photons counted in the edge range and K1through K 6 are empirically determined constants relating to the performance of the probe.
- K 1 and K 2 are scaling factors which relate the number of counts measured in the background range of energies to the number of counts present in the signal and Compton ranges which are attributable to leakage of the source radiation through the shielding. These values depend on the particular geometry of the source and detector and the shielding between them as well as on the relative sizes of the signal, Compton and background ranges. They are determined from observed counts of X-ray photons in the signal, Compton and background ranges in the absence of the element being assayed.
- the remaining constants provide a slope and an intercept which relate the percent concentration of the element being studied to the term (S - K 1 ⁇ B)/ (C - K 2 - B).
- the constants K 3 through K 6 are determined from a series of measurements of reference samples having known percent concentrations distributed throughout the range of concentrations over which the probe is to be used. For each such sample the probe is used to count the number of X-ray photons detected in the signal, Compton and background ranges. From these values, ; the quantity (S - K 1 ⁇ B)/(C - K 2 ⁇ B) is calculated for each sample; and to these quantities a least squares fit of a straight line is made. The slope of this straight line is set equal to the term K 3 + K4 E/C and the intercept is set equal to the term K 5 + K 6 ⁇ E/C.
- a significant source of error in the detector is variatiohs in its gain due to temperature changes, drift and the like. Such changes in gain cause the detector to misread the energies of the received X-ray radiation as amounts greater or less than the true value.
- the slope and intercept terms vary significantly as a function of the ratio E/C, which is a sensitive measure of how accurately the detector has related the observed counts to the correct energy range, and that variations in the slope and intercept terms with respect to observed values of E/C can be used to compensate for changes in gain.
- the five values for the slope and the five values for the intercept are each functions of the ratio E/C. Within the normal range of gain errors that are likely to be experienced by the detector, there are only a single value of the slope and a single value of the intercept for each value of E/C. Hence, for an observed value of the ratio E/C it is possible to obtain by interpolation between the slope values a single value of a slope correction and by interpolation between the intercept values a single value of an intercept correction.
- the computer calculates the slopes K 4 , K 6 and intercepts K 3 , K 5 of straight lines between the five slope values and the five intercept values, respectively, and stores these values as functions of specified ranges of E/C. These values are then used in the calculation of percent concentration as described above.
- our invention may be used in other fields of mineral exploration such as mine face assays and ground surface assays.
- the invention may also be used for remote sensing in other environments such as oceanographic and extra-terrestrial exploration.
- the techniques of our invention may also be used to perform bulk assays of ore as, for example, in grading and/or sorting devices.
- Our invention may also be used to detect trace elements in process streams and to perform quality assurance and material analysis on all manner of industrial output. It can also be used to detect objects hidden in baggage or freight by using the invention to detect the presence of characteristic elements in such objects or characteristic concentrations of such elements.
- the invention may be used, for example, to monitor the movement of a chemical element through the body. In all these applications, usable results may be obtained with our invention without special preparation of the object subjected to X-ray fluorescence and without control of the geometrical relation between the source/detector and the object.
- the source and detector are combined in a probe which may be lowered or pushed into the borehole.
- Suitable electronics in the probe generate signals representative of the energy of the radiation received and transmit these signals to a data analyzer which processes the spectrum and calculates the percent concentration of the element or elements being assayed.
- the source is Cobalt and the detector is a cadmium telluride wafer.
- the probe is a cylinder approximately 1-1/4 inches (32 mm.) in diameter and 33 inches (838 mm.) in length.
- the data analyzer is a small battery powered unit which is connected to the probe by a suitable cable.
- the source and detector When used for surface assay applications, the source and detector advantageously are incorporated in a hand held pistol-like device. For medical applications, the source and detector advantageously are mounted on an articulated scanning head. One or more of these configurations will generally be suitable for the other applications described above.
- Fig. 1 depicts the application of our invention to the performance of a borehole assay of at least one of the elements in the matrix surrounding the borehole.
- a borehole is first drilled into the matrix whose chemical content is to be analyzed.
- this borehole may be as small as 1-1/2 inches (38 mm.) in diameter and may be hundreds or even thousands of feet deep.
- a probe 20 connected to a cable 30 is lowered by a winch 40 into the borehole.
- the probe contains a source 50 of high energy electromagnetic radiation, a detector 60 for X-ray fluorescence produced in said matrix when it is irradiated by said source and an electronic circuit 70.
- source 50 is Cobalt and detector 60 is cadmium telluride.
- Circuit 70 processes the X-ray fluorescence signals received by said detector and transmits them by a signal cable 80 to an analyzer 90 that is located outside the borehole.
- Analyzer 90 illustratively is a microcomputer that processes the received signals to produce a quantitative estimate of the concentration of at least one element in the matrix surrounding the borehole.
- Fig. 1 the probe is shown being lowered into a vertically drilled borehole.
- the invention may be practiced using boreholes drilled at any angle. Where the weight of the probe and/or the angle of the borehole is such that the probe cannot simply be lowered into the borehole, pushrods may be used to advance the probe.
- probe 20 is a torpedo shaped device with a cylindrical stainless steel casing 110 having a rounded front end 112 and a rear mounting 114 for the cable which connects it to the winch.
- the probe has a diameter of about 1-1/4 inches (32 mm.) and a length of 33 inches (838 mm.).
- the probe also contains forward and rear shields 120, 122 which shape the beam of radiation from source 50 with rear shield 122 also greatly reducing the amount of radiation from source 50 which is incident on detector 60.
- source 50 and shields 120, 122 are arranged so that radiation emanates from the source in a disc-like pattern transverse to the longitudinal axis of the probe and encompassing the entire circumference of the probe. Illustratively, this radiation pattern is only 1/4 inch (6 mm.) thick at the periphery of the probe.
- Detector 60 similarly receives X-ray fluorescence from the irradiated matrix over a full 360° of arc.
- the region irradiated by a source 50A can be limited by shielding to only a portion of a circle such as the 120° arc shown.
- a detector 60A can be limited in similar fashion.
- Other side looking geometries that can be used include those of Figs. 3B, 3C and 3D wherein sources 50B, 50C and 50D direct a narrow beam of radiation outward from one side of the probe at the adjacent matrix and detectors 60B, 60C and 60D sense the X-ray fluorescence produced thereby.
- the orientation of the source 50B and detector 60B are approximately at right angles to each other with shielding 122B in between.
- sources 50C, 50D and detectors 60C, 60D are oriented so that the direction of outward radiation is substantially anti-parallel to the direction of radiation received by the detector.
- the direction of outward radiation is substantially perpendicular to the longitudinal axis of the probe while in Fig. 3D it is at an acute angle thereto.
- End looking geometries are shown in Figs. 3E and 3F.
- source 50E and detector 60E are arranged so that the direction of outward radiation is substantially antiparallel to that of the received radiation but the source and detector are located at different positions in the forward end of the probe separated by shielding 122E.
- the source and the detector are concentric to one another with a shield 122F in between.
- numerous other geometrical arrangements can be devised by those skilled in the art.
- a block diagram of electronic circuit 70 is set forth in Fig. 4.
- the circuit comprises a preamplifier 210 which is connected to detector 60, a differentiator 220, an integrator 230, a sample and hold circuit 240, an analog to digital converter 250 and a transmitter/ receiver 260 which couples circuit 70 to signal cable 80 that is connected to data analyzer 90.
- the detector illustratively is a cadmium telluride (CdTe) wafer having a surface area of 30 to 60 mm. and a thickness of approximately 1 to 2 mm.
- CdTe cadmium telluride
- Each photon incident on the detector initiates a chain of events which produces a pulse of electrons whose magnitude is proportional to the energy of the photon.
- This pulse is converted to a voltage signal in preamplifier 210 which is a low noise, high gain amplifier.
- the output of preamplifier 210 is a signal having a relatively long duration on the order of one millisecond.
- each amplified pulse from preamplifier 210 is differentiated by differentiator 220 to produce a pulse about 3 microseconds long having an amplitude that is proportional to the energy of the incident photon that produced the pulse. Integrator 230 then smooths the output of differentiator 220.
- Sample and hold circuit 240 tracks each individual pulse produced by integrator 230 to its peak amplitude and stores this signal for analog to digital conversion by converter 250.
- the resulting digital signal which is proportional to the energy of the photon that produced the pulse is then transmitted in serial format by transmitter/receiver 260 to data analyzer 90. Synchronizing clock signals are also transmitted by the transmitter/receiver.
- transmitter/ receiver 260 receives power from data analyzer 90 as well as a control signal indicating when the analyzer is ready to receive data from the probe.
- Analyzer 90 counts the digital signals received that were produced by photons having energies within certain ranges of interest. From these counts, analyzer 90 determines the percent concentration of the element being assayed.
- an illustrative embodiment of analyzer 90 comprises a microprocessor 310, a programable read only memory (PROM) 320, a first random access memory (RAM) 330, a second random access memory (RAM) 340, a universal asynchronous receiver/transmitter (UART) 350, a keypad 360, a display 370, a timer 380, and a data interface 390. These elements are connected together by an address bus 400 and a data bus 410.
- data analyzer 90 is powered by a battery (not shown).
- Microprocessor 310 is illustratively a Z80 microprocessor operating on a 2.5 MHz clock frequency supplied by an oscillator 315.
- Address decoder 430 is a 74154 one-of-sixteen decoder having an input that is four of address lines 400.
- Programable read only memory 320 and random access memories 330, 340 are conventional and may be implemented in various ways. In the embodiment shown, PROM 320 comprises two 2K X 8 bit units of 2716type programable read only memory. Each of these units may be addressed in parallel by 11 address lines in order to produce an 8 bit parallel output. The particular unit addressed is selected by one of two control lines from address decoder 430.
- PROM 320 stores the operating program which counts the digital signals received from probe 20 and determines the percent concentration of the element being assayed.
- RAM 330 comprises two 1K X 4 bit units of 5114-type memory. This pair of units is addressed in parallel by 10 address lines to produce 8 parallel bits of output or to write 8 parallel bits into the memory.
- RAM 330 provides a scratch-pad memory and data storage used in calculation of percent concentration.
- RAM 340 comprises 8 pairs of lK X 4 bit units of 5114-type memory. This memory is addressed through a buffer register 342 and data is read from or written to this memory through a buffer register 344.
- An address decoder 346 provides for selection of the particular block of memory from which data is to be read or to which data is to be written.
- the decoder is implemented in a 74154 one-of-sixteen decoder using four of the address lines as an input and two address lines and the MREQ control line from the microprocessor as controls.
- This decoder and the RD line from microprocessor 310 also control the operation of register 344.
- UAR T 350 is an 1854-type interface between parallel data bus 410 and a serial communication line 440.
- a programable timer 352 which is connected through a divider circuit 354 to oscillator 315 provides clock signals for UART 350.
- Selection switches 356 are set so as to define the baud rate for serial data transmission on line 440. These switches may also be set to select parity options and framing characteristics. Operation of UART 350 is controlled by two control signals from address decoder 430 as well as by the RD and WR lines from microprocessor 310.
- Timer 352 illustratively is a 14536-type programmable timer.
- Keypad 360 is a conventional twelve key switch pad, the exterior of which is shown in Fig. 6.
- the output of the keypad is connected to data bus 410 through an I/O buffer register 362.
- this register is implemented in two 7097-type buffers.
- Display 370 provides a conventional 4 digit 7 segment display likewise shown in Fig. 6.
- the display is driven by a display driver 372 which is a 7211-type driver.
- the signal to be displayed is supplied to the driver on four of the lines of data bus 410; and the display is controlled by a control line from address decoder 430 and the WR line from microprocessor 310.
- Two address lines from bus 400 are used to identify the individual display digit to which the signals on the four data lines apply.
- Timer 380 is used to time the length of an assay. It is set and inhibited by signals from flipflop 382.
- Timer 380 is a 14536-type programmable timer; and flip-flop 382 is a 74374 octal D-type flip-flop with 3 output states. Signals are applied to flip-flop 382 from data bus 410 under control of a control signal from address decoder 430 and the WR signal from microprocessor 310.
- Interface 390 comprises differential amplifiers 392, 3931, control circuits 394, 395, a level shifter 396 and a shift register 398.
- the signals applied to amplifiers 392, 393 are the clock and data signals, respectively, from probe 20.
- the level of these signals is adjusted by level shifter 396 and the data signals from the probes are shifted into the shift register 398 by the clock signals received from the probe. Operation of the shift register is enabled by control lines from address decoder 430 and the RD signal from microprocessor 310.
- Control circuit 394 is a counter and comparator which counts the clock signals and determines from this count when shift register 398 is full.
- control circuit 394 is reset by the microprocessor after the contents of the shift register have been read out.
- the level shifter is implemented in a 14504-type device and the shift register is implemented in a pair of serially coupled 14094 shift registers. These two shift registers are independently controlled from address register 430 so that their contents may be independently read onto data bus 410. Signaling to the probe is accomplished through control circuit 395 which is connected to flip-flop 382. When a ready signal is to be transmitted to the probe this signal is supplied to flip-flop 382 on one of the lines of data bus 410.
- Control circuit 395 Upon receipt of the appropriate signals on the control line and the WR line, this signal is applied to control circuit 395.
- Control circuit 395 applies a ground signal to one of the two clock lines and a high signal to the other. This signal is interpreted by the probe electronics as an indication that the data analyzer is ready to receive data.
- Data analyzer 90 processes the signals received from the probe so as to determine the concentration of the element or elements being assayed.
- the computer program for performing such analysis is stored in PROM 320; and RAM 330 is used as a scratchpad register in making the calculations for the assay.
- the assay results are stored in RAM 340.
- the results of individual assays can be displayed by display 370 upon a command from keypad 360.
- the results may also be printed out by a printer (not shown) which is coupled to the data analyzer via UART 350 and communication line 440.
- the operator's control panel for data analyzer 90 is shown in Fig. 6.
- the panel includes a power switch 450, a function select switch 460, a light emitting diode 470, and a plug 480 for connecting either a printer or a battery charger to the data analyzer.
- Diode 470 is illuminated for a brief period of time whenever detector 60 senses radiation within the signal range of the element being assayed. Thus, diode 470 operates as a visual indicator of the radiation.
- the keypad and function select switches perform the following functions. The system is immediately ready to operate when power is turned on. If the apparatus has previously been used to log data from previous assaying operations, the data may have been retained in RAM 340. To clear this memory, switch 460 is switched to the "Assay Mode" and the "Reset Memory 1" and “Reset Memory 2" buttons are pressed in that order. The data analyzer is then ready for the entry of new data.
- the function select switch is returned to the "Assay Mode".
- Two types of assay are available: a manual assay or an automatic assay, with the difference being that the operator controls the length of time of the manual assay while that of the automatic assay is predetermined by timer 380 of Fig. 5.
- the operator presses the "Manual Assay” key. In this mode the data analyzer will accumulate counts from the probe until the "Manual Assay” key is pressed a second time.
- the operator presses the "Auto Assay” key.
- the assay value is displayed on display 370 and is stored in RAM 340.
- the percentage of memory remaining available for storage of assay data can be displayed by pressing the "Storage Avail %" key.
- the "Start Print” key When the operator would like to print the data stored in memory, he presses the “Start Print” key to deliver the stored data to a hard copy printer.
- the "Stop Print” key halts the printer in such a fashion that it will start again where it was halted by pressing the "Start Print” key.
- the “Reset Printer” key resets the printing operation so that the printer begins printing again from the beginning of the stored data.
- the memory may be cleared by pressing the "Reset Memory 1" and “Reset Memory 2" keys in that order. If this key sequence is entered in error, the memory can be recovered by the reverse process of pressing "Reset Memory 2" and then "Reset Memory 1".
- the "Assay Recall” key will recall the previous assay taken and will display it on display 370. When pressed repeatedly, this key will step backwards through memory displaying each of the assays stored all the way back to the first. In the case of such a display, the "Data ID” key will display the data identification number associated with the previously displayed assay and the Data” key will display the number of the particular assay within the data block. The “Current Assay” key returns to the display the result of the most recent assay performed and returns the data analyzer to the point where it is ready to begin logging new data.
- Table 1 An illustrative example of the data that are collected in an assay of uranium ore is set forth in Table 1.
- Table 1 Each five digit number in the table represents the number of photons sensed by the probe detector during a two minute assay within a specified energy range.
- each energy range is approximately 1.8 KeV and the 40 ranges represented in Table 1 span the spectrum from about 72 to 140 KeV.
- the counts reported for the first two ranges are limited by a threshold detector; and those reported for the last range include all photons detected having energies above about 140 KeV.
- energy ranges increase from left to right and the energy ranges in each row are greater than those in the row above them.
- the data analyzer accumulates counts in a form such as that of Table 1 and then analyzes these counts to calculate the percent concentration of the element being assayed, Preferably, this percent concentration is determined in accordance with the following formula: where S is the number of counts detected in the signal range, C is the number of counts detected in the Compton range, B is the number of counts detected in the background range, E is the number of counts detected in the edge range and K-. through K 6 are constants which are empirically determined for the probe that detects the counts. These constants are determined in advance of the assay and stored in PROM 320.
- a flow chart of the process for calibrating probe 20 and for determining percent concentration is set forth in F ig. 8.
- the source and the detector are first corrected for the effects of shield leakage by determining the values K 1 and K 2 .
- the source and detector are calibrated by measuring the radiation received at the detector from a group of samples having a known concentration of the element to be assayed, each of which samples is arranged in the same geometrical relationship with the source and the detector. From these measurements, the term (S-K I . B)/(C-K 2 ⁇ B) is calculated for each concentration sample. An equation is then fitted to these terms using one or more correction factors to relate the concentration of the samples of known concentration to the magnitudes of these terms.
- the correction factors are then stored in machine-readable form in an electronic processor.
- An object having an unknown concentration of the same chemical element is then irradiated by the source with no preparation of the object or control over the geometrical relationship between the source/detector and the object.
- the object typically has a rough surface and the distance between the probe and the object varies depending on the size of the probe and the borehole.
- the radiation produced by the source is measured in the same fashion as the calibration step was performed; and from the measured values and stored correction factors the concentration of the chemical element is determined.
- the remaining constants provide a slope and an intercept which relate the percent concentration of the element being studied to the term (S-K 1 ⁇ B)/ (C-K 2 ⁇ B).
- the constants K 3 through K 6 are determined from a series of measurements of reference samples having known percent concentrations distributed throughout the range of concentrations over which the probe is to be used. For each such sample, the source, the detector and the sample are arranged in the same geometrical relationship; and the probe is used to count the number of X-ray photons detected in the signal, Compton and background ranges. From these values, the quantity (S-K 1 ⁇ B)/(C-K 2 . B) is calculated for each sample; and to these quantities a least squares fit of a straight line is made.
- a significant source of error in the detector is variations in its gain due to temperature changes, drift and the like. Such changes in gain cause the detector to misread the energies of the received X-ray radiation as amounts greater or less than the true value.
- the slope and intercept terms vary significantly as a function of the ratio E/C, which is a sensitive measure of how accurately the detector has related the observed counts to the correct energy range, and that variations in the slope and intercept terms with respect to observed values of E/C can be used to compensate for changes in gain. Accordingly, we set the slope of the straight line of Fig. 9 equal to K 3 + K 4 ⁇ E/C and the intercept equal to K 5 + K 6 ⁇ E/C.
- the five values for the slope and the five values for the intercept are each functions of the ratio E/C.
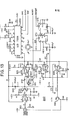
- a plot of illustrative such values for the slope and intercept as functions of E/C is set forth in Fig. 10. As shown therein, at lower values of the ratio E/C, the slope term (K 3 +K 4 . E/C) increases because the x-ray fluorescence signal is being shifted out of the signal range S. At higher values of E/C, the intercept term (K 5 +K 6 ⁇ E/C) decreases to compensate for the counts shifted into the signal range S due to Compton backscatter.
- the computer calculates the slopes K 4 , K 6 and intercepts K 3 , K 5 , of straight lines between the five slope values and the five intercept values, respectively, and stores these values in RAM 330 as functions of specified ranges of E/C.
- data analyzer 90 stores a first piecewise linear approximation to a curve which relates the slope m to the value of E/C and a second piecewise linear approximation to a curve which relates the intercept b to the value of E/C.
- a first piecewise linear approximation to a curve which relates the slope m to the value of E/C and a second piecewise linear approximation to a curve which relates the intercept b to the value of E/C.
- the calculation of percent concentration by the foregoing equation permits the determination of concentrations of elements with unusually high accuracy.
- the correlation coefficient between concentrations determined by X-ray fluorescence using this equation and those determined by the wet chemical analysis has been greater than 0.99.
- the equation can be modified in many ways to accommodate different circumstances or simplify the calculation. For example, it has been our experience that correction for shield leakage has little effect on the ultimate accuracy of the measurement. Accordingly, the constants K 1 and K 2 could, be eliminated.
- the practice of dividing the signal counts by the Compton counts is standard procedure in X-ray fluorescence spectroscopy which is sometimes called normalizing to the backscatter peak. This normalization technique accommodates variations in the geometry of the borehole and changes in the composition of the surrounding matrix.
- slope and intercept terms which vary as a function of E/C provides a significant improvement in the correlation between the X-ray fluorescence measurements and wet chemical analyses.
- the ratio E/C is particularly advantageous to use since this ratio is monotonic over the usual range of gain variations and is highly sensitive to small shifts in gain.
- other measures of the change in gain can be devised and the slope and intercept terms can be made functions of such surrogates.
- the width of the Compton and edge ranges are the same but the invention may be practiced using different widths.
- the width of the signal range should be large enough to encompass the signal from the element being assayed. Typically, it is wide enough to encompass both lines of the Ka doublet that is emitted by the element being assayed.
- the signal range is twice that of the Compton range.
- the background range is selected so as to accommodate enough counts to eliminate substantially the effect of random events such as cosmic radiation in the background energy range.
- the background range is approximately as wide as the signal range.
- Preamplifier 220 which is shown in F ig. 11, is a high gain low-noise design that produces a voltage pulse directly proportional to the amount of energy that enters detector 60 to which it is connected.
- This typb of preamplifier is generally known in the art as a charge-sensitive preamplifier.
- a high voltage input is applied to a filter network comprising resistors Rl, R2, and R3 and capacitors Cl and C2. This network filters out short term variations in the high voltage power supply and provides the correct bias voltage to the detector.
- the output of this network is supplied to detector 60.
- detector 60 When a photon of energy enters the detector, it produces an input pulse of electrons (or charge) that is coupled through capacitor C3 to the base of field effect transistor Ql which serves as the input stage of the preamplifier.
- Input transistor Ql is cascode coupled to transistor Q2, a low-noise field effect transistor such as a Texas Instrument type 2N 4857.
- Capacitor C4 serves as a low impedance path for any spurious voltage occuring at the gate of Q2.
- transistors Ql and Q2 and resistor R7 varies in accordance with the magnitude of the electron pulse coupled to transistor Ql causing the voltage drop across R7 to vary proportionally.
- the varying voltage at the drain of transistor Q2 is thus applied to the gate of transistor Q3, also a Texas Instrument 2N 4857.
- Transistor Q3, which is stabilized against oscillation by capacitor C5 operates as a follower driving transistor amplifier Q4. Current through transistor Q3 is thus caused to vary in accordance with the magnitude of the input pulse. This current flows through transistor Q4, transistor Q5, and resistor R8.
- Transistors Q4 and Q5 are biased by a network comprising diodes Dl through D6 and resistor R9. Capacitor C6 filters the base of transistor Q4.
- Transistor Q5 serves as a constant current source for transistor Q4.
- Capacitor C7 suppresses transients at the base of transistor Q5.
- Resistor R8 limits current through transistors Q3, Q4, and Q5.
- the voltage produced at the collector of Q5 which is also proportional to the magnitude of the input pulse is connected to the base of transistor Q6 and the base of transistor Q7 which together with transistors Q10 and Qll and associated resistors R13, R14, R15, and R16 comprise a complementary Darlington output group which serves as a line driver.
- This line driver provides an output at the point of connection of R14 and R15 which varies proportionately with the magnitude of the input pulse to transistor Ql.
- Transistors Q8 and Q9 are biased by the network of diodes D l through D6 and resistor R9 and serve as constant current loads for transistors Q6 and Q7, respectively, with current limiting and balancing provided by resistors Rll and R12. Capacitor Cll provides an AC return to ground for the collector of Q10.
- the resistor network comprising R18 through R21 is a voltage divider that provides DC feedback in the form of a small negative bias to Ql through resistor R6.
- AC feedback is supplied to transistor Ql by means of capacitor C9 which is also connected to resistor R6.
- Capacitor C12 serves to filter any variations in the voltage, typically -12 volts DC, which is supplied to resistor R21.
- the network comprising resistors R10 and C8 filters the positive direct current source, preferably 12 volts, used to drive all the transistors except those associated with the operation of the complementary Darlington output group.
- the network comprising R17 and capacitor C10 serves the same function for those transistors which are associated with the output group.
- differentiator 220 is a conventional differentiator implemented using an operational amplifier such as a 318-type amplifier.
- Integrator 230 likewise is a conventional integrator implemented in known fashion using another 318-type operational amplifier.
- sample and hold circuit 240 comprises analog switches 610, 615, operational amplifiers 620, 625, comparators 630, 635, diodes 640, 645, capacitor 650, transistor 660 and flip-flops 670, 675.
- the signal to be sampled is stored by capacitor 650 and is read by A/D converter 250 from the output of amplifier 625.
- the output of comparator 635 must be low causing transistor 660 to be on.
- the signal at the gate of analog switch 610 is high and a conductive path is established between the output of integrator 230 and the non-inverting input terminal of amplifier 620.
- the signal to be sampled charges capacitor 650 through amplifier 620 and diode 645.
- the output of amplifier 625 follows the voltage across capacitor 650. After the peak of the signal being sampled is reached and the signal voltage begins to descend, the voltage at the output of amplifier 620 becomes less than that across capacitor 650 and diode 645 becomes reverse biased. As a result, the peak voltage is stored by capacitor 650 and is available at the output of amplifier 625.
- Comparator 635 functions as a peak detector. When the signal at the output of amplifier 620 falls below that at the output of amplifier 625, this is sensed by comparator 635 and its output goes high, turning off transistor 660 and ending signal transmission through analog gate 610. At the same time, the signal from the output of comparator 635 clocks flip-flop 670 causing a start signal to be applied to analog to digital converter 250. The converter begins the process of forming a digital representation of the analog signal at the output of amplifier 625. When this conversion is completed, this signal is transmitted via transmitter/receiver 260 and signal cable 80 to data analyzer 90.
- a signal is returned to the probe indicating that the data analyzer is ready to receive more data.
- This signal produces a PRESET signal which is applied to the output of flip-flop 675 and also a RESET signal which is applied to analog switch 615 to dump the signal stored by capacitor 650.
- the output of amplifier 625 goes low enough that comparator 635 changes state once more, providing a low signal to transistor 660. This turns on transistor 660 and makes analog switch 610 conductive once more. As a result, the sample and hold circuit is again ready to process a signal.
- Comparator 630 operates as a low-level discriminator. If the signal at the output of amplifier 625 is too low, as determined by the setting of potentiometer 632, comparator 630 holds the ouput of comparator 635 high and prevents the clocking of flip-flop 670.
- T ransmitter/receiver 260 is a conventional circuit comprising logic gates 710, transistors 730 and transformers 740.
- a high sync or data signal causes current flow in one direction in the appropriate transformer while a low sync or data signal causes current flow in the opposite direction.
- Signals from the data analyzer are received by amplifier 750.
- the output of amplifier 750 is the PRESET signal applied to flip-flop 675. This signal is also inverted by transistor 760 to supply the RESET signal.
- the operation of our invention in making a borehole mineral assay will be apparent from the foregoing description.
- the borehole is drilled and the probe is lowered into the hole.
- the operator observes light emitting diode 470 on the operator's control panel. If no radiation is received at the probe that is characteristic of the x-ray fluorescence spectrum of the element being assayed, the diode is not lighted and there is no reason to take an assay.
- the diode alerts the operator to the desirability of performing an assay and the operator initiates the assay with the "Manual Assay" or "Auto Assay” key. After the data is recorded, the assay value is displayed on display 370 and stored in RAM 340.
- our invention may also be used in a qualitative manner, for example, in a minerals survey.
- a probe containing a source having radiation of a wavelength appropriate to produce'X-ray fluorescence in every one of the chemical elements may be lowered into a borehole; and the X-ray spectrum produced by irradiation may be examined at each point in the spectrum where X-ray fluorescence would be produced by an element if the element in question were present.
- a quantitative assay of its concentration could be made. Combinations of qualitative and quantitative capabilities in the same equipment and in the same borehole assay will likewise be apparent.
- our invention may be used in other fields of mineral exploration such as mine face assays and ground surface assays.
- the invention may also be used for remote sensing in other environments such as oceanographic and extra-terrestrial exploration. Since the apparatus does not have to be calibrated between periods of use, the speed of any assay or element detection procedure is greatly increased. Numerous other applications will be apparent: the bulk assay of ore as, for example, in grading and/or sorting devices, the detection of trace elements in process streams, quality assurance and material analysis.
- the invention can also be used to detect objects hidden in baggage or freight by using the invention to detect the presence of characteristic elements in such objects or characteristic concentrations of such elements.
- the invention may be used, for example, to monitor the movement of a chemical element through the body.
- the source and detector advantageously are incorporated in a hand held pistol-like device.
- the source and detector advantageously are mounted on an articulated scanning head.
- One or more of these configurations will generally be suitable for the other applications described above.
- the detector is a cadmium telluride wafer operated at ambient temperature. While such a detector has relatively low resolution on the order of 7-12 KeV, the calibration procedure of our invention makes feasible the use of such a detector to perform quantitative assays and eliminates the need to recalibrate during or between assays. If desired our invention may also be practiced using other detectors such as Germanium or Mercuric Iodide. Other sources may be used to produce the X-ray fluorescence.
- the energy range of the Compton backscatter peak will vary depending on the energy or energies of the particular source used to irradiate the object to be assayed. Where the source has more than one emission energy, the particular energy range may be selected to optimize signal detection. Instead of using radiation in the range about the Compton backscatter peak for calibrating the source and detector, it may be advantageous to use any other available radiation peak. In general, however, the gain correction should use a ratio that is highly sensitive to small displacements in the energy ranges caused by gain shifts.
- the ratio of the radiation detected in a range adjacent the radiation peak to the radiation in the peak is quite sensitive to such small displacements since this ratio is relatively small when the gain is properly adjusted and is large when the gain is in error.
- Other ratios such as that of the radiation low on the slope of a radiation peak to that of the radiation high on such a slope may prove advantageous.
- portions of certain energy ranges may be ignored in calculations or modified to make further refinements in the invention.
- the K spectrum is a doublet, it may be desirable to divide the range where X-ray fluorescence is observed into two regions and combine the measurements made in each range with or without weighting of such measurements. Curve fitting methods other than least squares fits to straight lines and linear interpolation may also prove advantageous.
Abstract
Description
- This relates to a method and apparatus for X-ray fluorescence (XRF) spectroscopy. The techniques and equipment described are particularly useful for a quantitative borehole analysis of the elemental content of surrounding rock. Numerous other applications will also be apparent.
- Each chemical element has a distinctive X-ray line spectrum having energies and therefore wavelengths that are dependent only upon the atomic number Z of the element. As a result it is possible to identify the presence of the element from observation of one or more of its distinctive line spectra. These distinctive X-ray lines are produced when an electron from one of the outer shells of the atom takes the place of an electron that was previously removed from an inner shell. The K spectra arise from electron transitions from the L to K shell which give rise to the doublet Kal and Ka2 and M to K transitions which produce KB1 and KB2. The L spectra have a dozen or more lines of longer wavelengths produced by transitions from the M and upper shells to the L shell. The higher atomic number elements also have M and N spectra.
- To remove an electron from an inner shell, it is necessary to bombard an atom with a high-energy electron beam or with a high energy beam of electromagnetic radiation such as X-rays or gamma rays. The energy required to cause such electron vacancy must exceed the binding energy of the electron in its shell.
- In addition to the line spectrum, a continuous, nearly structureless, background spectrum of wavelengths is generated by such bombardment. When an X-ray tube is used to generate a stream of high energy bombardment electrons, this spectrum is produced by the rapid deceleration of electrons in the target of the X-ray tube. Where high energy electromagnetic radiation is used, the continuous spectrum is generated by the collisions of photons of electromagnetic radiation with electrons in accordance with the well known Compton effect. Considerable additional information on XRF analysis may be found in R.O. Muller, Spectrochemical Analysis by X-ray Fluorescence (Plenum 1972j.
- The intensity of the radiation in any XRF spectral line is a measure of the concentration of the element which produced such spectral line. As a result, the techniques of XRF analysis are widely used for analyzing materials such as ores, soils, glasses, catalysts, alloys, clays, dusts, paints, silicates, and the like to determine their elemental composition and concentration. For example, the techniques can be used for trace analysis in a laboratory or for on-stream analysis of process streams.
- One application of particular interest to the present invention is the use of XRF analysis in mineral assays. Until recently, such use of XRF analysis was limited to the laboratory. A sample ore to be examined was obtained from the mine, prepared for analysis in the form of a solution or fine powder and irradiated with a source of high energy electrons, X-rays or gamma rays under controlled laboratory conditions. The resulting X-ray spectrum was then measured over the wavelengths of interest to determine what minerals were present and in what concentration. Obviously, however, this process is time consuming and does not permit on-site assays.
- In U.S. Patent 4,045,676, which is incorporated herein by reference, a technique is described which permits'the use of XRF analysis at the rough surface of a mine face. In this technique a reference sample is prepared having a known concentration of the element which is to be assayed. The reference sample is then irradiated by a suitable source and a broad spectrum of background radiation from the sample is measured by the detector. For the same geometrical relation of source, detector and sample, a measurement is also made of the intensity of X-ray radiation having the characteristic energies and therefore wavelengths of the element whose concentration is to be determined. To assay this element in the matrix of rock at the mine face, the mine face is irradiated by the same source and the distance between the source/detector arrangement and the mine face is changed until the intensity of background radiation measured by the detector is the same as that from the reference sample. A measurement is then made of the intensity of X-ray radiation having the characteristic energies of the element being assayed. From this measurement and from the previously established relation between spectral line intensity and background in the sample of known concentration, an estimate of the concentration of the element is made.
- This technique, however, requires the use of at least one reference sample and the ability to control the physical relationship between the source/detector and the object to be examined. While such control may be possible in the laboratory or at a mine face, it cannot be used in numerous other applications where assays are desirable.
- In addition, calibration of such device is a time consuming task which must be performed manually during each assay.
- We have devised a method and apparatus for performing X-ray fluorescence analysis where the physical shape of the object and the physical relationship between the source/detector and the object being examined are not controlled. This technique and apparatus eliminates the need to prepare samples as in laboratory analysis or to calibrate the device during or between assays as in the technique disclosed in the '676 patent. Its use is particularly advantageous in the field in performing an in situ analysis of the concentration of one or more elements present under the rough surface of a matrix of a material such as rock. In accordance with this aspect of our invention, such a mineral assay is performed by drilling a borehole into the matrix, inserting into the borehole a probe containing a suitable XRF source/ detector, irradiating the matrix, detecting the spectrum of radiation that is produced and analyzing this spectrum.
- Further in accordance with the preferred embodiment of our invention, the spectrum is analyzed by counting for a period of time the number of X-ray photons detected in at least four energy ranges: a Compton range where the Compton peak is observed, an edge range at the edge of the Compton peak, a signal range where the X-ray spectral line or signal of the assayed element is observed, and a background range where the radiation that is detected is almost exclusively radiation from the source that has leaked through the shielding. From these measurements the concentration of the assayed element is determined from the following formula:

- K1 and K2 are scaling factors which relate the number of counts measured in the background range of energies to the number of counts present in the signal and Compton ranges which are attributable to leakage of the source radiation through the shielding. These values depend on the particular geometry of the source and detector and the shielding between them as well as on the relative sizes of the signal, Compton and background ranges. They are determined from observed counts of X-ray photons in the signal, Compton and background ranges in the absence of the element being assayed.
- The remaining constants provide a slope and an intercept which relate the percent concentration of the element being studied to the term (S - K1 · B)/ (C - K2 - B). The constants K3 through K6 are determined from a series of measurements of reference samples having known percent concentrations distributed throughout the range of concentrations over which the probe is to be used. For each such sample the probe is used to count the number of X-ray photons detected in the signal, Compton and background ranges. From these values, ; the quantity (S - K1 · B)/(C - K2 · B) is calculated for each sample; and to these quantities a least squares fit of a straight line is made. The slope of this straight line is set equal to the term K3 + K4 E/C and the intercept is set equal to the term K5 + K6 · E/C.
- A significant source of error in the detector is variatiohs in its gain due to temperature changes, drift and the like. Such changes in gain cause the detector to misread the energies of the received X-ray radiation as amounts greater or less than the true value. We have found that the slope and intercept terms vary significantly as a function of the ratio E/C, which is a sensitive measure of how accurately the detector has related the observed counts to the correct energy range, and that variations in the slope and intercept terms with respect to observed values of E/C can be used to compensate for changes in gain.
- To determine the variation of the slope and intercept terms with respect to E/C, a computer simulation is made of the effect of small shifts in the observed energy ranges on the values of the term (S - Kl B)/ (C - K2 · B) for the measurements of the reference samples and on the slope and intercept of the least squares fit to these values. In particular, we calculate the value (S - K1 · B)/(C - K2 · B) for each of the reference samples for each of five different shifts in the observed energy ranges. For each of these five shifts, a least squares fit of a straight line is made for the calculated values of (S - K1 · B)/(C - K2 · B) and the slope and intercept of the line is determined.
- The five values for the slope and the five values for the intercept are each functions of the ratio E/C. Within the normal range of gain errors that are likely to be experienced by the detector, there are only a single value of the slope and a single value of the intercept for each value of E/C. Hence, for an observed value of the ratio E/C it is possible to obtain by interpolation between the slope values a single value of a slope correction and by interpolation between the intercept values a single value of an intercept correction. For linear interpolation, the computer calculates the slopes K4, K6 and intercepts K3, K5 of straight lines between the five slope values and the five intercept values, respectively, and stores these values as functions of specified ranges of E/C. These values are then used in the calculation of percent concentration as described above.
- In addition to borehole mineral assays, our invention may be used in other fields of mineral exploration such as mine face assays and ground surface assays. The invention may also be used for remote sensing in other environments such as oceanographic and extra-terrestrial exploration. The techniques of our invention may also be used to perform bulk assays of ore as, for example, in grading and/or sorting devices. Our invention may also be used to detect trace elements in process streams and to perform quality assurance and material analysis on all manner of industrial output. It can also be used to detect objects hidden in baggage or freight by using the invention to detect the presence of characteristic elements in such objects or characteristic concentrations of such elements. In medical applications, the invention may be used, for example, to monitor the movement of a chemical element through the body. In all these applications, usable results may be obtained with our invention without special preparation of the object subjected to X-ray fluorescence and without control of the geometrical relation between the source/detector and the object.
- Different configurations of the apparatus are used for different applications. For borehole assays, the source and detector are combined in a probe which may be lowered or pushed into the borehole. Suitable electronics in the probe generate signals representative of the energy of the radiation received and transmit these signals to a data analyzer which processes the spectrum and calculates the percent concentration of the element or elements being assayed. Advantageously, the source is Cobalt and the detector is a cadmium telluride wafer. The probe is a cylinder approximately 1-1/4 inches (32 mm.) in diameter and 33 inches (838 mm.) in length. The data analyzer is a small battery powered unit which is connected to the probe by a suitable cable. When used for surface assay applications, the source and detector advantageously are incorporated in a hand held pistol-like device. For medical applications, the source and detector advantageously are mounted on an articulated scanning head. One or more of these configurations will generally be suitable for the other applications described above.
- Embodiments of the present invention will now be described, by way of example, with reference to the accompanying drawings in which:-
- Fig. 1 is a schematic illustration depicting the use of our invention for performing an assay in a borehole;
- Fig. 2 is a cut-away view of an illustrative embodiment of a probe that is lowered into the borehole in accordance with our invention;
- Fig. 3 is a schematic illustration of several alternative arrangements of a source and a detector in the probe of Fig. 2;
- Fig. 4 is a block diagram of the electronics contained within the probe of Fig 2;
- Fig. 5 is a block diagram of an illustrative embodiment of a data analyzer for use with the probe of Fig. 2;
- Fig. 6 is a plan view of an operator's panel for the data analyzer;
- Fig. 7 is an illustration of a typical X-ray fluorescence spectrum;
- Fig. 8 is a flow chart depicting an illustrative embodiment of a process for performing an assay in accordance with the invention;
- Fig. 9 and 10 are plots of typical X-ray fluorescence data useful in understanding the determination of calibration factors; and
- Figs. 11, 12, 13 and 14 are schematic diagrams of illustrative embodiments of certain components of the -probe electronics of Fig. 4.
- Fig. 1 depicts the application of our invention to the performance of a borehole assay of at least one of the elements in the matrix surrounding the borehole. In accordance with our invention, a borehole is first drilled into the matrix whose chemical content is to be analyzed. Illustratively, this borehole may be as small as 1-1/2 inches (38 mm.) in diameter and may be hundreds or even thousands of feet deep. In accordance with the invention a
probe 20 connected to acable 30 is lowered by awinch 40 into the borehole. As shown in the enlarged, cut-away view of Fig. 2, the probe contains asource 50 of high energy electromagnetic radiation, adetector 60 for X-ray fluorescence produced in said matrix when it is irradiated by said source and anelectronic circuit 70. Advantageously,source 50 is Cobalt anddetector 60 is cadmium telluride.Circuit 70 processes the X-ray fluorescence signals received by said detector and transmits them by asignal cable 80 to ananalyzer 90 that is located outside the borehole.Analyzer 90 illustratively is a microcomputer that processes the received signals to produce a quantitative estimate of the concentration of at least one element in the matrix surrounding the borehole. - In Fig. 1 the probe is shown being lowered into a vertically drilled borehole. The invention, however, may be practiced using boreholes drilled at any angle. Where the weight of the probe and/or the angle of the borehole is such that the probe cannot simply be lowered into the borehole, pushrods may be used to advance the probe.
- As shown in Fig. 2,
probe 20 is a torpedo shaped device with a cylindricalstainless steel casing 110 having a roundedfront end 112 and a rear mounting 114 for the cable which connects it to the winch. Illustratively, the probe has a diameter of about 1-1/4 inches (32 mm.) and a length of 33 inches (838 mm.). In addition to the source, detector and electronic circuit, the probe also contains forward andrear shields source 50 withrear shield 122 also greatly reducing the amount of radiation fromsource 50 which is incident ondetector 60. - Several different geometries of source, detector and shielding may be used in practicing the invention. As shown in Fig. 2,
source 50 and shields 120, 122 are arranged so that radiation emanates from the source in a disc-like pattern transverse to the longitudinal axis of the probe and encompassing the entire circumference of the probe. Illustratively, this radiation pattern is only 1/4 inch (6 mm.) thick at the periphery of the probe.Detector 60 similarly receives X-ray fluorescence from the irradiated matrix over a full 360° of arc. As shown in Fig. 3A, the region irradiated by asource 50A can be limited by shielding to only a portion of a circle such as the 120° arc shown. The area seen by adetector 60A can be limited in similar fashion. Other side looking geometries that can be used include those of Figs. 3B, 3C and 3D whereinsources detectors source 50B anddetector 60B are approximately at right angles to each other with shielding 122B in between. In Figs. 3C and 3D,sources 50C, 50D anddetectors source 50E anddetector 60E are arranged so that the direction of outward radiation is substantially antiparallel to that of the received radiation but the source and detector are located at different positions in the forward end of the probe separated by shielding 122E. In Fig. 3F, the source and the detector are concentric to one another with ashield 122F in between. As will be apparent, numerous other geometrical arrangements can be devised by those skilled in the art. - A block diagram of
electronic circuit 70 is set forth in Fig. 4. The circuit comprises apreamplifier 210 which is connected todetector 60, adifferentiator 220, anintegrator 230, a sample and holdcircuit 240, an analog todigital converter 250 and a transmitter/receiver 260 which couplescircuit 70 to signalcable 80 that is connected todata analyzer 90. The detector illustratively is a cadmium telluride (CdTe) wafer having a surface area of 30 to 60 mm. and a thickness of approximately 1 to 2 mm. - Each photon incident on the detector initiates a chain of events which produces a pulse of electrons whose magnitude is proportional to the energy of the photon. This pulse is converted to a voltage signal in
preamplifier 210 which is a low noise, high gain amplifier. The output ofpreamplifier 210 is a signal having a relatively long duration on the order of one millisecond. To minimize signal pile up effects, each amplified pulse frompreamplifier 210 is differentiated bydifferentiator 220 to produce a pulse about 3 microseconds long having an amplitude that is proportional to the energy of the incident photon that produced the pulse.Integrator 230 then smooths the output ofdifferentiator 220. Sample and holdcircuit 240 tracks each individual pulse produced byintegrator 230 to its peak amplitude and stores this signal for analog to digital conversion byconverter 250. The resulting digital signal which is proportional to the energy of the photon that produced the pulse is then transmitted in serial format by transmitter/receiver 260 todata analyzer 90. Synchronizing clock signals are also transmitted by the transmitter/receiver. In addition, transmitter/receiver 260 receives power fromdata analyzer 90 as well as a control signal indicating when the analyzer is ready to receive data from the probe. -
Analyzer 90 counts the digital signals received that were produced by photons having energies within certain ranges of interest. From these counts,analyzer 90 determines the percent concentration of the element being assayed. As shown in Fig. 5, an illustrative embodiment ofanalyzer 90 comprises amicroprocessor 310, a programable read only memory (PROM) 320, a first random access memory (RAM) 330, a second random access memory (RAM) 340, a universal asynchronous receiver/transmitter (UART) 350, akeypad 360, adisplay 370, atimer 380, and adata interface 390. These elements are connected together by anaddress bus 400 and adata bus 410. In addition, the operation of individual-components of the circuit is controlled by one or more control signals onlines 420 from anaddress decoder 430 and/or by control lines such as RD, WR and MREQ leading 'directly frommicroprocessor 310. Advantageously,data analyzer 90 is powered by a battery (not shown). -
Microprocessor 310 is illustratively a Z80 microprocessor operating on a 2.5 MHz clock frequency supplied by anoscillator 315.Address decoder 430 is a 74154 one-of-sixteen decoder having an input that is four of address lines 400. Programable read onlymemory 320 andrandom access memories PROM 320 comprises two2K X 8 bit units of 2716type programable read only memory. Each of these units may be addressed in parallel by 11 address lines in order to produce an 8 bit parallel output. The particular unit addressed is selected by one of two control lines fromaddress decoder 430.PROM 320 stores the operating program which counts the digital signals received fromprobe 20 and determines the percent concentration of the element being assayed.RAM 330 comprises two1K X 4 bit units of 5114-type memory. This pair of units is addressed in parallel by 10 address lines to produce 8 parallel bits of output or to write 8 parallel bits into the memory.RAM 330 provides a scratch-pad memory and data storage used in calculation of percent concentration.RAM 340 comprises 8 pairs oflK X 4 bit units of 5114-type memory. This memory is addressed through abuffer register 342 and data is read from or written to this memory through abuffer register 344. Anaddress decoder 346 provides for selection of the particular block of memory from which data is to be read or to which data is to be written. Illustratively the decoder is implemented in a 74154 one-of-sixteen decoder using four of the address lines as an input and two address lines and the MREQ control line from the microprocessor as controls. This decoder and the RD line frommicroprocessor 310 also control the operation ofregister 344. - UAR
T 350 is an 1854-type interface betweenparallel data bus 410 and aserial communication line 440. A programable timer 352 which is connected through adivider circuit 354 tooscillator 315 provides clock signals forUART 350. Selection switches 356 are set so as to define the baud rate for serial data transmission online 440. These switches may also be set to select parity options and framing characteristics. Operation ofUART 350 is controlled by two control signals fromaddress decoder 430 as well as by the RD and WR lines frommicroprocessor 310. Timer 352 illustratively is a 14536-type programmable timer. -
Keypad 360 is a conventional twelve key switch pad, the exterior of which is shown in Fig. 6. The output of the keypad is connected todata bus 410 through an I/O buffer register 362. Illustratively, this register is implemented in two 7097-type buffers. -
Display 370 provides a conventional 4digit 7 segment display likewise shown in Fig. 6. The display is driven by adisplay driver 372 which is a 7211-type driver. The signal to be displayed is supplied to the driver on four of the lines ofdata bus 410; and the display is controlled by a control line fromaddress decoder 430 and the WR line frommicroprocessor 310. Two address lines frombus 400 are used to identify the individual display digit to which the signals on the four data lines apply. -
Timer 380 is used to time the length of an assay. It is set and inhibited by signals fromflipflop 382.Timer 380 is a 14536-type programmable timer; and flip-flop 382 is a 74374 octal D-type flip-flop with 3 output states. Signals are applied to flip-flop 382 fromdata bus 410 under control of a control signal fromaddress decoder 430 and the WR signal frommicroprocessor 310. -
Interface 390 comprisesdifferential amplifiers 392, 3931,control circuits level shifter 396 and ashift register 398. The signals applied toamplifiers probe 20. The level of these signals is adjusted bylevel shifter 396 and the data signals from the probes are shifted into theshift register 398 by the clock signals received from the probe. Operation of the shift register is enabled by control lines fromaddress decoder 430 and the RD signal frommicroprocessor 310.Control circuit 394 is a counter and comparator which counts the clock signals and determines from this count whenshift register 398 is full. Upon reaching a full condition, the control circuit advisesmicroprocessor 310 that the shift register is ready to be read and disablesamplifiers Control circuit 394 is reset by the microprocessor after the contents of the shift register have been read out. The level shifter is implemented in a 14504-type device and the shift register is implemented in a pair of serially coupled 14094 shift registers. These two shift registers are independently controlled fromaddress register 430 so that their contents may be independently read ontodata bus 410. Signaling to the probe is accomplished throughcontrol circuit 395 which is connected to flip-flop 382. When a ready signal is to be transmitted to the probe this signal is supplied to flip-flop 382 on one of the lines ofdata bus 410. Upon receipt of the appropriate signals on the control line and the WR line, this signal is applied to controlcircuit 395.Control circuit 395 applies a ground signal to one of the two clock lines and a high signal to the other. This signal is interpreted by the probe electronics as an indication that the data analyzer is ready to receive data. - ,
Data analyzer 90 processes the signals received from the probe so as to determine the concentration of the element or elements being assayed. The computer program for performing such analysis is stored inPROM 320; andRAM 330 is used as a scratchpad register in making the calculations for the assay. The assay results are stored inRAM 340. The results of individual assays can be displayed bydisplay 370 upon a command fromkeypad 360. The results may also be printed out by a printer (not shown) which is coupled to the data analyzer viaUART 350 andcommunication line 440. - The operator's control panel for
data analyzer 90 is shown in Fig. 6. In addition tokeypad 360 anddisplay 370 the panel includes apower switch 450, a functionselect switch 460, alight emitting diode 470, and aplug 480 for connecting either a printer or a battery charger to the data analyzer.Diode 470 is illuminated for a brief period of time wheneverdetector 60 senses radiation within the signal range of the element being assayed. Thus,diode 470 operates as a visual indicator of the radiation. The keypad and function select switches perform the following functions. The system is immediately ready to operate when power is turned on. If the apparatus has previously been used to log data from previous assaying operations, the data may have been retained inRAM 340. To clear this memory,switch 460 is switched to the "Assay Mode" and the "Reset Memory 1" and "Reset Memory 2" buttons are pressed in that order. The data analyzer is then ready for the entry of new data. - In the present configuration of the data analyzer, up to 3,500 individual assays can be separately identified and stored within
RAM 340 of the data analyzer. These assays can be grouped into as many as 64 blocks of data each identified by a "Data ID" number. To enter a "Data ID" number, the operator moves the function select switch to "Data ID Entry" and keys in the desired ID number onkeypad 360. He then presses the "Enter" key. - To perform an assay, the function select switch is returned to the "Assay Mode". Two types of assay are available: a manual assay or an automatic assay, with the difference being that the operator controls the length of time of the manual assay while that of the automatic assay is predetermined by
timer 380 of Fig. 5. To initiate a manual assay, the operator presses the "Manual Assay" key. In this mode the data analyzer will accumulate counts from the probe until the "Manual Assay" key is pressed a second time. To initiate an automatic assay, the operator presses the "Auto Assay" key. Upon completion of the assay in either the manual or auto mode, the assay value is displayed ondisplay 370 and is stored inRAM 340. - The percentage of memory remaining available for storage of assay data can be displayed by pressing the "Storage Avail %" key. When the operator would like to print the data stored in memory, he presses the "Start Print" key to deliver the stored data to a hard copy printer. The "Stop Print" key halts the printer in such a fashion that it will start again where it was halted by pressing the "Start Print" key. The "Reset Printer" key resets the printing operation so that the printer begins printing again from the beginning of the stored data.
- After the stored assays have been transfered to the hard copy printer, the memory may be cleared by pressing the "
Reset Memory 1" and "Reset Memory 2" keys in that order. If this key sequence is entered in error, the memory can be recovered by the reverse process of pressing "Reset Memory 2" and then "Reset Memory 1". - The "Assay Recall" key will recall the previous assay taken and will display it on
display 370. When pressed repeatedly, this key will step backwards through memory displaying each of the assays stored all the way back to the first. In the case of such a display, the "Data ID" key will display the data identification number associated with the previously displayed assay and the Data" key will display the number of the particular assay within the data block. The "Current Assay" key returns to the display the result of the most recent assay performed and returns the data analyzer to the point where it is ready to begin logging new data. - An illustrative example of the data that are collected in an assay of uranium ore is set forth in Table 1.

- The data analyzer accumulates counts in a form such as that of Table 1 and then analyzes these counts to calculate the percent concentration of the element being assayed, Preferably, this percent concentration is determined in accordance with the following formula:

PROM 320. For the example set forth in the data of Table 1, S = 7907 + 6510 + 5305 + 3658 + 3060 = 26440; C = 41700 + 41285 + 37247 = 120232; E = 27552 + 18906 + 14857 = 61315; and B = 1397 + 1369 + 1258 + 1222 + 1174 = 6420. These data are stored inRAM 330. - ) A flow chart of the process for calibrating
probe 20 and for determining percent concentration is set forth in Fig. 8. As shown therein, the source and the detector are first corrected for the effects of shield leakage by determining the values K1 and K2. Next, the source and detector are calibrated by measuring the radiation received at the detector from a group of samples having a known concentration of the element to be assayed, each of which samples is arranged in the same geometrical relationship with the source and the detector. From these measurements, the term (S-KI . B)/(C-K2 · B) is calculated for each concentration sample. An equation is then fitted to these terms using one or more correction factors to relate the concentration of the samples of known concentration to the magnitudes of these terms. The correction factors are then stored in machine-readable form in an electronic processor. An object having an unknown concentration of the same chemical element is then irradiated by the source with no preparation of the object or control over the geometrical relationship between the source/detector and the object. Thus the object typically has a rough surface and the distance between the probe and the object varies depending on the size of the probe and the borehole. The radiation produced by the source is measured in the same fashion as the calibration step was performed; and from the measured values and stored correction factors the concentration of the chemical element is determined. - K1 and K2 are scaling factors which relate the number of counts measured in the background range of energies to the number of counts present in the signal and Compton ranges which are attributable to leakage of the source radiation through the shielding. These values depend on the particular geometry of the source and detector and the shielding between them as well as on the relative sizes of the signal, Compton and background ranges. They are determined from observed counts of X-ray photons in the signal, Compton and background ranges in the absence of the element being assayed by setting K1 = S/B and K2 = C/B. By way of illustration K1 = 0.1714 and K2 = 0.79778 for one probe similar to that shown in Fig. 2 that has been used in the practice of our invention with a 6 KeV Compton range, a 10 KeV signal range and a 10 KeV background range.
- The remaining constants provide a slope and an intercept which relate the percent concentration of the element being studied to the term (S-K1 · B)/ (C-K2 · B). The constants K3 through K6 are determined from a series of measurements of reference samples having known percent concentrations distributed throughout the range of concentrations over which the probe is to be used. For each such sample, the source, the detector and the sample are arranged in the same geometrical relationship; and the probe is used to count the number of X-ray photons detected in the signal, Compton and background ranges. From these values, the quantity (S-K1 · B)/(C-K2 . B) is calculated for each sample; and to these quantities a least squares fit of a straight line is made. An illustrative plot of percent concentration versus the quantity (S-K1 · B)/(C-K2 · B) is set forth in Fig. 9. As will be apparent a straight line fitted to these data will have the general form y = mx + b where y is the percent concentration, x is the quantity (S-K1 · B)/ (C-K2 · B), m is the slope of the line and b is the intercept.
- A significant source of error in the detector is variations in its gain due to temperature changes, drift and the like. Such changes in gain cause the detector to misread the energies of the received X-ray radiation as amounts greater or less than the true value. We have found that the slope and intercept terms vary significantly as a function of the ratio E/C, which is a sensitive measure of how accurately the detector has related the observed counts to the correct energy range, and that variations in the slope and intercept terms with respect to observed values of E/C can be used to compensate for changes in gain. Accordingly, we set the slope of the straight line of Fig. 9 equal to K3 + K4 · E/C and the intercept equal to K5 + K6 · E/C.
- To determine the variation of the slope and intercept terms with respect to E/C, a computer simulation is made of the effect of small shifts in the observed energy ranges on the values of the term (S-K1 · B)/ (C-K2 · B) for the measurements of the reference samples and on the slope and intercept of the least squares fit to these values. In particular, we calculate the value (S-Kl - B)/ (C-K2 · B) for each of the reference samples for each of five different shifts in the observed energy ranges. For each of these five shifts, a least squares fit of a straight line is made for the calculated values of (S-Kl B)/ (C-K2 · B) as illustrated by the five straight lines of Fig. 9; and the slope and intercept of each of these five lines is determined.
- As shown in Fig. 9, for smaller values of the ratio E/C, less X-ray fluorescence is counted in the signal range S, causing the relation between concentration and the critical statistic, (S-K1 · B)/ (C-K2 · B), to be more vertical. For larger values of E/C, more X-ray fluoresdence and more Compton backscatter is counted in the signal range S, causing the relation between concentration and the statistic, (S-Kl B)/ C-K2 - B), to be more horizontal and shifted to the right.
- The five values for the slope and the five values for the intercept are each functions of the ratio E/C. A plot of illustrative such values for the slope and intercept as functions of E/C is set forth in Fig. 10. As shown therein, at lower values of the ratio E/C, the slope term (K3+K4 . E/C) increases because the x-ray fluorescence signal is being shifted out of the signal range S. At higher values of E/C, the intercept term (K5+K6 · E/C) decreases to compensate for the counts shifted into the signal range S due to Compton backscatter.
- Within the normal range of gain errors that are likely to be experienced by the detector, there are only a single value of the slope and a single value of the intercept for each value of E/C. Hence, for an observed value of the ratio E/C it is possible to obtain by interpolation between the slope values a single value of a slope correction and by interpolation between the intercept values a single value of an intercept correction. For linear interpolation, the computer calculates the slopes K4, K6 and intercepts K3, K5, of straight lines between the five slope values and the five intercept values, respectively, and stores these values in
RAM 330 as functions of specified ranges of E/C. Thus data analyzer 90 stores a first piecewise linear approximation to a curve which relates the slope m to the value of E/C and a second piecewise linear approximation to a curve which relates the intercept b to the value of E/C. For example, for the illustrative plot of Fig. 10,
when .46337 < E/C < .63002 - K3 = 19.3344
- K4 = -16.2735
- K5 = 0.94179
- K6 = 0.030363.
- For the example of Table 1, E/C = .509972. Substituting the above values for S, C, E and B and the values for K1 through K6' the percent concentration of the element whose assay is reported in Table 1 is 0.846%.
- For the example shown in Figures 9 and 10, note that .500
% U 308 will give (S-K1 · B)/ (C-K2 · B) equal to .157 when E/C is .63. Instrumental drift of +2 KeV, corresponding to E/C equal to .46 or .83, changes (S-K1 · B)/ (C-K2 · B) to .121 or .214 respectively. If uncompensated for, these values, when read on the E/C = .63 line, would yield incorrect assays of .177% and 1.023% U308. Instrumental drift of 1.8 KeV has been observed under laboratory conditions. - The calculation of percent concentration by the foregoing equation permits the determination of concentrations of elements with unusually high accuracy. In tests we have performed, the correlation coefficient between concentrations determined by X-ray fluorescence using this equation and those determined by the wet chemical analysis has been greater than 0.99. The equation can be modified in many ways to accommodate different circumstances or simplify the calculation. For example, it has been our experience that correction for shield leakage has little effect on the ultimate accuracy of the measurement. Accordingly, the constants K1 and K2 could, be eliminated. The practice of dividing the signal counts by the Compton counts is standard procedure in X-ray fluorescence spectroscopy which is sometimes called normalizing to the backscatter peak. This normalization technique accommodates variations in the geometry of the borehole and changes in the composition of the surrounding matrix. We have found that the use of slope and intercept terms which vary as a function of E/C provides a significant improvement in the correlation between the X-ray fluorescence measurements and wet chemical analyses. The ratio E/C is particularly advantageous to use since this ratio is monotonic over the usual range of gain variations and is highly sensitive to small shifts in gain. However, other measures of the change in gain can be devised and the slope and intercept terms can be made functions of such surrogates.
- Advantageously, the width of the Compton and edge ranges are the same but the invention may be practiced using different widths. The width of the signal range should be large enough to encompass the signal from the element being assayed. Typically, it is wide enough to encompass both lines of the Ka doublet that is emitted by the element being assayed. For the example given in Table 1, the signal range is twice that of the Compton range. The background range is selected so as to accommodate enough counts to eliminate substantially the effect of random events such as cosmic radiation in the background energy range. For the example of Table 1, the background range is approximately as wide as the signal range.
- Details of the probe electronics are set forth in Figs. 11 through 14.
Preamplifier 220 which is shown in Fig. 11, is a high gain low-noise design that produces a voltage pulse directly proportional to the amount of energy that entersdetector 60 to which it is connected. This typb of preamplifier is generally known in the art as a charge-sensitive preamplifier. A high voltage input is applied to a filter network comprising resistors Rl, R2, and R3 and capacitors Cl and C2. This network filters out short term variations in the high voltage power supply and provides the correct bias voltage to the detector. - The output of this network is supplied to
detector 60. When a photon of energy enters the detector, it produces an input pulse of electrons (or charge) that is coupled through capacitor C3 to the base of field effect transistor Ql which serves as the input stage of the preamplifier. Input transistor Ql is cascode coupled to transistor Q2, a low-noise field effect transistor such as a Texas Instrument type 2N 4857. Resistors R4 and R5, which are connected to the circuit's positive DC voltage, supply the proper bias voltage for transistor Q2. Capacitor C4 serves as a low impedance path for any spurious voltage occuring at the gate of Q2. - The current through transistors Ql and Q2 and resistor R7 varies in accordance with the magnitude of the electron pulse coupled to transistor Ql causing the voltage drop across R7 to vary proportionally. The varying voltage at the drain of transistor Q2 is thus applied to the gate of transistor Q3, also a Texas Instrument 2N 4857. Transistor Q3, which is stabilized against oscillation by capacitor C5 operates as a follower driving transistor amplifier Q4. Current through transistor Q3 is thus caused to vary in accordance with the magnitude of the input pulse. This current flows through transistor Q4, transistor Q5, and resistor R8. Transistors Q4 and Q5 are biased by a network comprising diodes Dl through D6 and resistor R9. Capacitor C6 filters the base of transistor Q4. Transistor Q5 serves as a constant current source for transistor Q4. Capacitor C7 suppresses transients at the base of transistor Q5. Resistor R8 limits current through transistors Q3, Q4, and Q5.
- Because the impedance looking into the collector of transistor Q5 is very large, a small change in current causes a very large change in voltage. The voltage produced at the collector of Q5 which is also proportional to the magnitude of the input pulse is connected to the base of transistor Q6 and the base of transistor Q7 which together with transistors Q10 and Qll and associated resistors R13, R14, R15, and R16 comprise a complementary Darlington output group which serves as a line driver. This line driver provides an output at the point of connection of R14 and R15 which varies proportionately with the magnitude of the input pulse to transistor Ql. Transistors Q8 and Q9 are biased by the network of diodes Dl through D6 and resistor R9 and serve as constant current loads for transistors Q6 and Q7, respectively, with current limiting and balancing provided by resistors Rll and R12. Capacitor Cll provides an AC return to ground for the collector of Q10.
- The resistor network comprising R18 through R21 is a voltage divider that provides DC feedback in the form of a small negative bias to Ql through resistor R6. AC feedback is supplied to transistor Ql by means of capacitor C9 which is also connected to resistor R6. Capacitor C12 serves to filter any variations in the voltage, typically -12 volts DC, which is supplied to resistor R21.
- The network comprising resistors R10 and C8 filters the positive direct current source, preferably 12 volts, used to drive all the transistors except those associated with the operation of the complementary Darlington output group. The network comprising R17 and capacitor C10 serves the same function for those transistors which are associated with the output group.
- As shown in Fig. 12,
differentiator 220 is a conventional differentiator implemented using an operational amplifier such as a 318-type amplifier.Integrator 230 likewise is a conventional integrator implemented in known fashion using another 318-type operational amplifier. - Details of sample and hold
circuit 240 and analog to digital (A/D)converter 250 are disclosed in Figure 13. As shown therein, sample and holdcircuit 240 comprises analog switches 610, 615,operational amplifiers comparators 630, 635,diodes capacitor 650,transistor 660 and flip-flops capacitor 650 and is read by A/D converter 250 from the output ofamplifier 625. To sample a signal, the output of comparator 635 must be low causingtransistor 660 to be on. As a result, the signal at the gate ofanalog switch 610 is high and a conductive path is established between the output ofintegrator 230 and the non-inverting input terminal ofamplifier 620. The signal to be sampled charges capacitor 650 throughamplifier 620 anddiode 645. The output ofamplifier 625 follows the voltage acrosscapacitor 650. After the peak of the signal being sampled is reached and the signal voltage begins to descend, the voltage at the output ofamplifier 620 becomes less than that acrosscapacitor 650 anddiode 645 becomes reverse biased. As a result, the peak voltage is stored bycapacitor 650 and is available at the output ofamplifier 625. - Comparator 635 functions as a peak detector. When the signal at the output of
amplifier 620 falls below that at the output ofamplifier 625, this is sensed by comparator 635 and its output goes high, turning offtransistor 660 and ending signal transmission throughanalog gate 610. At the same time, the signal from the output of comparator 635 clocks flip-flop 670 causing a start signal to be applied to analog todigital converter 250. The converter begins the process of forming a digital representation of the analog signal at the output ofamplifier 625. When this conversion is completed, this signal is transmitted via transmitter/receiver 260 andsignal cable 80 todata analyzer 90. - When the data signal has been received by the data analyzer, a signal is returned to the probe indicating that the data analyzer is ready to receive more data. This signal produces a PRESET signal which is applied to the output of flip-
flop 675 and also a RESET signal which is applied toanalog switch 615 to dump the signal stored bycapacitor 650. When the signal stored bycapacitor 650 is dissipated, the output ofamplifier 625 goes low enough that comparator 635 changes state once more, providing a low signal totransistor 660. This turns ontransistor 660 and makesanalog switch 610 conductive once more. As a result, the sample and hold circuit is again ready to process a signal.Comparator 630 operates as a low-level discriminator. If the signal at the output ofamplifier 625 is too low, as determined by the setting of potentiometer 632,comparator 630 holds the ouput of comparator 635 high and prevents the clocking of flip-flop 670. - Transmitter/
receiver 260 is a conventional circuit comprisinglogic gates 710,transistors 730 andtransformers 740. When a signal is to be transmitted, a high sync or data signal causes current flow in one direction in the appropriate transformer while a low sync or data signal causes current flow in the opposite direction. Signals from the data analyzer are received byamplifier 750. The output ofamplifier 750 is the PRESET signal applied to flip-flop 675. This signal is also inverted bytransistor 760 to supply the RESET signal. - The operation of our invention in making a borehole mineral assay will be apparent from the foregoing description. The borehole is drilled and the probe is lowered into the hole. As the probe is being lowered, the operator observes
light emitting diode 470 on the operator's control panel. If no radiation is received at the probe that is characteristic of the x-ray fluorescence spectrum of the element being assayed, the diode is not lighted and there is no reason to take an assay. When sufficient characteristic radiation is received, the diode alerts the operator to the desirability of performing an assay and the operator initiates the assay with the "Manual Assay" or "Auto Assay" key. After the data is recorded, the assay value is displayed ondisplay 370 and stored inRAM 340. - While the data of Table 1 relates to an assay for uranium, our invention may be practiced to assay any chemical element. Obviously, in such assays it may be desirable to use other sources to produce X-ray fluorescence and/or other detectors to sense the X-ray radiation. Its advantages in precious metals and rare elements exploration will be apparent.
- In addition to performing quantitative assays of the concentration of elements present in a matrix, our invention may also be used in a qualitative manner, for example, in a minerals survey. Thus, a probe containing a source having radiation of a wavelength appropriate to produce'X-ray fluorescence in every one of the chemical elements may be lowered into a borehole; and the X-ray spectrum produced by irradiation may be examined at each point in the spectrum where X-ray fluorescence would be produced by an element if the element in question were present. Once the presence of a particular chemical element was established, a quantitative assay of its concentration could be made. Combinations of qualitative and quantitative capabilities in the same equipment and in the same borehole assay will likewise be apparent.
- In addition to borehole mineral assays, our invention may be used in other fields of mineral exploration such as mine face assays and ground surface assays. The invention may also be used for remote sensing in other environments such as oceanographic and extra-terrestrial exploration. Since the apparatus does not have to be calibrated between periods of use, the speed of any assay or element detection procedure is greatly increased. Numerous other applications will be apparent: the bulk assay of ore as, for example, in grading and/or sorting devices, the detection of trace elements in process streams, quality assurance and material analysis. The invention can also be used to detect objects hidden in baggage or freight by using the invention to detect the presence of characteristic elements in such objects or characteristic concentrations of such elements. In medical applications, the invention may be used, for example, to monitor the movement of a chemical element through the body.
- Different configurations of the apparatus are used for different applications. The use of a probe for borehole assays is described in detail above. When used for surface assay applications, the source and detector advantageously are incorporated in a hand held pistol-like device. For medical applications, the source and detector advantageously are mounted on an articulated scanning head. One or more of these configurations will generally be suitable for the other applications described above.
- As will be apparent to those skilled in the art, our invention may be practiced in many forms. The specific electronic circuit described above for the probe and data analyzer are illustrative and alternatives will be apparent to those skilled in the art. If desired, a microprocessor can be incorporated into the probe itself where it can perform the assay and calculate percent concentration of the element. In such circumstance, only the results of the assay need be transmitted to a control unit and display located outside the borehole. For such a configuration, assay data advantageously would be stored at the control unit. Numerous other variations will be apparent to those skilled in the art.
- Advantageously, the detector is a cadmium telluride wafer operated at ambient temperature. While such a detector has relatively low resolution on the order of 7-12 KeV, the calibration procedure of our invention makes feasible the use of such a detector to perform quantitative assays and eliminates the need to recalibrate during or between assays. If desired our invention may also be practiced using other detectors such as Germanium or Mercuric Iodide. Other sources may be used to produce the X-ray fluorescence.
- Numerous variations may be made in the signal processing described. Obviously, the energy range of the Compton backscatter peak will vary depending on the energy or energies of the particular source used to irradiate the object to be assayed. Where the source has more than one emission energy, the particular energy range may be selected to optimize signal detection. Instead of using radiation in the range about the Compton backscatter peak for calibrating the source and detector, it may be advantageous to use any other available radiation peak. In general, however, the gain correction should use a ratio that is highly sensitive to small displacements in the energy ranges caused by gain shifts. The ratio of the radiation detected in a range adjacent the radiation peak to the radiation in the peak is quite sensitive to such small displacements since this ratio is relatively small when the gain is properly adjusted and is large when the gain is in error. Other ratios such as that of the radiation low on the slope of a radiation peak to that of the radiation high on such a slope may prove advantageous.
- If desired, portions of certain energy ranges may be ignored in calculations or modified to make further refinements in the invention. For example, since the K spectrum is a doublet, it may be desirable to divide the range where X-ray fluorescence is observed into two regions and combine the measurements made in each range with or without weighting of such measurements. Curve fitting methods other than least squares fits to straight lines and linear interpolation may also prove advantageous. These and numerous other variations will be apparent to those skilled in the art in light of the foregoing description.
Claims (25)


Applications Claiming Priority (2)
| Application Number | Priority Date | Filing Date | Title |
|---|---|---|---|
| US260984 | 1981-05-06 | ||
| US06/260,984 US4510573A (en) | 1981-05-06 | 1981-05-06 | Method for X-ray fluorescence spectroscopy |
Publications (2)
| Publication Number | Publication Date |
|---|---|
| EP0067514A1 true EP0067514A1 (en) | 1982-12-22 |
| EP0067514B1 EP0067514B1 (en) | 1988-01-13 |
Family
ID=22991486
Family Applications (1)
| Application Number | Title | Priority Date | Filing Date |
|---|---|---|---|
| EP82302241A Expired EP0067514B1 (en) | 1981-05-06 | 1982-04-30 | Method and apparatus for x-ray fluorescence spectroscopy |
Country Status (17)
| Country | Link |
|---|---|
| US (1) | US4510573A (en) |
| EP (1) | EP0067514B1 (en) |
| JP (1) | JPS585640A (en) |
| AU (1) | AU565651B2 (en) |
| BR (1) | BR8202588A (en) |
| CA (1) | CA1192319A (en) |
| DE (1) | DE3277989D1 (en) |
| ES (1) | ES511929A0 (en) |
| IL (1) | IL65636A (en) |
| IN (1) | IN158562B (en) |
| MA (1) | MA19466A1 (en) |
| MX (1) | MX153173A (en) |
| NO (1) | NO821483L (en) |
| NZ (1) | NZ200487A (en) |
| PH (1) | PH20139A (en) |
| ZA (1) | ZA822788B (en) |
| ZW (1) | ZW8282A1 (en) |
Cited By (7)
| Publication number | Priority date | Publication date | Assignee | Title |
|---|---|---|---|---|
| GB2196113A (en) * | 1986-09-12 | 1988-04-20 | Nat Res Dev | Ore analysis |
| WO1993017326A1 (en) * | 1992-02-29 | 1993-09-02 | Sedco Forex Technology Inc | Analysis of drilling fluids |
| US7536186B2 (en) | 2003-08-26 | 2009-05-19 | Motorola, Inc. | System to improve handover behavior |
| EP2271918A2 (en) * | 2008-04-24 | 2011-01-12 | Chevron U.S.A. Incorporated | Device and method for detecting deposits on an inner surface of a passage |
| GB2572569A (en) * | 2018-04-03 | 2019-10-09 | Mineral Explor Network Finland Ltd | Nugget effect grade assessment |
| CN111812720A (en) * | 2020-06-29 | 2020-10-23 | 山东大学 | Novel tracing method and device based on electromagnetic field |
| CN111812724A (en) * | 2020-06-29 | 2020-10-23 | 山东大学 | Hidden karst pipeline detection method and system |
Families Citing this family (25)
| Publication number | Priority date | Publication date | Assignee | Title |
|---|---|---|---|---|
| US4580049A (en) * | 1983-04-11 | 1986-04-01 | Preussag Aktiengesellschaft | Probe for locating mineral deposits |
| JPS59177290U (en) * | 1983-05-16 | 1984-11-27 | パイオニア株式会社 | speaker |
| US4839913A (en) * | 1987-04-20 | 1989-06-13 | American Science And Engineering, Inc. | Shadowgraph imaging using scatter and fluorescence |
| US4797906A (en) * | 1987-09-28 | 1989-01-10 | Amoco Corporation | Nondestructive method for analyzing total porosity of thin sections |
| US4996421A (en) * | 1988-10-31 | 1991-02-26 | Amoco Corporation | Method an system of geophysical exploration |
| JP2853261B2 (en) * | 1989-05-16 | 1999-02-03 | 三菱マテリアル株式会社 | Metal analysis method and analyzer |
| US5014287A (en) * | 1990-04-18 | 1991-05-07 | Thornton Michael G | Portable x-ray fluorescence spectrometer for environmental monitoring of inorganic pollutants |
| US5128882A (en) * | 1990-08-22 | 1992-07-07 | The United States Of America As Represented By The Secretary Of The Army | Device for measuring reflectance and fluorescence of in-situ soil |
| US5418826A (en) * | 1992-10-11 | 1995-05-23 | Horiba, Ltd. | Fluorescent X-ray qualitative analytical method |
| US5745369A (en) * | 1995-05-30 | 1998-04-28 | Horiba Ltd. | Method and apparatus for determining a peak position of a spectrum |
| US5753921A (en) * | 1996-07-16 | 1998-05-19 | Eastman Kodak Company | X-ray imaging detector with limited substrate and converter |
| US5650626A (en) * | 1996-07-16 | 1997-07-22 | Eastman Kodak Company | X-ray imaging detector with thickness and composition limited substrate |
| US5841016A (en) * | 1996-09-12 | 1998-11-24 | Advanced Micro Devices, Inc. | Ultra-low level standard for concentration measurements |
| US5866899A (en) * | 1996-09-12 | 1999-02-02 | Advanced Micro Devices, Inc. | Concentration measurement apparatus calibration method |
| US6256373B1 (en) * | 1998-08-19 | 2001-07-03 | Karl Bernstein | X-ray fluorescence instrument |
| US6097785A (en) * | 1998-10-30 | 2000-08-01 | The United States Of America As Represented By The Secretary Of The Navy | Cone penetrometer utilizing an X-ray fluorescence metals sensor |
| US20050232392A1 (en) * | 2004-02-25 | 2005-10-20 | Keith Bradley | Nanostructure field emission x-ray analysis |
| KR100568703B1 (en) * | 2004-08-10 | 2006-04-07 | 삼성전자주식회사 | Thickness measurement method of metal layer and thickness measurement apparatus using the same |
| US7635838B2 (en) * | 2007-12-31 | 2009-12-22 | Schlumberger Technology Corporation | Methods and apparatus for exploring geological formations utilizing strontium measurements |
| US20100080351A1 (en) * | 2008-09-26 | 2010-04-01 | i-Nalysis LLC | Handheld spectrometer |
| US7960687B1 (en) * | 2010-09-30 | 2011-06-14 | Schlumberger Technology Corporation | Sourceless downhole X-ray tool |
| US9708907B2 (en) | 2011-04-26 | 2017-07-18 | Baker Hughes Incorporated | Apparatus and method for estimating formation lithology using X-ray flourescence |
| US9329122B2 (en) | 2011-08-15 | 2016-05-03 | Schlumberger Technology Corporation | Diffuse reflectance infrared fourier transform spectroscopy for characterization of earth materials |
| CN102944570B (en) * | 2012-12-02 | 2014-11-26 | 天津陆海石油设备系统工程有限责任公司 | Analysis method for rock sample lithology denomination based on X-ray element fluorescence |
| MX2016004720A (en) | 2013-11-11 | 2016-12-02 | Halliburton Energy Services Inc | Improved determination of fluid compositions. |
Citations (4)
| Publication number | Priority date | Publication date | Assignee | Title |
|---|---|---|---|---|
| US3263082A (en) * | 1963-06-17 | 1966-07-26 | Mobil Oil Corp | Geological prospecting comprising directional irradiation and detection |
| GB1259220A (en) * | 1969-12-02 | 1972-01-05 | ||
| US4016419A (en) * | 1974-09-30 | 1977-04-05 | Horiba, Ltd. | Non-dispersive X-ray fluorescence analyzer |
| US4045676A (en) * | 1974-03-15 | 1977-08-30 | Ortec Incorporated | Determining element concentrations in samples |
Family Cites Families (6)
| Publication number | Priority date | Publication date | Assignee | Title |
|---|---|---|---|---|
| US3703726A (en) * | 1970-12-31 | 1972-11-21 | Corning Glass Works | Quantitative chemical analysis by x-ray emission spectroscopy |
| US4021667A (en) * | 1973-08-06 | 1977-05-03 | Columbia Scientific Industries Corporation | High speed pulse processing |
| US4031367A (en) * | 1975-03-31 | 1977-06-21 | Schlumberger Technology Corporation | Methods and apparatus for pulse height analyzer offset control |
| US4066892A (en) * | 1976-08-16 | 1978-01-03 | Mobil Oil Corporation | Coal logging system |
| US4349736A (en) * | 1977-10-17 | 1982-09-14 | Miller Bob R | Method for locating and evaluating subsurface uranium deposits having an apparent grade of up to approximately 5% contained U3 O8 |
| US4362935A (en) * | 1979-02-09 | 1982-12-07 | Martin Marietta Corporation | Field portable element analysis unit |
-
1981
- 1981-05-06 US US06/260,984 patent/US4510573A/en not_active Expired - Fee Related
-
1982
- 1982-04-22 CA CA000401464A patent/CA1192319A/en not_active Expired
- 1982-04-23 ZA ZA822788A patent/ZA822788B/en unknown
- 1982-04-26 ZW ZW82/82A patent/ZW8282A1/en unknown
- 1982-04-27 IL IL65636A patent/IL65636A/en unknown
- 1982-04-28 AU AU83089/82A patent/AU565651B2/en not_active Ceased
- 1982-04-30 EP EP82302241A patent/EP0067514B1/en not_active Expired
- 1982-04-30 DE DE8282302241T patent/DE3277989D1/en not_active Expired
- 1982-04-30 NZ NZ200487A patent/NZ200487A/en unknown
- 1982-05-04 PH PH27230A patent/PH20139A/en unknown
- 1982-05-05 NO NO821483A patent/NO821483L/en unknown
- 1982-05-05 ES ES511929A patent/ES511929A0/en active Granted
- 1982-05-05 BR BR8202588A patent/BR8202588A/en unknown
- 1982-05-06 JP JP57074659A patent/JPS585640A/en active Pending
- 1982-05-06 MA MA19672A patent/MA19466A1/en unknown
- 1982-05-06 MX MX192565A patent/MX153173A/en unknown
- 1982-06-02 IN IN423/DEL/82A patent/IN158562B/en unknown
Patent Citations (4)
| Publication number | Priority date | Publication date | Assignee | Title |
|---|---|---|---|---|
| US3263082A (en) * | 1963-06-17 | 1966-07-26 | Mobil Oil Corp | Geological prospecting comprising directional irradiation and detection |
| GB1259220A (en) * | 1969-12-02 | 1972-01-05 | ||
| US4045676A (en) * | 1974-03-15 | 1977-08-30 | Ortec Incorporated | Determining element concentrations in samples |
| US4016419A (en) * | 1974-09-30 | 1977-04-05 | Horiba, Ltd. | Non-dispersive X-ray fluorescence analyzer |
Non-Patent Citations (1)
| Title |
|---|
| IEEE TRANSACTIONS ON NUCLEAR SCIENCE, vol. NS-25, no. 1, February 1978, pages 790-793, New York (USA) R.F. HILL et al.: "Portable X-ray analyzer for in situ gold qualification" * |
Cited By (12)
| Publication number | Priority date | Publication date | Assignee | Title |
|---|---|---|---|---|
| GB2196113A (en) * | 1986-09-12 | 1988-04-20 | Nat Res Dev | Ore analysis |
| GB2196113B (en) * | 1986-09-12 | 1990-12-12 | Nat Res Dev | Ore analysis |
| US5020084A (en) * | 1986-09-12 | 1991-05-28 | National Research Development Corporation | Ore analysis |
| WO1993017326A1 (en) * | 1992-02-29 | 1993-09-02 | Sedco Forex Technology Inc | Analysis of drilling fluids |
| US7536186B2 (en) | 2003-08-26 | 2009-05-19 | Motorola, Inc. | System to improve handover behavior |
| EP2271918A2 (en) * | 2008-04-24 | 2011-01-12 | Chevron U.S.A. Incorporated | Device and method for detecting deposits on an inner surface of a passage |
| EP2271918A4 (en) * | 2008-04-24 | 2012-04-25 | Chevron Usa Inc | Device and method for detecting deposits on an inner surface of a passage |
| GB2572569A (en) * | 2018-04-03 | 2019-10-09 | Mineral Explor Network Finland Ltd | Nugget effect grade assessment |
| GB2572569B (en) * | 2018-04-03 | 2022-04-13 | Mineral Explor Network Finland Ltd | Nugget effect grade assessment |
| CN111812720A (en) * | 2020-06-29 | 2020-10-23 | 山东大学 | Novel tracing method and device based on electromagnetic field |
| CN111812724A (en) * | 2020-06-29 | 2020-10-23 | 山东大学 | Hidden karst pipeline detection method and system |
| CN111812720B (en) * | 2020-06-29 | 2021-10-08 | 山东大学 | Novel tracing method and device based on electromagnetic field |
Also Published As
| Publication number | Publication date |
|---|---|
| AU8308982A (en) | 1982-11-11 |
| MX153173A (en) | 1986-08-15 |
| ES8401628A1 (en) | 1983-12-01 |
| BR8202588A (en) | 1983-04-19 |
| IL65636A0 (en) | 1982-07-30 |
| DE3277989D1 (en) | 1988-02-18 |
| NO821483L (en) | 1982-11-08 |
| ES511929A0 (en) | 1983-12-01 |
| NZ200487A (en) | 1985-08-30 |
| ZW8282A1 (en) | 1982-07-21 |
| AU565651B2 (en) | 1987-09-24 |
| CA1192319A (en) | 1985-08-20 |
| MA19466A1 (en) | 1982-12-31 |
| EP0067514B1 (en) | 1988-01-13 |
| PH20139A (en) | 1986-10-02 |
| JPS585640A (en) | 1983-01-13 |
| IL65636A (en) | 1987-12-20 |
| IN158562B (en) | 1986-12-13 |
| ZA822788B (en) | 1983-04-27 |
| US4510573A (en) | 1985-04-09 |
Similar Documents
| Publication | Publication Date | Title |
|---|---|---|
| US4510573A (en) | Method for X-ray fluorescence spectroscopy | |
| US3843881A (en) | Detection of elements by irradiating material and measuring scattered radiation at two energy levels | |
| EP1114310B1 (en) | X-ray fluorescence elemental analyzer | |
| Argyraki et al. | Evaluation of portable X-ray fluorescence instrumentation for in situ measurements of lead on contaminated land | |
| US4053767A (en) | Method and apparatus for stabilizing signals in radioactive well logging tools | |
| EP1327878B1 (en) | Low activity nuclear density gauge | |
| AU2006296785A1 (en) | Process and device for fast or on-line determination of the components of a two-component or multiple-component system | |
| US3983392A (en) | Method and apparatus for measuring incombustible content of coal mine dust using gamma-ray backscatter | |
| US3767921A (en) | Well logging system with linearity control | |
| GB1560845A (en) | Quench determination in liquid scintillation counting systems | |
| EP0879410A1 (en) | Method and apparatus for remote density measurement | |
| US4769541A (en) | Spectrometric gamma diagraphy system for the determination of the geological parameters of a rock | |
| US2983817A (en) | Neutron-capture, gamma-ray prospecting method | |
| EP0091294A2 (en) | Method for monitoring drilling materials for gamma ray activity | |
| US4119847A (en) | Calibrator for radioactivity well logging tools | |
| US4085323A (en) | Calibrator for radioactivity well logging tools | |
| Loevborg et al. | Drill-core scanning for radioelements by gamma-ray spectrometry | |
| US3414725A (en) | Apparatus for the determination of opacity to radiation per unit of thickness of objects | |
| Rhodes et al. | Application of a microprocessor-based portable XRF analyzer in minerals analysis | |
| GB2136562A (en) | Formation density logging while drilling | |
| Borsaru et al. | Low radioactivity portable coal face ash analyser | |
| DE1960508A1 (en) | Radioisotope X-ray fluorescence analyzer for elemental analysis of rocks and ores under natural storage conditions | |
| RU2249836C1 (en) | Device for running lithologic-density gamma-ray logging | |
| SU329830A1 (en) | X-RADIOMETRIC ANALYZER TO DETERMINE THE CONTENT OF HEAVY ELEMENTS IN ORE | |
| Gravitis et al. | Determination of solids weight fraction and ash content of coal in slurries of variable voidage: laboratory measurements |
Legal Events
| Date | Code | Title | Description |
|---|---|---|---|
| PUAI | Public reference made under article 153(3) epc to a published international application that has entered the european phase |
Free format text: ORIGINAL CODE: 0009012 |
|
| AK | Designated contracting states |
Designated state(s): DE FR GB IT SE |
|
| 17P | Request for examination filed |
Effective date: 19830621 |
|
| GRAA | (expected) grant |
Free format text: ORIGINAL CODE: 0009210 |
|
| AK | Designated contracting states |
Kind code of ref document: B1 Designated state(s): DE FR GB IT SE |
|
| ITF | It: translation for a ep patent filed |
Owner name: JACOBACCI & PERANI S.P.A. |
|
| REF | Corresponds to: |
Ref document number: 3277989 Country of ref document: DE Date of ref document: 19880218 |
|
| ET | Fr: translation filed | ||
| REG | Reference to a national code |
Ref country code: GB Ref legal event code: 732 |
|
| REG | Reference to a national code |
Ref country code: FR Ref legal event code: TP |
|
| PLBE | No opposition filed within time limit |
Free format text: ORIGINAL CODE: 0009261 |
|
| STAA | Information on the status of an ep patent application or granted ep patent |
Free format text: STATUS: NO OPPOSITION FILED WITHIN TIME LIMIT |
|
| PG25 | Lapsed in a contracting state [announced via postgrant information from national office to epo] |
Ref country code: DE Effective date: 19890103 |
|
| 26N | No opposition filed | ||
| EAL | Se: european patent in force in sweden |
Ref document number: 82302241.3 |
|
| PGFP | Annual fee paid to national office [announced via postgrant information from national office to epo] |
Ref country code: FR Payment date: 19960429 Year of fee payment: 15 |
|
| PGFP | Annual fee paid to national office [announced via postgrant information from national office to epo] |
Ref country code: GB Payment date: 19960430 Year of fee payment: 15 |
|
| PGFP | Annual fee paid to national office [announced via postgrant information from national office to epo] |
Ref country code: SE Payment date: 19960517 Year of fee payment: 15 |
|
| PG25 | Lapsed in a contracting state [announced via postgrant information from national office to epo] |
Ref country code: GB Effective date: 19970430 |
|
| PG25 | Lapsed in a contracting state [announced via postgrant information from national office to epo] |
Ref country code: SE Effective date: 19970501 |
|
| GBPC | Gb: european patent ceased through non-payment of renewal fee |
Effective date: 19970430 |
|
| PG25 | Lapsed in a contracting state [announced via postgrant information from national office to epo] |
Ref country code: FR Free format text: LAPSE BECAUSE OF NON-PAYMENT OF DUE FEES Effective date: 19971231 |
|
| EUG | Se: european patent has lapsed |
Ref document number: 82302241.3 |
|
| REG | Reference to a national code |
Ref country code: FR Ref legal event code: ST |